Curry and Mosher claim that UHI has no impact on rural vs. urban temperature trends. I put that to the test in New South Wales, with two of the longest temperature records in Australia.
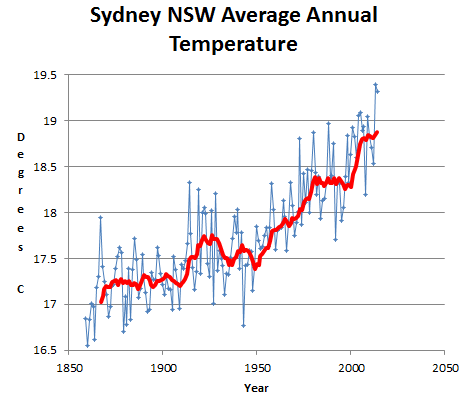
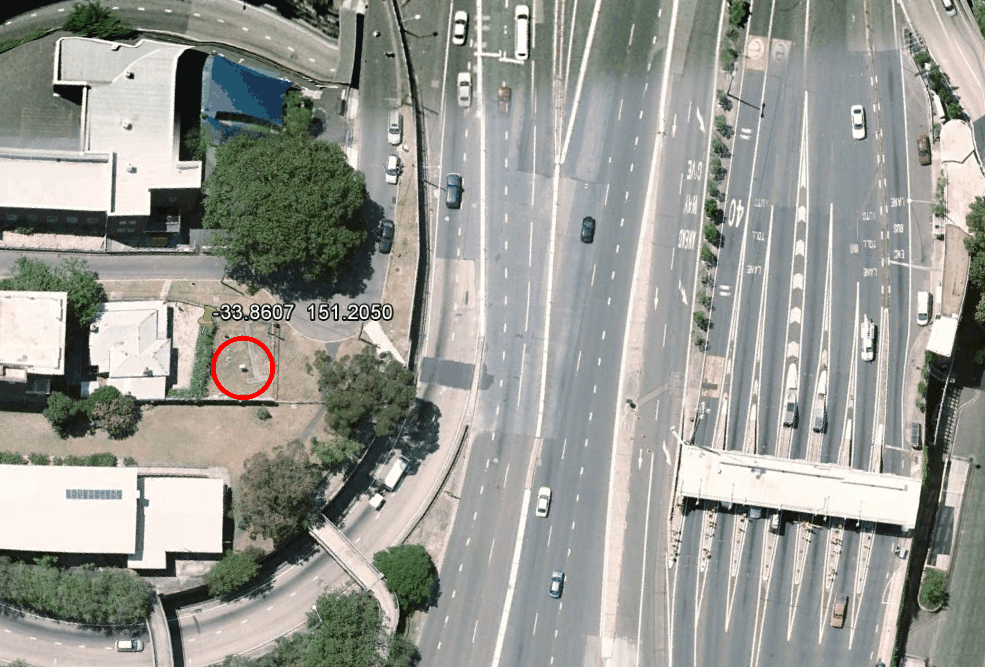
Sydney Observatory is right next to 20 lanes of asphalt and has warmed almost 2C since 1860.
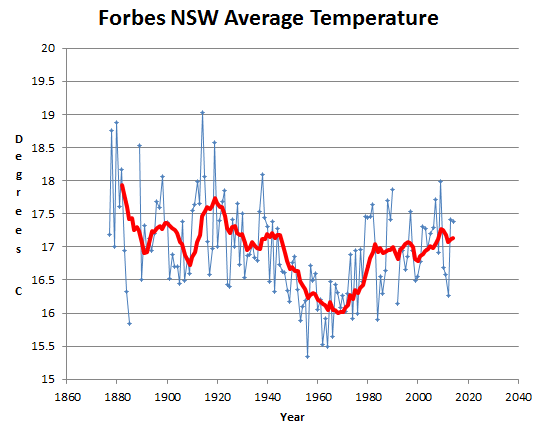
Forbes is a rural station and has cooled about one degree since the 1870’s.
This is the same pattern we see at all the old rural stations in Australia like Deniliquin, Bourke, etc. SE Australia has cooled since the 19th century.
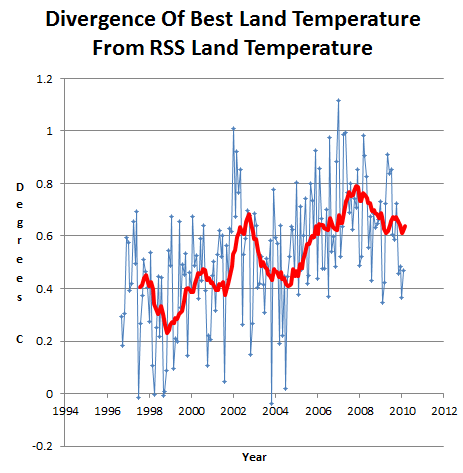
Satellites show that Berkeley Earth land temperatures are diverging from atmospheric temperatures in a hockey stick. A smoking gun that Berkeley Earth is severely tainted by UHI.
www.woodfortrees.org/data/rss-land/from:1996.5/plot/best/from:1996.5
The correct conclusion for Curry and Mosher to have drawn from their study is that their approach, including using the Modis night lights approach to identifying rural stations, is flawed – rather than their nonsensical conclusion that UHI hasn’t affected the temperature record.
Richard Muller, the fake skeptic who runs Berkeley Earth, wanted to prove that the hockey stick is correct.
By Richard Muller on December 17, 2003
Let me be clear. My own reading of the literature and study of paleoclimate suggests strongly that carbon dioxide from burning of fossil fuels will prove to be the greatest pollutant of human history. It is likely to have severe and detrimental effects on global climate. I would love to believe that the results of Mann et al. are correct, and that the last few years have been the warmest in a millennium.





BUT,BUT,But,but Steve,
You hand cherry picked the data while The Mosh Pup et al use an AlGoreRhythm so the data is untouched by human hands.
Everyone knows computers never ever make mistakes.
I thought I would beat zeke and mosher to the punch.
http://imageprocessor.websimages.com/width/280/crop/0,0,280×280/www.countingthevote.ca/to_err_is_human.jpg
I suggest we have a global warming debate on my mountain this week. It is nearly March and colder than any week this year.
This debate has one rule: anyone saying that it is getting warmer has to wear no winter clothing, preferably only a swim suit. The winner is the one who isn’t dead in three hours.
Some proper scientists studied UHI in South Korea since 1954. They concluded that in most cities it was over 1C.
Averaged over the whole country (incl rural areas) it amounted to 0.77C
At several cities, GISS actually cool past temperatures in their UHI adj, and overall there is no allowance at all for UHI.
https://notalotofpeopleknowthat.wordpress.com/2015/02/14/uhi-in-south-korea-ignored-by-giss/
Unfortunately, all Mosher and Curry have proven is how much the dataset has been tampered with.
+1
I agree with Blade, as I said before you do not mess with the data.
You can do an analysis and give evidence as to why you think your interpretation is correct. But you certainly do not present to the public mangled data WITHOUT the original data and the reasons.
Try doing the same with your tax records and see what the revenuers think of the mangled financial data without the original data front and center.
One of the best papers I ever saw on UHI showed that the heat forms concentric domes of increasing temperature the closer one gets to the center of an urban area. The study used London as the subject and found a total increase of over 7F. Even the ‘outlying’ areas were effected by the nearby city, to the tune of 2-3F.
Scientists first discovered the heat island effect in the 1800s when they observed cities growing warmer than surrounding rural areas, particularly in summer. Urban surfaces of asphalt, concrete, and other materials — also referred to as “impervious surfaces” — absorb more solar radiation by day. At night, much of that heat is given up to the urban air, creating a warm bubble over a city that can be as much as 1 to 3°C (2 to 5°F) higher than temperatures in surrounding rural areas.
…
When examining cities in arid and semi-arid regions – such as North Africa and the American Southwest — scientists found that they are only slightly warmer than surrounding areas in summer and sometimes cooler than surrounding areas in winter. In the U.S., the summertime urban heat island (UHI) for desert cities like Las Vegas was 0.46°C lower than surrounding areas, compared to 10°C higher for cities like Baltimore. Globally, the differences were not as large, with a summertime UHI of -0.21°C for desert cities compared to +3.8°C for cities in forested regions.
http://www.nasa.gov/mission_pages/terra/news/heat-islands.html
But hey, “the science is settled” right?
OK, but the temps used for claiming global warming, are biased by UHI as the areas least affected by UHI are ignored. Is that not true?
That to me is why UHI is so important.
I regret seeing Dr. Curry and Mosher lumped together, but scientists and pseudo-scientists have a choice to:
1. Accept public funds to adjust, hide or manipulate data to support UN’s totalitarian control of the world under UN’s Agenda 21:
http://habitat.igc.org/agenda21/index.htm
2. Honestly consider and debate data and observations that show a much Higher Power than the UN is the benevolent creator and sustainer of every atom and life in the world:
https://dl.dropboxusercontent.com/u/10640850/Solar_Energy_For_Review.pdf
I always thought that John Daly’s site What the Stations Say had some good rural vs urban info and I especially thought his West Point vs New York city was telling.
http://www.john-daly.com/stations/stations.htm
John was a real winner!!
That is why the B@$tards celebrated his death.
Steven,
My attempts to post on Real Science have recently failed.
Have I done something wrong or is this a random glitch in the computer?
I am also getting censored by WordUnimpressed.
My last three comments completely disappeared. This has happened several times in the last couple of months and not just at Tony’s site. It also happened at Jo Nova’s and ChiefIO’s
I regret seeing Dr. Curry and Mosher lumped together, but scientists and pseudo-scientists have a choice to:
1. Accept public funds to adjust, hide or manipulate data to support UN’s totalitarian control of the world under UN’s Agenda 21:
http://habitat.igc.org/agenda21/index.htm
2. Honestly consider and debate data and observations that show a much Higher Power than the UN is in control of Earth’s climate as well as every atom and life in the world:
https://dl.dropboxusercontent.com/u/10640850/Solar_Energy_For_Review.pdf
So when are Mosher and Curry going to admit they’re wrong?
Never. People like Mosh are never wrong. He must have gotten 100% on all the tests he has ever written.
That’s why Max Planck said…
“Science advances one funeral at a time.”
Mosh is not a scientist. Dr. Curry is the one facing the dilemma:
Science or Funding
Who said Mosh was a scientist?
GRRRrrrr WordUnimpress is in Censorship mode again!
http://quadrant.org.au/opinion/doomed-planet/2009/11/john-l-daly/
Read about the flak John took and the glee with which the ClimAstrologists greeted the news of his death.
I have not been able to post the paragraph here.
No that is down right weird. WordUnimpress did not post my comments above for five minuets or more. They just disappeared. Now they are up.
Mine belatedly appeared too.
Perhaps Big Brother doesn’t want any attention brought to UN’s Agenda 21!
John Daly was a giant. He fought tooth and nail in a time where all they dire predictions made about AGW had still to be tested. Now we have the luxury of hindsight as time as shown us that nothing, not one of those shrill predictions came to pass. So in many ways it’s easier for us now to be heard even thought the left increasingly jumped on the AGW bandwagon. I agree with that author about John Daly and have said what a hero he is of mine several times on this blog.
Yes, john Daly had the courage of his convictions. MIT’s Professor Lindzen has also stood his ground.
In 1945, my research mentor, Paul K. Kuroda, secretly took possession of Japan’s plans on how to build atomic bombs and retained them for the next fifty-seven years, until 2002, in order to show that consensus scientists lied to public about the source of energy that powers atomic bombs, nuclear reactors and Earth’s heat source.
When you subtract the Forbes temperature from the Sydney temperature do you get a (more or less) linear line angling up? Maybe not linear, but some function that would reflect population growth. This would create a more obvious indication of UHI by canceling out the weather common to both sites.
Global Urban Heat Island Effect Study: An Update « Roy Spencer, PhD
http://www.drroyspencer.com/2010/03/global-urban-heat-island-effect-study-an-update/
Dr Spencer uses population density.
Steven, you may like to know that Mosher has posted quite a few links to UHI Studies using BEST algorithms and they do actually work, please take a look for yourself. (Note they convert back to absolutes, the thing they say is a no can do)
But now look at what they present to the Public here
http://berkeleyearth.lbl.gov/locations/37.78N-126.10E
and compare it the Station that they coose for their UHI proof
http://berkeleyearth.lbl.gov/stations/156456
and look at what the Trend is after Break Point Adjustments compared to the Trend and Shape that they present to the public.
See how easy it is to fool people.
I found the same thing for London and the Heathrow Station they chose..
I’m not sure what you are saying
What I am saying is that BEST do have very good UHI adjustment, but they don’t use it on the data they show to the public.
That doesn’t make sense.
It almost looks like they have found the UHI bias then adjusted in the direction of the UHI bias.
Pielke Snr has written on the temperature effect land use changes many time. Here is one for example:
Why is Land Use/Land Cover Change a First-Order Climate Forcing?
In climate speak the acronym is LULCC for “land-use and land-cover changes”. It makes complete logical sense that clearing for agriculture would have a significant warming effect through lower cloud cover (since cloud cover is related to tree transpiration – as in the Amazon). Then there is the radiative differences between foliage and dark coloured plowed ground. And etc.
Roy Spencer has shown that population density has a large warming effect even for quite small numbers of people:
The Global Average Urban Heat Island Effect in 2000 Estimated from Station Temperatures and Population Density Data
Only 25 people per square km can be seen to result in 0.8 C temperature rise in the last of the graphs in the article. By contrast the entire global temperature rise last century was about the same as this.
So calling it UHIE is a bit of a misnomer since about a third of it has already occurred by the time you get to 25 people per km^2. Which would usually be regarded Class A rural.
Interesting that the Sydney temperatures began to “climb” in the 1950s – just about the time that they built the Cahill Expressway – and put the loop of asphalt (LHS of photo) around the weather station.
This thread is just more evidence that the government funded data sets are a bunch of lies and distortions. Disgusting.