One of the biggest scams alarmists are trying to pull is the claim that the surface data sets are independent, and they all show the same thing. Carl Mears used that as an excuse to ignore his own satellite data – which shows no warming for 19 years.
There is nothing independent about the data sets. GISS uses the same adjusted GHCN data as NCDC. But it is worse than it seems.
HadCrut didn’t used to agree with GISS, and they were upset about it – so they changed HadCrut to make it match GHCN.
The data sets have been carefully and repeatedly tampered with to bring them to their current fully fraudulent state.
1974
They have almost completely eliminated the 1940 to 1970 cooling.
But it is worse than it seems. In 1999, Hansen lamented that the US data set didn’t show any warming. So he and NCDC got together and changed the US data set.
And in 2008, Real Climate said that the HadCrut decadal pause was too short. RSS is up to 19 years, so they simply ignore it.
Enron accountants would blush at these tactics.
Look for the satellite data to be adjusted to bring it into compliance with the fully fraudulent surface temperatures. The Guardian is now working to discredit UAH, so it seems likely that RSS will soon be making big changes – to match the needs of the climate mafia. Bookmark this post.

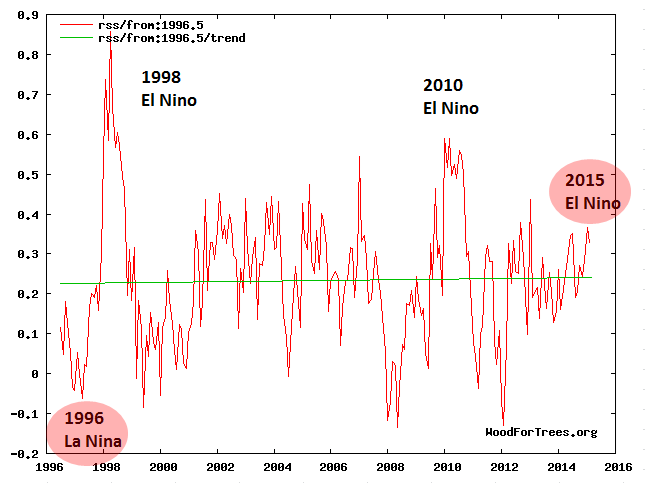
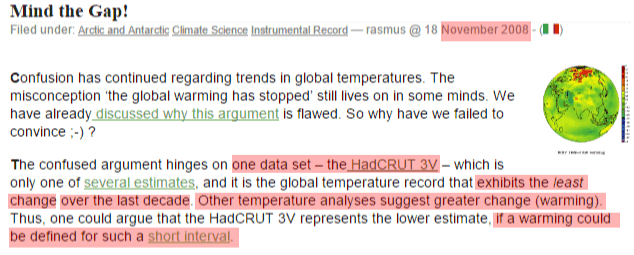
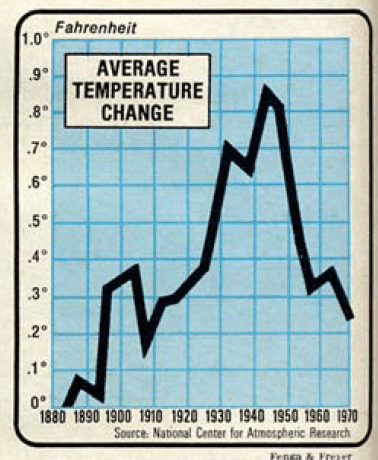
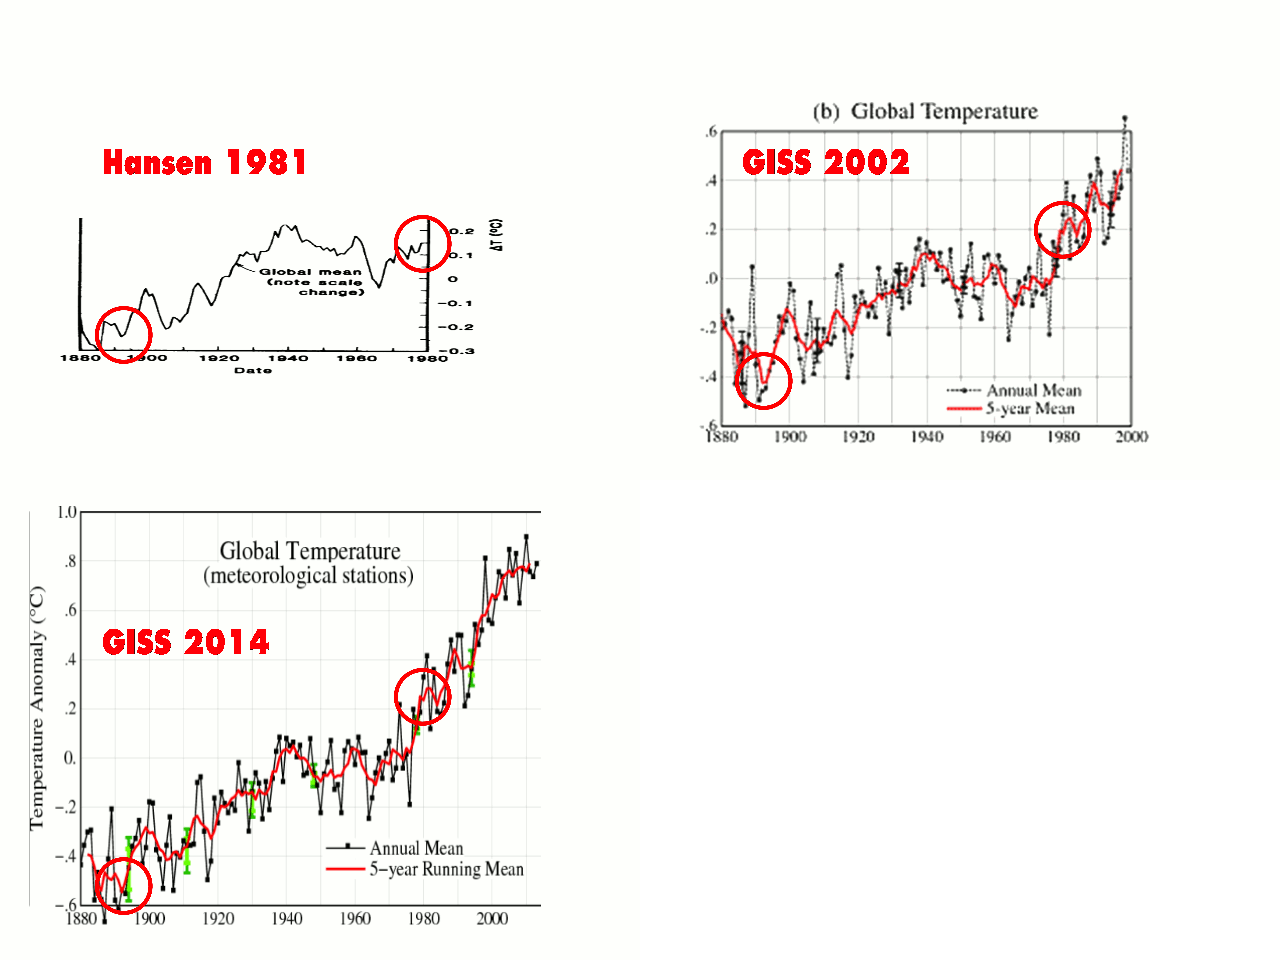
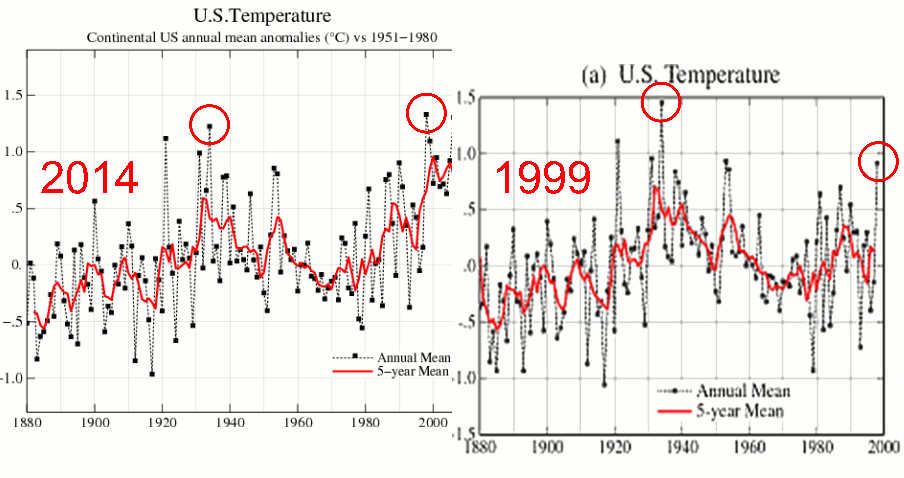
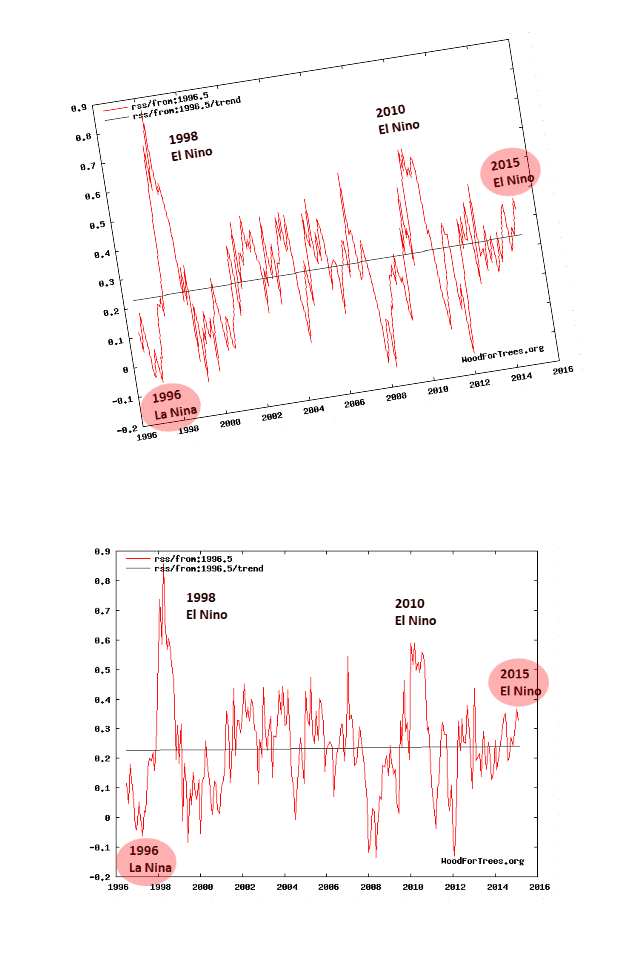

I never get enough of seeing those graphs. They are just so damning.
+1
My favorite is this:
https://stevengoddard.files.wordpress.com/2014/10/screenhunter_3332-oct-05-05-19.gif
https://stevengoddard.files.wordpress.com/2014/10/screenhunter_3233-oct-01-22-59.gif
https://stevengoddard.files.wordpress.com/2014/10/screenhunter_3232-oct-01-22-58.gif
RESULT:
https://stevengoddard.files.wordpress.com/2014/10/screenhunter_3231-oct-01-22-56.gif
From:
stevengoddard.wordpress(dot)com/2014/10/02/co2-drives-ncdc-data-tampering/
and
stevengoddard.wordpress(DOT)com/2014/10/05/us-temperatures-show-no-correlation-with-co2-2/
To anyone with any statisitics background that is very very damning.
I love those graphs too and just realized for the firt time the implications of the dip in the adjustment graph right around 350ppm.
This is one of my favorite graphs, never tire of posting it…
https://junksciencecom.files.wordpress.com/2013/05/slocum-graph.jpg
Yes I love that one too.
This is the one that is a real classic. I had a copy posted in my office at work.
Probably the best statistical graphic ever drawn, this map by Charles Joseph Minard portrays the losses suffered by Napoleon’s army in the Russian campaign of 1812. Beginning at the Polish-Russian border, the thick band shows the size of the army at each position. The path of Napoleon’s retreat from Moscow in the bitterly cold winter is depicted by the dark lower band, which is tied to temperature and time scales. (You can go to the website for enlargable graph.)
http://nowscape.com/images/map_napoleon_moscow.gif
It is a graph that should be shoved into the face of every warmist.
COLD KILLS!
Most warmists have trouble reading graphs. They’d have to be told what it means. But they only listen to interpretations from their religious leaders. And their religious leaders don’t show them (and interpret for them) any graphs that upset the paradigm.
They will need to be knee deep in snow in July before they figure out they’ve been lied to. Even then, there will be the holdouts who will blame fossil fuel companies for the warmest July snow on record.
Thank you Tony.
(Yes Scottish Sceptic – the corruption of the climate record, and the collusion by those involved in it, is terribly damning.)
Well, they just issued a huge lie about the Antarctic ice today. During record ice growth there, they are screaming that is it melting faster and faster which is utterly insane.
They play games.
Sea Ice the stuff that matters most because of albedo, forms a circular ring whose edge is between 62 south and 60 south latitude is growing. This matters because the more sea ice the more sunshine it reflects. link
SOME of the Antarctic Ice in SOME areas is melting because of volcanoes and other geo-thermal activity. That of course is what these propagandists point to….
OH Look a Squirrel!
http://www.ci.olney.il.us/visitors/white_squirrels/images/Banner_Squirrel_5.jpg
About those GHCN adjustments.
We have 23 long-service USHCN stations top-rated for their siting away from urban heat source. The raw data shows diversity of climate patterns and a modest average warming trend over the last century.
GHCN adjusted data warms the average station by +0.58 C/Century, from +.18C to +.76C, comparing adjusted to unadjusted records.
19 station records were warmed, 6 of them by more than +1 C/century. 4 stations were cooled, most of the total cooling coming at one station, Tallahassee. Adjustments take the form of selective cooling of the past, along with deletion of years of data.
So for this set of stations, the chance of adjustments producing warming is 19/23 or 83%.
Details and supporting excel workbooks are here: https://rclutz.wordpress.com/2015/03/17/adjustments-multiply-warming-at-us-crn1-stations
A look at adjustments:
TOBS
https://stevengoddard.wordpress.com/2015/01/06/fixing-the-past-at-the-ministry-of-truth/#comment-477742
Station Dropout
https://stevengoddard.wordpress.com/2015/01/18/how-gavin-cheated-to-create-the-required-talking-point/#comment-482838
Switch from glass to thermistors
https://stevengoddard.wordpress.com/2015/01/19/hansen-and-mann-hiding-the-other-decline/#comment-483233
Move from LiG (Liquid in Glass) to modern equipment:
https://stevengoddard.wordpress.com/2015/01/19/hansen-and-mann-hiding-the-other-decline/#comment-483233
Having lived in Tallahassee without air conditioning, I am very gratified to know that when I was sweltering, it was not from being hot, rather it was just my imagination..
All datasets must comply with the dictates of the state.
We can be confident that RSS is being re-educated as we speak and will soon emerge as a morecompliant, smily-faced, progressive servant of the cause.
” Free speech shouldn’t need “defending”. It’s the shut-uppers who should be on the defensive, who should be made to explain why only their side of the argument can be heard. Before Mann launched his suit, I was broadly familiar with the corruption of the scientific process that Climategate et al had revealed. But I was still shocked to discover just how deep it goes. Over the last three years, I’ve had the opportunity to meet with scientists who occupy different positions on the climate spectrum: Some are out-and-out “skeptics”; some broadly agree with the so-called “consensus” but dislike its intolerance; others define themselves as “lukewarmers” or have only relatively modest disagreements with Mann & Co – yet even that cannot be tolerated by the Big Climate enforcers. The fear of retribution and the ever present threat of intimidation in what’s supposed to be a branch of scientific inquiry is amazing – and something of which all reputable scientists should be ashamed.
As I say, free speech doesn’t require “defending”. If your religion – whether Allah or the Climate Gods – is so insecure it can’t tolerate any objections, you’re the one with the problem – and you’re the one who needs to figure out a “defense”. The Big Climate enforcers are more or less open about their willingness to get you fired, blacklisted by scholarly journals, banned from the airwaves, and if necessary investigated by hack congressmen like Raul Grijalva, ranking member of the House UnEnvironmental Activities Committee. In such a climate, the best way to push back is to disseminate the dissent – and ensure that people get a chance to hear alternative views.”
Mark Steyn gets it…so they try to get him…and you…and any of us who question the Lysenko sinkhole of AGW.
Somewhat off topic, but this concerns the Time of Observation corrections (TOBS). I don’t think they are necessary.
Firstly, consider the afternoon recordings of maximum and minimum temperatures. The daily average in this case would be the mean of these two numbers. No adjustment is necessary.
Secondly, consider the observer who records the maximum and minimum in the morning. In this case the minimum value is for the day he makes the recording. The maximum temperature is for the previous day. Thus, all that people need to do is to date this maximum one day earlier. It would be easy to program this. Then the daily mean would be simply the mean of the two numbers after the one day movement. There is absolutely no need to change the actual values of the temperatures using this procedure.
Why don’t they do this?
Mr. Hoyt asks:
“Why don’t they do this?”
Because it would not allow the proper and needed adjustments.
“Proper” according to the infallible CGMs, and “needed” to bring the past into agreement with the CAGW meme, that is.
I personally believe that the people who were minding the store and recording weather information in the past were highly dedicated to being accurate, many of them obsessively so, very conscious of possible errors and of ways to avoid them, on guard for and able to detect any possibly faulty or mis-calibrated instruments, and had only one agenda, which was to perform the tasks at hand to the best of their ability.
In my opinion, it is not only preposterous, but incredibly insulting to the dedication and integrity of those who spent their lives recording weather data in the past.
That the “adjustments” are made on thin logic, are never mentioned by the warmistas when presenting the alarmists conclusions they rant about daily, are/were done not once but several times, and always reinforce the conclusions being presented by those doing the adjusting, is so far beyond galling that I think there are literally no words to adequately describe how outrageous it is.
On this posting about adjustments I noted –
http://wattsupwiththat.com/2015/03/06/can-adjustments-right-a-wrong/
After reading Zeke’s blog post, I could find nowhere the affect made to the monthly data you are posting here. Zeke ‘says’
At first glance, it would seem that the time of observation wouldn’t matter at all. After all, the instrument is recording the minimum and maximum temperatures for a 24-hour period no matter what time of day you reset it. The reason that it matters, however, is that depending on the time of observation you will end up occasionally double counting either high or low days more than you should. For example, say that today is unusually warm, and that the temperature drops, say, 10 degrees F tomorrow. If you observe the temperature at 5 PM and reset the instrument, the temperature at 5:01 PM might be higher than any readings during the next day, but would still end up being counted as the high of the next day. Similarly, if you observe the temperature in the early morning, you end up occasionally double counting low temperatures. If you keep the time of observation constant over time, this won’t make any different to the long-term station trends. If you change the observations times from afternoons to mornings, as occurred in the U.S., you change from occasionally double counting highs to occasionally double counting lows, resulting in a measurable bias.
To show the effect of time of observation on the resulting temperature, I analyzed all the hourly temperatures between 2004 and 2014 in the newly created and pristinely sited U.S. Climate Reference Network (CRN). I looked at all possible different 24 hour periods (midnight to midnight, 1 AM to 1 AM, etc.), and calculated the maximum, minimum, and mean temperatures for all of the 24 hours periods in the CRN data. The results are shown in Figure 4, and are nearly identical to Figure 3 published in Vose et al 2003 (which was used a similar approach on a different hourly dataset).If you keep the time of observation constant over time, this won’t make any different to the long-term station trends. If you change the observations times from afternoons to mornings, as occurred in the U.S., you change from occasionally double counting highs to occasionally double counting lows, resulting in a measurable bias..
If the TOA does not trend in the monthly average, then a single change would not change more than the month in which the time change was made in. His study only looked at the daily temperature changes based on TOA. He never shows how much it would change the monthly average, most likely because it doesn’t.
Never did get a true answer.
Thanks for your post. I think double counting would be rather rare.
I also agree that monthly means wouldn’t be affected much, if at all, since you might only have the first and last days of the month off a bit, and the errors would be rather random.
If the monthly means aren’t affected, then the long-term trends will not be affected either.
I attended a lecture by Katharine Hayhoe last night. She put up a generic temperature chart with no data to illustrate climate variability that looked a lot like RSS. But then she tilted it just like Tony did here to show warming! She used all the standard tricks we’ve become accustomed to. At one point she claimed China is “getting off coal in the next two years.” She pointed to Costa Rica as an example of a country running completely on sustainable energy, but anyone who has been there knows their standard of living is no kind of model. Plus, she misled the audience. Costa Rica has generated all of its electricity without fossil fuels, but mainly because of heavy rain that let its hydroelectric system run on full capacity for 75 days. But the alarmists also claim such heavy rainfall is due to climate change!
I read that Dana Rohrabacher is considering House testimony about official temperature adjustments. I hope you have offered to testify in front of the hearings, and they don’t just accept testimony from the government scientists responsible for the adjustments.
I sent him a document with some links, but heard nothing back.
excellent foresight by Steve. I have long feared the gatekeepers will start adjusting the satellite data. RSS wil surely fall in line, hopefully Spencer and Christy can fight to keep UAH’s integrity. It is pretty funny reading Carl Mears trying to explain how his satellites that measure the entire earth, don’t hold water compared to the surface stations. He must hate Spencer and Christy a lot.
Confirmed RSS tampering predicted by SG years ago linked from WUWT 3/3/2016