
Ted Cruz accurately stated that satellites show no warming for 17 years.
Climate fraudster Tamino smeared him with this graph
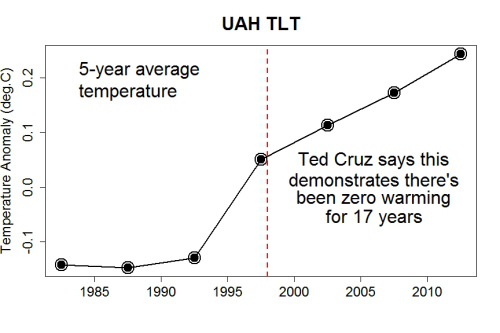
What Tamino did was to use a different data set, extended way past 17 years, and used a five year mean to smear the Mt Pinatubo cooling from the mid-1990’s in with the 1997 temperature. Pure scientific and intellectual malfeasance.
Lies, damned lies, and Tamino statistics. This is typical of how climate criminals operate.

So the left now fears Cruz. Excellent!
Yes; they fear anyone with authenticity and forthrightness, and especially those who challenge their (the CAGW climate scientist’s) presumed role of authority in cli-sci, with the ‘assumed power’ to give orders, make decisions, and enforce obedience in the field of cli-sci.
They especially fear those who might gain traction in the press on this subject and begin to undermine, in the public’s eye, the ‘integrity’ of climastrologists and climastrology; They fear anyone who will not kowtow to their whims, intimidation and gloom/doom pronouncements …
Yes, Excellent! I look forward to more gnashing and grinding of climastrologist (h/t GailC for this term) teeth!
cli fi
Yes they do! Moonbean said it on Meet the press sunday, now they are coming out in droves just like they attacked Palin, can’t wait til they ask Cruz “what kind of magazines do you read”
Put (real) error bars on Tamino’s plot and you still have no measured warming beyond the acuracy of the measurement. Cruz is still right even with Tamino’s bullshit plot.
wrong, cruz claimed zero warming. Error bars fall well outside of no warming.
So Tamino is calling the MET office liars. Snicker
09 Jan 2013 Surprise Surprise… Global warming has stalled, admits Met Office
THE great global warming debate was blown wide open again yesterday when the Met Office predicted cooler than expected temperatures for the next five years.
The Met Office slammed David Rose in 2012 and danced around and around on the issue before finally coughing up the truth.
Truth will out.
The Tamino article still has no comments. I bet it has at least 10 comments awaiting moderation.
I bet most people just ignored him.
I refuse to go to the Moonbat Science Fiction sites and give them any traffic unless absolutely necessary.
Indeed, mine is one of them,
I called him a g*dd*mn coward in one of my comments left AFTER I had left a reasonable comment earlier* asking him to comment on the three items Tony brought up … but no., of course, no comment forthcoming.
It would be too embarrassing and would reveal his ‘base’ intentions behind the simple stats ‘trickery’ that simpler minds accept/swallow (as one can see from the comments that do get through on his site) unquestioningly in tamino’s attempted smear.
You might say tamino provides:
. . . . “Boob-bait stats for the so-called ‘educated-class’ / critical-thinking impaired.“.
* Screen caps captured/kept for the interested.
.
Nice article on Ted Cruz
http://www.breitbart.com/big-government/2015/03/23/cruz-asks-america-to-imagine-in-presidential-campaign-announcement-speech/
Cruz would speak an even greater truth if he stated that there has been no net warming in the US away from cities since at least 1940 and only one period of significant warming since 1940 that lasted less than 20 years, from 1979-1997. The rest of the time, either cooling or neutral.
And cooling in USA ,of 0.5ºC/decade, according to the new “reference” system since it was established in 2005
http://www.hyzercreek.com/SolarIrradianceBMP%5D.gif
You mean that period? It was the sun, stupid.
Don’t worry Morgan, Leif S. is going to ‘adjust’ the solar irradiance and sunspots to conform with Gavin’s temperature data just like Gavin ‘adjusted’ the temperature data to correlate with the Mauna Loa CO2 data that is adjusted by keeling to follow the expected curve.
Gail, not to defend them for rejecting outlier readings, but I think they have a problem with Mauna Loa and any upslope winds which blow volcano effluents from Kilauea, which is normally downwind. Makes you wonder why they use a volcano in the first place or why they don’t just move it to Mauna Kea. Prevailing winds in Hawaii are from the NE.
Morgan,
They have the the ocean full of plankton, forests, a volcano…. and winds going up and down that volcano. The can get any number they darn well please from that site and the other sites are ‘calibrated’ to Mauna Loa.
What is really really interesting is Barrow 1947-1948 data at 420 ppm! (average of 330 samples)
If you go to Barrow there are microbes, and the oceans mucking up the works too.
Temperature dependence of metabolic rates for microbial growth, maintenance, and survival
Here is Becks information from Barrow:
Date – –Co2 ppm * * latitude * * longitude * * *author * * location
1947.7500 – – 407.9 * * *71.00* * * -156.80 * * *Scholander * *Barrow
1947.8334 – – 420.6 * * *71.00* * * -156.80 * * *Scholander * *Barrow
1947.9166 – – 412.1 * * *71.00* * * -156.80 * * *Scholander * *Barrow
1948.0000 – – 385.7 * * *71.00* * * -156.80 * * *Scholander * *Barrow
1948.0834 – – 424.4 * * *71.00* * * -156.80 * * *Scholander * *Barrow
1948.1666 – – 452.3 * * *71.00* * * -156.80 * * *Scholander * *Barrow
1948.2500 – – 448.3 * * *71.00* * * -156.80 * * *Scholander * *Barrow
1948.3334 – – 429.3 * * *71.00* * * -156.80 * * *Scholander * *Barrow
1948.4166 – – 394.3 * * *71.00* * * -156.80 * * *Scholander * *Barrow
1948.5000 – – 386.7 * * *71.00* * * -156.80 * * *Scholander * *Barrow
1948.5834 – – 398.3 * * *71.00* * * -156.80 * * *Scholander * *Barrow
1948.6667 – – 414.5 * * *71.00* * * -156.80 * * *Scholander * *Barrow
1948.9166 – – 500.0 * * * * *71.00* * * -156.80 * * *Scholander * *Barrow
These data must not be used for commercial purposes or gain in any way, you should observe the conventions of academic citation in a version of the following form: [Ernst-Georg Beck, real history of CO2 gas analysis, http://www.biomind.de/realCO2/data.htm ]
Scholander got more than a 100 ppm swing at Barrow over a year’s time.
Morgan,
One of the major ASSumption of CAGW is CO2 is well mixed in the atmosphere and yet the ClimAstrologist have been tossing any and all CO2 data that does not fit their narrative starting with the historic CO2 measurements.
http://www.greenworldtrust.org.uk/Science/Images/ice-HS/Fig-1.gif
I have gone round and round with the slippery weasel Englebeen on the topic at WUWT.
Lucy Skywalker does a good job pulling together all the arguments about the CO2 Ice Hockey Stick
More here:
http://www.greenworldtrust.org.uk/Science/Scientific/CO2-flux.htm
Tamino carefully places in time the 5-year-average dots such that the fourth-last dot straddles the beginning of the up-swing of the 1998 El Nino. This lower that dots value creating more of an upward trend the last 17 years.
I overlaid this graph from Wood For Trees:
https://twitter.com/cbfool/status/580375064442327040
The actual UAH trend shows 0.069C/decade while Tamino’s trend is almost double for last 17 years! He’s a master at these sorts of tricks.
Given that the error is 0.5C minimum for a LiG thermometer, 0.069C ===> ZERO!
On Thermometer resolution, and ERROR
http://pugshoes.blogspot.se/2010/10/metrology.html
(And that is only ONE source of error mentioned in the article)
A.J. Strata also goes through an error analysis
http://strata-sphere.com/blog/index.php/archives/11420
This paper estimating error bands:
http://www.eike-klima-energie.eu/uploads/media/E___E_algorithm_error_07-Limburg.pdf
So ClimAstrologists are just discussing how many Dust Devils dance on the end of a Hokey Stick.
Very sleazy. Tamino can probably also produce a graph indicating that the global warming community hasn’t been scrambling around for several years trying to explain the plateau.
He couldn’t be bothered with RSS for the same period. http://woodfortrees.org/graph/rss/mean:12/plot/rss/from:1998.2/trend
And RSS is the data Steven Goddard and most other people use.
Roy Spencer opined about the divergence of UAH vs RSS some years back.
http://www.drroyspencer.com/2011/07/on-the-divergence-between-the-uah-and-rss-global-temperature-records/
Since 1988 when Hansen and Wirth pulled their trickery on Congress we have seen ten years of warming and close to twenty years of flat to cooling….
So satellites are less accurate? Perhaps Tamino should read what Roy Spencer has to say:
: Thermometers cannot measure global averages — only satellites can. The satellite instruments measure nearly every cubic kilometer – hell, every cubic inch — of the lower atmosphere on a daily basis. You can travel hundreds if not thousands of kilometers without finding a thermometer nearby…………..
Granted, the satellites are less good at sampling right near the poles, but compared to the very sparse data from the thermometer network we are in fat city coverage-wise with the satellite data.
In my opinion, though, a bigger problem than the spotty sampling of the thermometer data is the endless adjustment game applied to the thermometer data. The thermometer network is made up of a patchwork of non-research quality instruments that were never made to monitor long-term temperature changes to tenths or hundredths of a degree, and the huge data voids around the world are either ignored or in-filled with fictitious data.
Furthermore, land-based thermometers are placed where people live, and people build stuff, often replacing cooling vegetation with manmade structures that cause an artificial warming (urban heat island, UHI) effect right around the thermometer. The data adjustment processes in place cannot reliably remove the UHI effect because it can’t be distinguished from real global warming.
https://notalotofpeopleknowthat.wordpress.com/2014/10/22/roy-spencer-satellite-v-surface-temperature-measurements/
I wonder how many means he had to calculate before he came up with the magic number 5?
http://i60.tinypic.com/2zob5g0.jpg
Just to confirm I’m using the same data, here’s the 5yr:
http://i62.tinypic.com/33ometi.jpg
Why do your graphs extend beyond the 17 year period in question?
Also where are the error bars for those temperature readings? Without error bars it is impossible to tell if temperatures are any different or within the range of inaccuracy of the data. Suffice it to say that when people do proper analysis of any of the major temperature datasets the thength of “the pause” is very long and in some cases exceeds the 17 year period correctly stated by Ted Cruz.
You’re missing my point. Tamino couldn’t make his claim of ever increasing temperatures based on graphing the monthly anomalies (because it is flat for 17 years), so I surmise that he started playing with averages until he found one that suited his purposes. That’s the point Tony made in his post. I just showed the process graphically.
It’s a fair point, it does seem that the 5 year average is the “magic number” to make the last 17 years appear to rise in a consistent fashion.
What happens if you shift the 5 year mean so one of the values lands on the 1998 peak. 🙂
In response to one of his denizens’ comments that linear sea level rise is even better proof of AGW, I made a post to correct/ridicule him which also disappeared into the moderation queue never to appear.
Same old krud from Tamino, it’s just repetition and more rehashing of dubious statistics by
bent shillsalarmists – thus, there is no change, just more old lies.On Texan Senator Mr. Ted Cruz, al beeb have already started the negative briefing and God help Cruz, because he has praised Netanyahu and is a realist to boot – oh and he talks a lot of common sense on just about any subject you could care to raise in conversation with him – imho.
I should say at this point, long before 2008 al beeb was swooning about your Kenyan Potus, they think over here in bedwetter universe [UK] he’s so perfect – that Obamao’s shit doesn’t smell.
Ta-who? Seriously, he’s being ignored for his incompetence; you should leave it that way