
The propaganda tag team at work.
NSIDC rushed out this announcement last week, before the ice had a chance to peak.
Arctic sea ice reaches lowest maximum extent on record | Arctic Sea Ice News and Analysis
Everyone who was paying attention knew there was going to be an increase in ice extent over the next week. I have been blogging about this for two weeks. And sure enough it is happening.
So why did NSIDC rush their announcement out? So that the other half of the propaganda tag team could take over.
It is all pre-packaged fraud, but NSIDC threw a little disclaimer into their announcement, so that they can claim it wasn’t their fault.
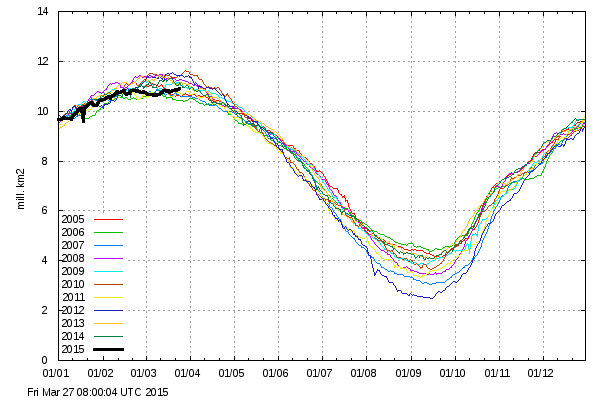
Meanwhile, the Danish Meteorological Institute shows ice extent close to the decadal mean – and rising fast.

The north and south polar regions are the Yin and Yang. Everybody knows Antarctica is a land mass surrounded by a wet oceanic donut. The yin.
But the Arctic is an ocean surrounded by a land mass, the yang.
This past winter in the Arctic we had another polar vortex because the colder area grew in size over the surrounding land while lowered humidity over Arctic Ocean reduced ice there (it didn’t melt, it evaporated from low humidity). But overall global ice increased because a colder Antarctica added a bigger sea ice donut around its land desert.
Think Regress, the same Joe Romm team that announced Great Lakes ice was a thing of the past?
Re-LIE-able source *…
(*Able to LIE again and again and again)
Why do ‘average deniers’ deny all the years for which we have measurements?
https://www.youtube.com/watch?v=hlcuAsgc5-c
It certainly all bottlenecks in May. Am wondering if this year will come in higher than that tightly packed group.
I just saw this line in an unrelated article. “don’t go crazy, but science isn’t a mystical language that only a few elite people can speak”
http://www.independent.co.uk/life-style/gadgets-and-tech/news/night-vision-eyedrops-allow-vision-of-up-to-50m-in-darkness-10138046.html
It’s scary out there. The number of bags of ice at the local WalMart here in Phoenix seems lower than usual today. Soon ice will be a thing of the past.
Maybe this is why all those Yankees are moving to Florida.
As of March 11th, volume was higher than any year since 2009. (I hope the image displays.)
https://14adebb0-a-62cb3a1a-s-sites.googlegroups.com/site/arctischepinguin/home/piomas/grf/piomas-trnd4.png?attachauth=ANoY7coRZbW5mg88unhczymL4BSQGav9-338I1uqRNRW7tiepYmIcOO-JgpVhRrwNZIXPPMPgwfHkJTIR3Ix2dD8XNz1z9zxRSWVZeMf8E3n1UonkGZWDOwG8PMBpLpWma7cB3mO7o6_pLCY0WffXNIWqFfy4P-RJeJkK5SvQzlawfOJUODQm7K1a3Z1pcKuWv-s3g3cdWcFCpoXVaG5low7KXC-Dv8AgrNeKC8yJwnYBYj7QhCWG4zu7UnENkI31kmUPnVaFgqn&attredirects=1
Sorry about that. Here is the page with the link to the appropriate graph, PIOMAS Daily Arctic Ice Volume.
https://sites.google.com/site/arctischepinguin/home/piomas
Not only NSIDC, unfortunately. Earlier this week (22, 23 March?) EarthSky.org’s radio “news” was reporting record low arctic ice with no date reference. I followed the broadcast instructions and entered Arctic sea ice on earthsky.org.
The March 2015 broadcast referred to 2011-2012 record low sea ice.I can check the date; I emailed the local AM station with my complaint.
In addition, a local (Santa Barbara) online news site, Noozhawk.com, published an article with a NOAA quote that the myth that CO2 enhances plant growth has been debunked.
Cryosphere interactive arctic sea ice website. Data from 1979. Great for comparison of historical to recent arctic sea ice.
http://igloo.atmos.uiuc.edu/cgi-bin/test/print.sh
I found this link on http://appinsys.com/GlobalWarming/RS_ArcticIce_2007.htm. Appinsys.com also has photos of US submarines surfaced at the nearly ice-free north pole in 1959 and 1987.
http://appinsys.com/GlobalWarming/RS_Arctic.htm http://www.navsource.org/archives/08/0857806.jpg
This is probably redundant with other posts, but I haven’t seen it. Many thanks to appinsys owner Alan Cheetham for his encyclopedic website.
This subtitled Italian video on chemtrails claims geoengineering is intentionally used to prevent cloud formation to reduce microwave attenuation caused by H2O absorption.
https://www.youtube.com/watch?t=86&v=U-5VnMIiKPY
O/T,but in four hours I will be turning all my lights and electrical items on to celebrate “Human Achievement Day” 8:30 to 9:30 NZ time. Appreciating how fossil fuels have made our lives safer and more comfortable. How we can travel to visit our relations and friends in almost any country on the planet,or even take a cruise on a ship around the islands. How we have helicopters for rescue missions. Well,you know the rest.
I think I asked before.. but does anyone know the margin of error on these values?
Is there any significant difference between any of them at this time of year.
After all, the Arctic is bounded by land for a lot of it perimeter.
“Standard deviation +/- 2 ” According to the graph
If you get presented with any statistic, particularly when represented as a percentage, consider it to be inaccurate unless the person presenting it provides the measure for standard deviation.
http://en.wikipedia.org/wiki/Standard_deviation
Generally, the smaller the SD is as a proportion of the presented value then the more confident you can be that the graph represents a good match to the data it represents
That covers data when it is presented (never assume what you are seeing is the presentation of actual data without processing, seek instead the figure for standard deviation)……so that just leaves the data itself.
Data is going to be subject to variance. Instrument variance (temperature, pressure, light might all affect the readings), then there is operator variance (parallax error for example), recording errors (finger trouble on a keypad). and also environmental error (the time of day might be an important factor – are all readings made consistently at the same time of day, or in the same magnetic field, or at the same altitude ?)
Formula can be constructed and applied which can detect obvious errors (decimal point in the wrong place) , but minor errors are more difficult to detect and ignore. All things being equal, unless somebody decided to deliberately manipulate the data then it can be assumed that with a large enough data set all the errors will cancel out….but then again things are rarely that simple !
One of my (our) biggest gripes about all the ‘data’ and the data ‘adjustments’ to the temperature record is ERROR.
Meteorology: A Text-book on the Weather, the Causes of Its Changes, and Weather Forecasting 1918 by Willis Isbister Milham
states:
On page 68 he says a thermometer in a Stevenson screen is correct to within a half degree. Two thermometers are used an Alcohol for Minimum and a Mercury for Maximum supplied with a manual in 1882 to the coop stations by the US Weather Bureau. Milham mentions the Six thermometer and says the accuracy was not good so the US weather service used the two thermometers mentioned above. Note an error is introduced causing a lower reading than actual if the Maximum is not read in the afternoon/evening or if the day is calm and the mercury thread does not break.
This is the exact opposite of the claims of Zeke Hausfeather, when he uses TOBS (time of observation) for an excuse to decrease the temperatures before 1960 thereby INCREASING the error.
Milham also states there are 180 to 200 ‘regular weather stations’ ordinarily in the larger cities that take reading twice daily and a continuous reading with the Richard Freres thermograph. There were also 3600 to 4000 coop stations and 300 to 500 special stations that recorded other aspects of the weather.
If the error is at least +/- 0.5°F in the older reading no amount of diddling with those reading will make that error go away. All the diddling does is INCREASE the actual error.
The data should be represented it the same manner that Ernest beck shows the data from the chemical analysis of CO2 in air. (The gray is the error bars)
CO2 from 1880 to present
http://www.biomind.de/realCO2/bilder/CO2back1826-1960eorevk.jpg
Zeke also mentions the shift from LiG (liquid in glass) to MMTS in the 1980s and ” a very obvious cooling bias in the record associated with the conversion of most co-op stations from LiG to MMTS in the 1980s…”
Notice this is NOT determining whether or not there IS A BIAS based on scientific observational data but a ‘bias’ based on what you WANT the data to show!
So what does the observational data tell us?
So that ‘adjustment’ just like the TOBS adjustment is also in the WRONG direction giving up to a 1.5°C warming bias to the 1880 to present temperature trend! The TOBS excuse is used to cool the past data prior to 1960 and the LiG to MMTS switch in the 1980s is used to warm the data after the 1980s.
That does not get into ignoring the Urban Heat Island effect or the Station dropout that scrubbed rural stations from the data set used after 1990.
This is for Canada. It is the RATE OF CHANGE = dT vs station number.
https://diggingintheclay.files.wordpress.com/2010/04/canadadt.png
When you add in the station dropout, Krigging (smearing urban data over 1200km) and the urban heat island effect that is ignored, you could have a mile high glacier sitting on Chicago and still show the climate is warming. Tom Nelson looked at 1997 vs 2014. It shows NOAA lowering past global temperature by more than 4F since 1997!
http://tomnelson.blogspot.com/2015/02/noaa-settled-science-earth-at-5824f-in.html
Roy Spencer on urban heat island effect:
Global Urban Heat Island Effect Study: An Update
http://www.drroyspencer.com/wp-content/uploads/ISH-UHI-warming-global-by-year.jpg
Las Vegas: Poster Child for the Urban Heat Island Effect
“… The USHCN plot provided by Anthony shows 10 deg. F (!) of nighttime warming since the late 1930s, which is simply not a credible representation of the non-urban environment….”
CHINESE STUDIES:
New paper: UHI, alive and well in China
WRF simulations of urban heat island under hot-weather synoptic conditions: The case study of Hangzhou City, China
Surface urban heat island in China’s 32 major cities: Spatial patterns and drivers
Speaking of implausible deniability…
WASHINGTON — An examination of the server that housed the personal email account that Hillary Rodham Clinton used exclusively when she was secretary of state showed that there are no copies of any emails she sent during her time in office, her lawyer told a congressional committee on Friday.
After her representatives determined which emails were government-related and which were private, a setting on the account was changed to retain only emails sent in the previous 60 days, her lawyer, David Kendall, said. He said the setting was altered after she gave the records to the government.
“Thus, there are no [email protected] emails from Secretary Clinton’s tenure as secretary of state on the server for any review, even if such review were appropriate or legally authorized,” Mr. Kendall said in a letter to the House select committee investigating the 2012 attacks in Benghazi, Libya.
Nothing to see here, Progress along…
Exactly the kind of nothing to see here that I expected…
1. Destruction of government property
2. Tampering with evidence
3. Contempt of Congress.
Bingo.
Not only NSIDC, unfortunately. Earlier this week (22, 23 March?) EarthSky.org’s radio “news” was reporting record low arctic ice with no date reference. I followed the broadcast instructions and entered Arctic sea ice on earthsky.org.
The March 2015 broadcast referred to 2011-2012 record low sea ice.I can check the date; I emailed the local AM station with my complaint.
In addition, a local (Santa Barbara) online news site, Noozhawk.com, published an article with a NOAA quote that the myth that CO2 enhances plant growth has been debunked.
Cryosphere interactive arctic sea ice website. Data from 1979. Great for comparison of historical to recent arctic sea ice.
http://igloo.atmos.uiuc.edu/cgi-bin/test/print.sh
I found this link on http://appinsys.com/GlobalWarming/RS_ArcticIce_2007.htm. Appinsys.com also has photos of US submarines surfaced at the nearly ice-free north pole in 1959 and 1987.
http://appinsys.com/GlobalWarming/RS_Arctic.htm http://www.navsource.org/archives/08/0857806.jpg
This is probably redundant with other posts, but I haven’t seen it. Many thanks to appinsys owner Alan Cheetham for his encyclopedic website.
This subtitled Italian video on chemtrails claims geoengineering is intentionally used to prevent cloud formation to reduce microwave attenuation caused by H2O absorption.
https://www.youtube.com/watch?t=86&v=U-5VnMIiKPY
Must be huge amounts of money in alarming. (sigh)
http://www.scientificamerican.com/article/antarctica-s-ice-shelves-thin-threaten-significant-sea-level-rise/?WT.mc_id=SA_Facebook
I thought that it was shameless about an excuse of NSIDC.
? However, a late season surge in ice growth is still possible. ?
http://nsidc.org/arcticseaicenews/2015/03/2015-maximum-lowest-on-record/
Such an explanation is omitted in Japan.
Probably the increase of the ice is not reported in Japan.
When ice of the summer increased rapidly in 2013, it was not reported either.
Japanese main media didn’t also write a corrected article about a record in 2014.
However, I can distinguish a fact as you show a fact.
Therefore naturally I can judge that data of the Danish Meteorological Institute are reliable.
I always thank you.
?data which were placed in the announcement about the maximum area of NSIDC
http://nsidc.org/arcticseaicenews/files/2015/03/Figure23.png
?3/26 NSIDC’s data
http://nsidc.org/data/seaice_index/images/daily_images/N_stddev_timeseries.png
?the Danish Meteorological Institute’s data
http://ocean.dmi.dk/arctic/old_icecover.uk.php
With forecasts indicate that in early April it gets very cold in Central and Eastern Europe.
http://www.cpc.noaa.gov/products/stratosphere/strat_a_f/gif_files/gfs_z100_nh_f168.gif
https://www.youtube.com/watch?v=1aLCWwLdelo#t=62
[Off Topic]
Is NOAA deleting inconvenient history?
I had this page bookmarked:
https://web.archive.org/web/20140216095958/http://www.ncdc.noaa.gov/oa/climate/globalextremes.html
It used to show global temperature/precipitation extremes, and highlighted that there had been no new contenental records for either metric for 30 years (and that was a cold record in Antarctica). But now that page cannot be found even by the wayback machine as they’ve introduced a “robots.txt” file into NOAA’s webpage, which reads (in part):
Disallow: /temp-and-precip/*.php?
Disallow: /temp-and-precip/alaska/*/
Disallow: /temp-and-precip/climatological-rankings/?
Disallow: /temp-and-precip/climatological-rankings/download.xml
Disallow: /temp-and-precip/drought/nadm/nadm-maps.php/?
Disallow: /temp-and-precip/global-temps/*/
Disallow: /temp-and-precip/msu/*/
Disallow: /temp-and-precip/national-temperature-index/*?
Disallow: /temp-and-precip/time-series/?
Disallow: /temp-and-precip/us-weekly/
… my suspicion is that they’ve done this to hide inconvenient older data. Luckily the WMO seems to have the same [?] data, which I’ve web-cited here: http://www.webcitation.org/6XMddowI5
If there’s a concerted Orwelian effort to “re-educate the old data” then if you have any older data from any of the climate groups: Back it up. Download the whole page (on Firefox Ctrl-S) . Screenshot it. Archive it (webcitation.org, not archive.org).
Before it’s too late.
Now that is interesting. Another brick in the wall, if you will.
What possible explanation could they possibly have for this type of action?
I got this notice last week on a NOAA historical data site,
http://data.nssl.noaa.gov/ displays “The Historical Data Archive has been retired”; forwarded to Dr. Roy Spencer.
The corruption is very transparent, but it’s immaterial, I think. The AGW-scam has been promoted using the most sophisticated warmongering RIIA/ Tavistock/ Aspen Institute perception manipulation (mind control, brainwashing) techniques. People retain their false original beliefs rather than replacing them with subsequent correct information, and they misinterpret additional new information that contradicts these beliefs as confirmation of them. Repetition of false information is emotionally processed as fact.
The only disincentives to publishing fraudulent information and alteration of data that I can think of are 1) fear of loss of professional status by exposing oneself as a fraud, and 2) moral and ethical constraints. The psychopathic organizational structure of the AGW-scam invalidates both of these; the “stupid cattle” they’re controlling with disinformation are only objects used to achieve goals; their opinions are irrelevant, and 2) is therefore an oxymoron.
There’s no downside in continuing the attempt to fool all of the people all of the time, and an incentive to continue the dissemination of false information that’s rapidly discredited; the original lie will be retained.
““The data doesn’t matter. We’re not basing our recommendations on the data. We’re basing them on the climate models.”
– Prof. Chris Folland,
Hadley Centre for Climate Prediction and Research
“The models are convenient fictions that provide something very useful.”
– Dr David Frame,
climate modeler, Oxford University
“It doesn’t matter what is true, it only matters what people believe is true.”
– Paul Watson,
co-founder of Greenpeace
The only option I see is employing similar marketing techniques to sell the truth.
They made good use of the word “appeared”