No Change Equals Change

In the mind of climate alarmists, the same weather as 1934 proves the climate is changing.

ScreenHunter_21 Mar. 07 16.58

More Cold and Snow Thanks to Global Warming » CounterPunch: Tells the Facts, Names the Name

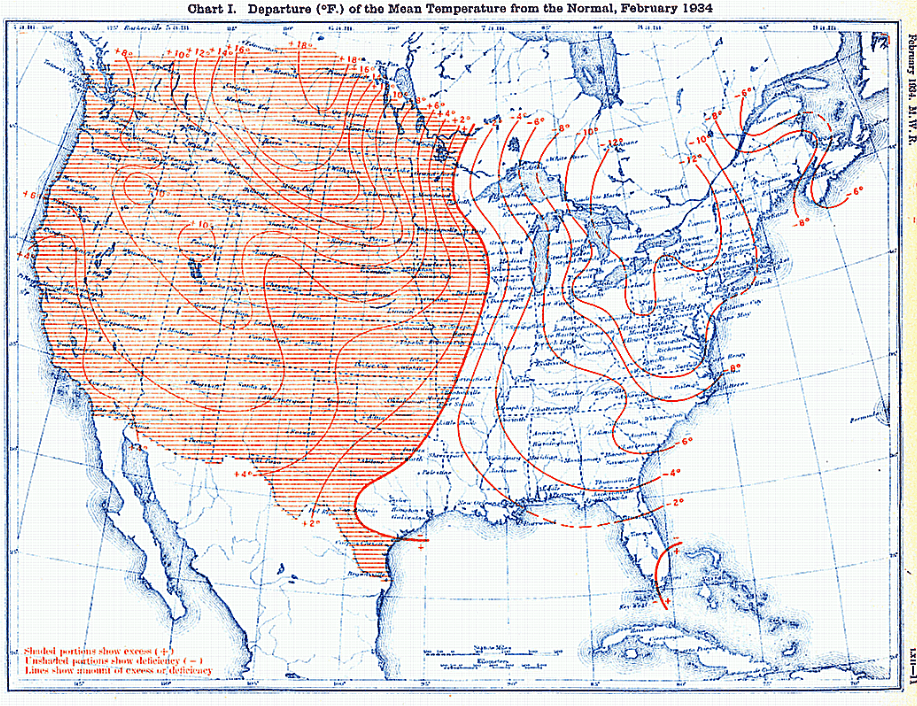
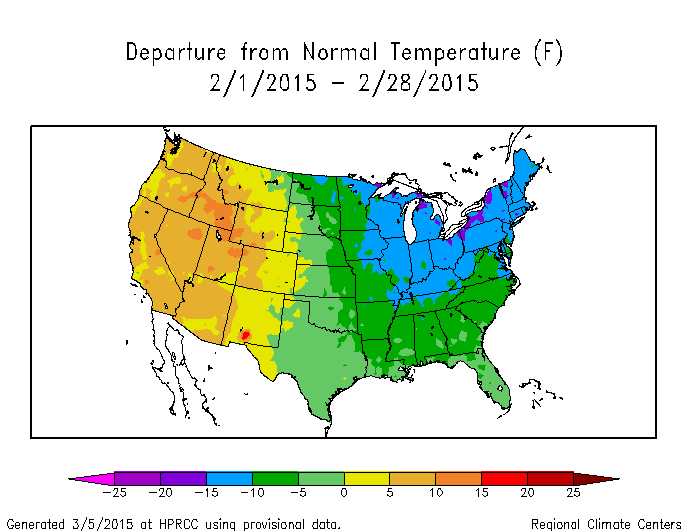
February 1934 was almost a carbon copy of February 2015

ScreenHunter_7312 Feb. 19 08.06

Last1mTDeptUS

Current Climate Summary Maps – Powered by ACIS – High Plains Regional Climate Center

About Tony Heller

Just having fun
This entry was posted in Uncategorized. Bookmark the permalink.

10 Responses to No Change Equals Change

  1. Hugh K says:

    That would certainly explain the necessity to substitute climate ‘disruption’ for climate ‘change’.

  2. omanuel says:

    Thanks, Steven. Is there a solar cycle of ~181 years (2015-1934 = 81 yr)?

    • omanuel says:

      Correction: Is there a solar cycle of ~81 years (2015-1934 = 81 yr)?

      Here’s a report on the ~80-year solar cycle: http://virtualacademia.com/pdf/cli267_293.pdf

      • Gail Combs says:

        Yes there is the ~88 year The Gleissberg cycle. Joan Feynman et al found the cycle in the Nile River records. Is solar variability reflected in the Nile River?

        ABSTRACT
        We investigate the possibility that solar variability influences North African climate by using annual records of the water level of the Nile collected in 622–1470 A.D. The time series of these records are nonstationary, in that the amplitudes and frequencies of the quasi-periodic variations are time-dependent. We apply the Empirical Mode Decomposition technique especially designed to deal with such time series. We identify two characteristic timescales in the records that may be linked to solar variability: a period of about 88 years and one exceeding 200 years. We show that these timescales are present in the number of auroras reported per decade in the Northern Hemisphere at the same time. The 11-year cycle is seen in the Nile’s high-water level variations, but it is damped in the low-water anomalies. We suggest a possible physical link between solar variability and the low-frequency variations of the Nile water level. This link involves the influence of solar variability on the atmospheric Northern Annual Mode and on its North Atlantic Ocean and Indian Ocean patterns that affect the rainfall over the sources of the Nile in eastern equatorial Africa.

        Signature of Hale and Gleissberg solar cycles in the geomagnetic activity

        ABSTRACT
        The aa index, designed to describe the geomagnetic activity at global scale, has been shown to have increased in the twentieth century by about 65%. The increase in the case of a corrected aa is about 38%, similar to the ones of the recently introduced interhour variability (IHV) and interdiurnal variability (IDV) indices of geomagnetic activity. In terms of 11-year running averages, there is a long-term similarity between aa, R (the sunspot number), x, y, z, and r (geomagnetic indices designed to characterize the solar quiet daily variation, controlled by the solar UV radiation), and S (the solar irradiance). We show that the variation depicted by 11-year running averages of aa and R (and by consequence also of the other parameters mentioned) results from the superposition of Hale and Gleissberg cycle signatures in the corresponding time series. The IHV and IDV indices are included in the analysis. The two signals have a substantial contribution in R (10–30% and 20–34%, respectively, of the amplitude of the solar cycle 22) and aa (<12–27% and $30%, respectively, of the corresponding cycle 22 in aa). Characteristics of the two signals in the solar and geomagnetic activity and several implications of the geomagnetic activity and the solar quiet daily variation relationship with various solar outputs at the Hale and Gleissberg timescales are discussed.

        Strong evidence for the influence of solar cycles on a Late Miocene lake system revealed by biotic and abiotic proxies

        a b s t r a c t
        The Late Miocene paleogeography of central Europe and its climatic history are well studied with a resolution of c. 106 years. Small-scale climatic variations are yet unresolved. Observing past climatic change of short periods, however, would encourage the understanding of the modern climatic system. Therefore, past climate archives require a resolution on a decadal to millennial scale. To detect such a short-term evolution, a continuous 6-m-core of the Paleo-Lake Pannon was analyzed in 1-cm-sample distance to provide information as precise and regular as possible. Measurements of the natural gamma radiation and magnetic susceptibility combined with the total abundance of ostracod shells were used as proxies to estimate millennial- to centennial scale environmental changes during the mid-Tortonian warm period. Patterns emerged, but no indisputable age model can be provided for the core, due to the lack of paleomagnetic reversals and the lack of minerals suitable for absolute dating. Therefore, herein we propose another method to determine a hypothetic time frame for these deposits.

        Based on statistical processes, including Lomb–Scargle and REDFIT periodograms along with Wavelet spectra, several distinct cyclicities could be detected. Calculations considering established off-shore sedimentation rates of the Tortonian Vienna Basin revealed patterns resembling Holocene solar-cycle-records well. The comparison of filtered data of Miocene and Holocene records displays highly similar patterns and comparable modulations. A best-fit adjustment of sedimentation rate results in signals which fit to the lower and upper Gleissberg cycle, the de Vries cycle, the unnamed 500-year- and 1000-year-cycles, as well as the Hallstatt cycle. Each of these cycles has a distinct and unique expression in the investigated environmental proxies, reflecting a complex forcing-system. Hence, a single-proxy-analysis, as often performed on Holocene records, should be considered cautiously as it might fail to capture the full range of solar cycles.

        The Sun, the oceans and the configuration of the continents are the major rulers of our climate. NOx and O2/O3 are also influential. CO2 is a bit player if that.

  3. DavidS says:

    Another article that cannot get the simple things straight. It was not the coldest month in Toronto’s weather records. It was the 5th coldest.

  4. gator69 says:

    Everything proves CAGW.

  5. gofer says:

    Of course, if it had been mild, then that would be global warming. You cannot win when global warming causes everything. It takes real dedication to be this stupid, phd in stupidity, since there is no global warming. Watch for a global warming induced cool summer.

    • Jason Calley says:

      Do you remember a science fiction movie titled “The Thing”? The monster can take the shape of a dog or a human or, uh, well… just about ANYTHING! http://www.imdb.com/title/tt0084787/

      That’s Global Warming! Hot? It’s Global Warming! Drought? Yup, Global Warming! Cold? Rainy? Changeable? You bet! Global Warming, Global Warming, Global Warming! And you know what? It’s gona GET ‘CHA!

  6. etudiant says:

    The more interesting aspect of the 1934 analog is that the subsequent summers, especially 1936, were the hottest in US experience. Just imagine the reaction if 2016-2017 have super hot summers.
    CAGW will be seen as proven beyond any doubt.

  7. sfx2020 says:

    Everthing proves global warming

Leave a Reply

Your email address will not be published. Required fields are marked *