
Experts say that Antarctic melt has doubled over the past five years.

The water must be hiding at the bottom of the sea, because sea level rise rates were faster prior to 2008
One thing $29 billion peer-reviewed climate science never does is double check their propaganda. There is too much money at stake to tell the truth.

I guess we know where all the heat went!
It is clever using Antarctica. I mean who lives there except climate scientists and penguins? And the penguins ain’t talkin’.
And the scientists say don’t believe a word that penguin says.
Good thing that global warming “scientists” are stupid or else they’d travel to South Africa and tell the world what they found in Antarctica.
http://www.simonstown.com/tourism/penguins/penguins.htm
http://video.search.yahoo.com/video/play;_ylt=A0LEVrfBXf5UF2sALEwPxQt.;_ylu=X3oDMTB0N25ndmVnBHNlYwNzYwRjb2xvA2JmMQR2dGlkA1lIUzAwNF8x?p=south+african+penguin&tnr=21&vid=ECC92A948A2D135120C8ECC92A948A2D135120C8&l=102&turl=http%3A%2F%2Fts1.mm.bing.net%2Fth%3Fid%3DUN.608018707903938980%26pid%3D15.1&sigi=11rm9vnju&rurl=https%3A%2F%2Fwww.youtube.com%2Fwatch%3Fv%3DHvt2EyOaSG0&sigr=11bk5n4o3&tt=b&tit=South+African+Penguins+at+Boulders+Beach&sigt=118idh3bd&back=http%3A%2F%2Fus.yhs4.search.yahoo.com%2Fyhs%2Fsearch%3Fp%3Dsouth%2Bafrican%2Bpenquin%26type%3Dtpl_tight1_15_05%26param1%3D1%26param2%3Dcd%253D2XzuyEtN2Y1L1QzutDtDtC0CtBtAtD0EyBtB0E0AzztC0EyEtN0D0Tzu0StCtCtByEtN1L2XzutAtFyBtFtBtFtDtN1L1CzutN1L1G1B1V1N2Y1L1Qzu2SyEzy0A0C0EyC0FtDtG0ByCtDtCtG0A0AzzyBtG0CtBtByEtGyDyC0AtA0ByB0EyCtB0EzztA2QtN1M1F1B2Z1V1N2Y1L1Qzu2Szz0E0DyB0AyEyE0CtGyEtAzytDtGyE0D0E0AtG0BtDzy0EtGyE0D0ByB0FtByDtDyBzztBtB2Q%2526cr%253D703634915%2526ir%253D%2526elng%253Den%2526elcl%253Dus%2526a%253Dtpl_tight1_15_05%2526f%253D4%2526cat%253Dweb%2526ulng%253Den-US%25252Cen%25253Bq%25253D0.5%2526sid%253Dcb58b8507a3406918855b168d78cd326%2526stype%253Dtpl_tight1_15_05%2526sesid%253D31e6d30c933b115512200a7450a8eb41%2526csr%253D0%2526ipblock%253D0%2526b%253DIE%2526bv%253D11.0%2526os%253DWindows%252B8.1%2526cc%253Dus%2526ip%253D50.160.77.143%2526pa%253Dtaplika%26hsimp%3Dyhs-fullyhosted_003%26hspart%3Diry%26ei%3DUTF-8&sigb=1ot7tab1i&hspart=iry&hsimp=yhs-fullyhosted_003
Look at all the green stuff with penguins!
Oh, yes, they are …
http://www.youtube.com/watch?v=fy3vWBtXwO0
Penguins of Madagascar was really really bad. I expected something cute like that “Minions” flick, but it was just mindless. We walked out after about a half hour.
That’s depressing. I was counting on them to tell the truth.
Did they go for NYT approval instead? Did Skipper get full of himself like Muller and said he was never a skeptic? Did Rico, Kowalski and Private go along with it?
You are wrong.
The water is hiding all over north america disguised as global warming snow that is covering your country right now.
The truth and evidence is such a nuisance to these alarmists!
http://www.naturalnews.com/048915_FDA_science_fraud_false_information.html just nornal science to make things up
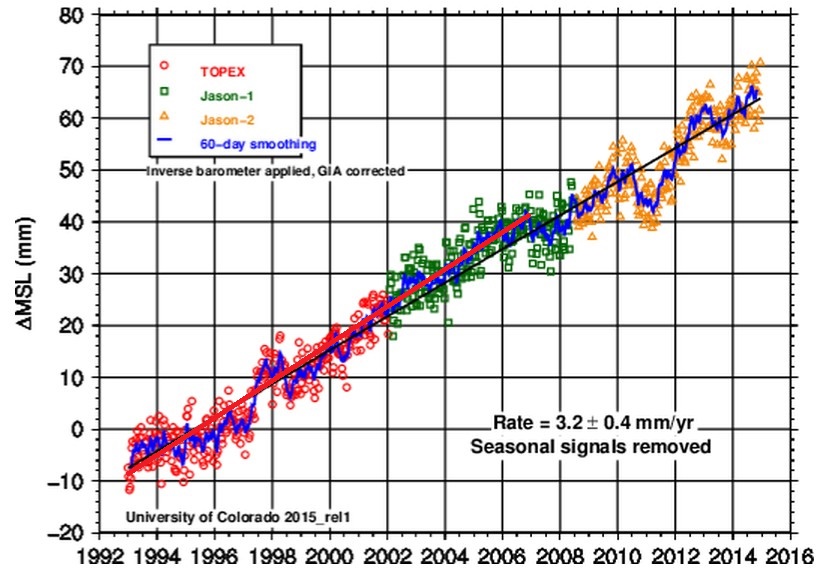
Speaking of Colorado University’ Sea Level Research Group
If you go to the Internet Archive’s WayBack Machine:
http://archive.org/web/web.php
and plug in the URL for Colorado Universty’s Sea Level Research Group
http://sealevel.colorado.edu/
You will find records that go back to 2004 The earliest functional “mean sea level time series” link is from March 27th of that year, and if you follow that link through to “Inverted Barometer Applied” and “Seasonal Signals Removed” and click on text
http://web.archive.org/web/20040413231515/http://sealevel.colorado.edu/2004_rel1.2/sl_ib_ns_cu2004_rel1.2_global.txt
you will find the data as it existed for 1992.928 thru 2003.842 It’s then rather simple to download the series into Excel and find the slope. It comes out to be 2.6 mm/yr If you then go to Colorado University’s Sea Level Research Unit today and dowload the “Raw data (ASCII)”
http://sealevel.colorado.edu/files/2013_rel4/sl_ns_global.txt
You will find that the same series for 1992.96 through 2003.846 comes out to be 3.5 mm/yr. Somehow over the last ten years the data has been changed. What had been 2.6 mm/yr in 2003 is now 3.5 mm/yr. An increase of 0.9 mm/yr.
Looks like this:
http://oi59.tinypic.com/24e8482.jpg
If you ask Colorado University about these changes they say:
–
“The sea level time series release from 2004 is over eight years old, and in that time many parts of the TOPEX and Jason-1 processing have been updated to reflect instrument and ancillary data improvements. Without recreating each processing change over the last eight years, We cannot point to any specific update that is the main cause of the differences between the 2004 and the current release. But a partial list of the more influential updates include:
– updated orbits
– updated radiometer corrections
– updated tide models
– updated sea state bias models
– updated dynamic atmosphere
“A review of the release notes shows how we continually apply what the altimeter science community considers to be the most up-to-date set of processing parameters.”
Well done Steve. My BS detector went high alert reading the reply you got from Colorado University.
Why do all climate charts have no error bars? Is that division except from normal science protocols?
There are no error bars in religion.
The prophet forbids alcohol and since they willingly embrace the “peaceful” religion’s tenets as well as their own “science”… no bars.
All data improvements make things hotter today and colder yesterday and oceans higher today and lower yesterday.
Simple dynamic to get computers to do this, of course.
I also recall a very flat period around 2006. Then they wet off line and missed several updates. When they came back, the flat spot was gone. Is it possible to find an earlier version of the 205 through 2007 period?
I’ve thought about an FOI request. I would like to think that there is someone out there who has saved them
At an inch per decade, there should be a very visible sea level rise evident around the world, as there are many sites and structures that are centuries old.
Yet the mean sea level mark chiseled into the rock on the Isle of the Dead in 1841 by Capt. Ross, of Ross Ice Shelf fame is at least three feet above the current sea level.
See: http://www.john-daly.com/
Tasmania is not volcanic afaik and there were never any glaciers in the area, so no post glacial rebound.
What gives? Where is the missing sea level rise?
How do we get a sea level of earth in mm? Seriously?
Artificial accuracy.
Faith.
Cartoons?
Really REALLY low altitude satellites?
Reblogged this on Climatism and commented:
No acceleration of the ‘rate’ of sea level rise since 1850 either…
Also no pause in warming of the seas…
Ocean Data:
– ARGO buoys show *no* 0-700mtr warming since 2004: http://www.abc.net.au/unleashed/28636.html
– NASA can’t find any ‘deep’ ocean warming:
“NASA Study Finds Earth’s Ocean Abyss Has Not Warmed”
http://www.nasa.gov/press/2014/october/nasa-study-finds-earth-s-ocean-abyss-has-not-warmed/#.VQHBJ4GUeNz
…because the ‘experts’ don’t even have the instruments to measure the ‘hiding/missing’ global warming:
”The heat is still coming in, but it appears to have gone into the deep ocean and, frustratingly, we do not have the instruments to measure there,”
http://blogs.news.com.au/heraldsun/andrewbolt/index.php/heraldsun/comments/sure_the_warming_is_there_if_only_they_could_find_it/
The climate ‘experts’ have absolutely no idea why the oceans aren’t warming, nor why the atmosphere hasn’t warmed, at all, over the past 18 years, despite RECORD evil human carbon dioxide output.
#SettledScience
If Antarctica is contributing to sea level rise, then it must have been this way for centuries because sea level rise since 1850 is as linear as a bowling alley.
Why don’t you just ask Hope why sea level isn’t rising as predicted? She would have an answer that would scare all of us. Not on the data, but how naïve and ill informed she is.
Google’s CEO is out there off West Australia, searching for it right now! http://pindanpost.com/2015/03/02/searching-for-the-hidden-heat/
“These species are highly sensitive to ocean acidification, such as from the carbon dioxide channeled down into deep oceans [via the canyon],” he says.
I’m trying to follow the illogic. More CO2 means more warming, which means more outgassing of CO2, and ocean acidification, Rinse and repeat.
Fresh water is “acidic” as determined by the PH scale 😉
In other words, the psychotic warmers do not understand sheet about climate, ocean content or anything geo-physical…
Ocean water is alkaline, and cannot become acidic. They are liars and frauds.
The term ocean ‘acidification’ is BS. All the carbon dioxide in the world cannot make the ocean acidic. Slightly less alkaline, but never acidic.
There’s enough research to show it’s BS and extra CO2 in the oceans, or in the atmosphere, is beneficial.
“Watch: MIT’s Dr. Richard Lindzen on Fox News: ‘The whole thing is fairly absurd’ – ‘We are demonizing a chemical — a molecule essential to life – CO2?. ” Dr Lindzen.
Been a longtime fan if Dr Lindzen, and already watched the video.
And yes, oceans are alkaline and cannot acidify.
It wont stop the scary monster stories by the warmists though. Doesn’t fit the agenda.
I call BS on this as the Antarctic ice sheet was gaining mass overall at a rate of 49gt/yr up ’till then
http://ntrs.nasa.gov/search.jsp?R=20120013495
and The Antarctic has cooled since then
ftp://ftp.ssmi.com/msu/graphics/tlt/plots/rss_ts_channel_tlt_southern%20polar_land_and_sea_v03_3.png
2014 winter also broke cold records at many of the long term bases there
It’s possible, I mean double could be from 1 ounce to 2 ounces
Yup, the missing heat and catastrophic sea level rise are both hiding in the deep ocean until anthropogenic CO2 emissions end their CAGW denial.
How about this hare-brained flakey notion: heat causes things to expand. Planet Earth is actually expanding because of all that “hidden” heat caused by using fossil fuels. When the carbon dioxide level dips, the backlash will cause the oceans to cover the planet–so repent, sinners!
I had better keep my day job. The forgoing wasn’t mindless enough. Ted Turner and Al Gore ain’t about to cut me a check for this drivel!
Tony, you are usually spot on, but in this case you whiffed. They predicted that the rise of the oceans would begin to slow in ~2008/2009.
https://www.youtube.com/watch?v=u2pZSvq9bto
No, Mr Cnut thought he could control sea level rise. BS !!
EMPTY rhetoric, that’s all he ever had.
The planet has become far more TOXIC, politically, while Obummer has been there..
And he is the major cause.
97% women harassed UN http://quadrant.org.au/opinion/doomed-planet/2015/02/pachauri-groped-97-women/
Oceans erode land masses. It seems logical that most of that eroded land ends up at the bottom of the Oceans which should cause some slight overall rise of ocean level.
Too bad that the sea-level curve shows that the fabled “global warming pause” is pure BS. At least warming of the seas and the mass-loss of land-ice has been going on unabated since 1998.
Like everything else touched by the ClimAstrologists. Sea leve has been spindled and mutilated.
The chart from WIKI is shown by everyone even Steve:
http://upload.wikimedia.org/wikipedia/commons/1/1d/Post-Glacial_Sea_Level.png
NOTE: The data is not raw data but adjusted data.
Notice the seal level does nothing but rise. However the actual science shows a different story.
TEN STUDIES PROVING SEA LEVEL IS NOT RISING AFTER HOLOCENE OPTIMUM
STUDY #1
Mid to late Holocene sea-level reconstruction of Southeast Vietnam using beachrock and beach-ridge deposits
Translation the sea level was up to 1.5 meters higher than today in a tectonically stable area ~5000 years ago to 2000 years ago.
STUDY #2
Sea-level highstand recorded in Holocene shoreline deposits on Oahu, Hawaii
This study shows a sea level highstand ~1.6 meter above the present level from ~5500 years ago to 2000 years ago.
STUDY #3
Late Quaternary highstand deposits of the southern Arabian Gulf: a record of sea-level and climate change
This study shows a sea level highstand ~1 to 2 meters above the present level about ~5500 years ago.
STUDY #4
The Quaternary Geological History of the Santa Catarina Southeastern Region (Brazil) 1999
The first part discusses drilling in several locations and analyzing samples. They mention dating prior to that was guesses. “…. A drilling campaign done in the domain permitted the sampling of material for 14C datings, and the obtained data confirmed some previously assumed ages. The sequence of events, that originated the Holocene deposits, has been also reconstructed through drilling and 14C dating of the collected peat and shell samples…”
In the body of the text is this:
This study shows a sea level highstand ~ 4 meters above the present level about ~5000 years ago. With sea level oscillating since then. Not only has the sea levels have dropped since the Holocene Optimum the evidence shows that “warmer paleotemperatures were favourable for great proliferation of mollusks in the area”
Santa Catarina brazil is at latitude 27.2500°S.
STUDY #5
Holocene sea-level change and ice-sheet history in the Vestfold Hills, East Antarctica
The above is a RELATIVE sea level. The area is not tectonically stable because the area has isostatic uplift in response to deglaciation from the Wisconsin Ice Age. The same applies to the following study.
STUDY #6
A new Holocene relative sea level curve for the South Shetland Islands, Antarctica
nora(DOT)nerc.ac.uk/15786/
VALIDATION BY ALTERNATE STUDIES
STUDY #7
Ice free Arctic Ocean, an Early Holocene analogue
STUDY #8
Temperature and precipitation history of the Arctic
STUDY #9
A new approach for reconstructing glacier variability based on lake sediments recording input from more than one glacier January 2012
A THIRD METHOD OF VALIDATION
STUDY #10
Sea Level Changes Past Records and Future Expectations
Dig, and you find every single talking point of the ClimAstrologists is based on very questionable ‘Adjustments’
Everybody knows that solids are denser than liquids, because solids are colder than liquids. That’s how the heat is hiding at the bottom of the ocean: it’s solid! Science™!