
We saw this Bald Eagle while canoeing this evening. The local wind farm operators are no doubt upset that one got away from them.
[youtube=https://www.youtube.com/watch?v=BVbVqDz8Lq4]
I spent the day cycling, canoeing, and enjoying family and friends. The world looks perfect to me. Greens imagine that it is falling apart.


I had snow again this morning, just a dusting, but cold temps are back. I hate to admit it during Earth Hour, but I did refill the bird feeders and rescued one of my Bluebird houses that fell victim to the frost action this year. The post was pushed far enough up out of the hole that the cold front blew it down last night. Still not any sign of Spring here yet.
The world is “falling apart” because Greens seriously believe their actions are saving it.
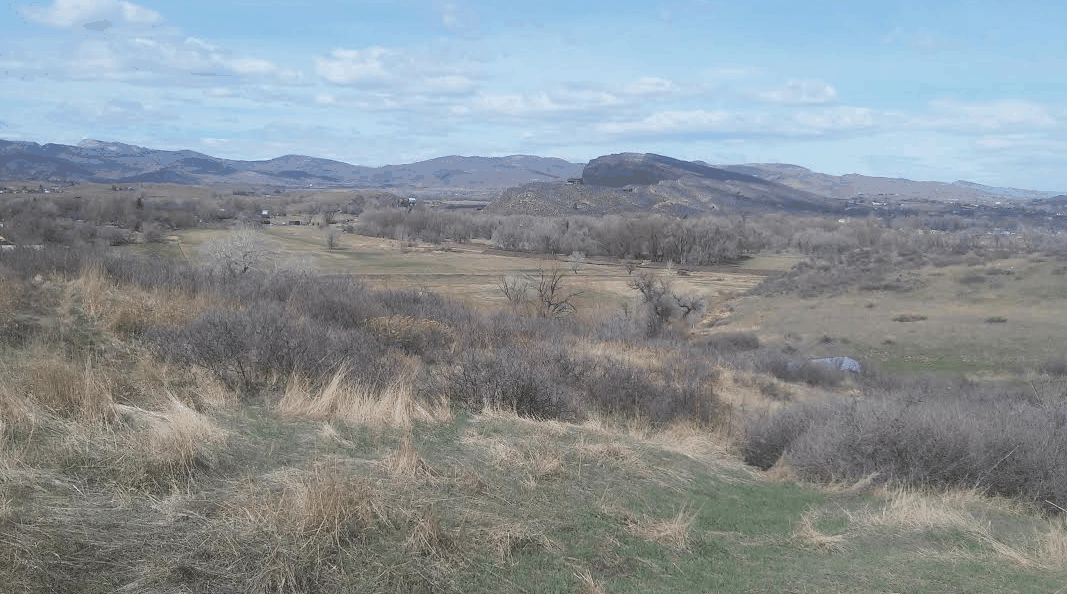
Looks like in that bottom photo you’re starting to get green grass already… Nothing but brown still where I live.
Here in Vancouver, BC, we had to cut the lawn in Feb., it was so thick. If we get a few dry days, it’s due again. “Winter” was warm and boring.
See any hookers, apparently more because of Global Warming http://www.zerohedge.com/news/2015-03-28/california-democrat-predicts-surge-hookers-blames-global-warming
Now that is funny … I wonder if the democrat is an “expert” on hookers?
Judging from the latest scandal with the DEA agents in Bogota, apparently there are a lot of Democrats in government who are experts.
They aren’t just experts, they are peers…
http://www.bagnewsnotes.com/files/2013/01/NewImage.png
Still 5 feet of snow here. No robins yet. Looks like spring is late coming to the Bay of Fundy.
FFS… don’t tell barren Chris where it is. He’ll be out there with a shotgun !!
The bird in question was carrying a gps tag, it has already been located and eliminated.
Gas mark 4 for 3 hours, garlic and thyme…lovely
Now I know why you love wind turbines, changes you from a hunter to a gatherer.
I could just walk down any highway collecting roadkill if i merely wanted to be a gatherer 😉
Gees, is there any ground wildlife left up in Scotland?.
I guess the cars might hit the occasional rodent.. watch out.
As long as it’s Halal….
Chris the Wind Barron eats at:
http://www.teeshirts4u.net/T-Shirt%20jpgs/Road%20Kill%20Cafe.JPG
Times are hard
http://www.amazon.co.uk/Original-Roadkill-Cookbook-B-Peterson/dp/0898152003
Is that a Halal cook book?
Isnt all roadkill Halal and Kosher ?
bet the greens hate this one-
http://static.zsl.org/files/wildlife-comeback-in-europe-the-recovery-of-selected-mammal-and-bird-species-2576.pdf
the big problem is spread of non- native species wiping out native species.
Yep, this 90 minute presentation by Jesse Ausubel has been making the rounds the past several weeks. I highly recommend watching it. He talks about the wildlife rebound happening in Europe and the U.S., and predicts that the combination of humans clustering into cities together with the rapid efficiency gains in agriculture and people eating less beef and more chicken, that the world will return to the wild an area the size of the country of India over the course of the next few decades (it’s already happening in parts of Russia).
http://longnow.org/seminars/02015/jan/13/nature-rebounding-land-and-ocean-sparing-through-concentrating-human-activities/
I’m guessing that in the next 2-3 decades the social engineers will be complaining about wildlife pests. We’re already seeing liberals whine about deer being pests in the northeast U.S., wild boars in the Southern U.S., Canada geese and rabbits elsewhere.
I would not call “wild” boars wildlife. They are feral, a pest and non-native (no pigs in the new world).
The absolute best BBQ I have ever had, hands down, was the backstrap of a wild boar.
Sorry, I simply can’t believe you. You’re going to need to send me 70 or 80 lbs for scientific testing. And another 70 or 80 the week after that, because science.
Brother I would love to, if only I could get my hands on some more. I have a cousin who manages a private hunting ground near Tampa Florida, for some very wealthy clients, and he is allowed to take any game he wants (the place is overflowing with deer, turkey and boar). I have a standing invitation to go bow hunting with him any time, but our schedules just have not worked out (trying to get the whole family together). My brother and his son and daughter are both bow hunters, as are my cousins two girls. So far the girls hold the records for largest kills.
They have some bragging rights, and style…
https://www.youtube.com/watch?v=9FkxMM9mc1k
But no match for us dudes…
https://www.youtube.com/watch?v=BEG-ly9tQGk
A lot of people have cause for concern…sadly nature doesn’t respect nominal borders created by humans
Probably the biggest problem we have in the Uk is with American grey squirrels ousting our native reds
https://www.youtube.com/watch?v=CBAlWgmyYks
Hey Chris,
We will trade you YOUR starlings for OUR gray squirrels. We can send all the useless politicians and Bureaucrats off to do something useful. Netting and exchanging birds for squirrels.
That would cause quite a murmuration
https://www.youtube.com/watch?v=iRNqhi2ka9k
30,000 Yoga class schedules? “She said she had culled through more than 60,000 emails from her time at State and determined that roughly 30,000 of them were public records that should have been maintained.
Clinton said the rest were messages related to private matters, such as her daughter’s wedding or her yoga class schedule, and didn’t need to be kept.” http://thehill.com/policy/defense/237276-benghazi-panel-chairman-clinton-wiped-private-email-server-clean
Clinton was NOT the one who should have been doing the culling. Remember Nixon “culled” 18 1/2 minutes of tape and was impeached.
But Gail, Hillbillary is trustworthy … do I need a sarc tag??
I see that the site occasionally get hijacked by the hunting crowd, which is the same as the Red scare crowd, which is the same give-every-grandmother-a-gun crowd, which is the same crowd who would seek membership in the bankrupt, brain dead Heartland Institute. Not one of you could solve a first order differential equation if your lives depended on it, but you’re all climate experts…
You are probably correct about the first order differential equation if your lives depended on it, but if your trust depends on it, it equals to the same ends. or it may be approximated or something like that.
” Not one of you could solve a first order differential equation ” roflmao
How is your unfinished Arts degree preparing you for barista work ??
Tell me , little boy… how do you go with things such as…
Log Pearson III, Bayesian inference, empirical distribution functions, IFDs, ARIs, pluviographs, PMP/PMF, vapour diffusion, Dalton , Penman-Monteith, Bowen ratios, Rutter, balance model, probabilistic rational method, kinematic wave theory, fluid dynamics etc?
or maybe Laplace transforms, surface integration, combinatorial topology, rings and fields, real analysis, complex analysis, partial differential equations, finite elements, stress analysis, network linear programming, etc etc are more down to your barista level ?
I am afraid my limits in math were six semesters of calculus. That does not include the three semesters in statistics or four in accounting…..
https://media2.stickersmalin.com/produit/100/stickers-devil-smile-R1-143760-2.png
Then all the more shame on you for not being to translate your education into discerning the difference between actual science and the pseudo-shamansitic bullshit that gets posted here, mainly in the form of ad hoc newspaper clippings from a 100 years back.
Its your scientific ignorance and gullibility of falsified and manipulated pseudo-science that is the real problem.
AGW is at most a failed hypothesis, but more likely a bald-faced fabrication, based on non-science and political agendas.
If you had any more than a very basic education, you would have figured it out by now.
I am very capable of discerning the difference between actual science and the disinformation put out by the government.
#1, The error bars are wider than the entire Catestrophic Warming of the twentieth century starting with the +/- 0.5 F error in the LIG thermometers and going on to 64% of the surface stations in the USA being class 4. Class 4 (CRN4) (error >= 2C) That is from the Climate Reference Network Rating Guide – adopted from NCDC Climate Reference Network Handbook, 2002.
The USA is supposed to be the best so the error of the global surface station record will have an error greater than 2 degrees C.
Second the IPCC even admits:
So what does that mean? It means that the climate at least for the last five million years has been bistable with the COLD strange attractor being the more stable condition. The Earth is actually in an ice age and in one of the brief warmer interglacials.
http://jonova.s3.amazonaws.com/graphs/lappi/Five_Myr_Climate_Change_Rev.jpg
Dansgaard-Oeschger events are periods of abrupt climate change that have occurred 25 times during the Wisconsin Ice Age between the Eemain and the Holocene. The spikes are usually 8 to 10C jumps in temperature with the larges being a 16C jump. The earth briefly warms to close to interglacial temperature before descending back into the deep freeze. Bond events are a continuation of Dansgaard-Oeschger events during the Holocene (same spacing in time) but are much less dramatic because the earth is already in an interglacial.
http://upload.wikimedia.org/wikipedia/commons/thumb/6/66/Ice-core-isotope.png/800px-Ice-core-isotope.png
Until these 8C to 16C jumps in temperature are understood and explained CAGW is completely off the table.
……..
Then comes the question of WHEN we are. At the end of the Holocene.
Remember the climate is bistable and the temperature will circle around one strange attractor until there is enough of a boot to kick the climate into circling around the other strange attractor. Dr Alley and his buddies found the switch from the Wisconsin glaciation to the Holocene ocurred in ONE YEAR!!!
This passage describes the initial discovery of Abrupt Climate Change .
The Holocene interglacial is now 11,717 years old. That’s two centuries or so beyond half the present precession cycle (or 23,000/2=11,500). So the little Ice Age was about the right time for glacial inception. However we had the Modern Grand Solar Minimum – A History of Solar Activity over Millennia
Will the earth descend into glaciation or be a ‘‘double precession cycle’’ interglacial? That is still being argued although the following paper carries a lot of weight.
A newer paper from the fall of 2012 a href=”http://www.clim-past.net/8/1473/2012/cp-8-1473-2012.pdf”>Can we predict the duration of an interglacial? agrees and gives the calculated solar insolation values @ 65N on June 22 for several glacial inceptions:
Current value – insolation = 479W m?2 (from that paper)
MIS 7e – insolation = 463 W m?2,
MIS 11c – insolation = 466 W m?2,
MIS 13a – insolation = 500 W m?2,
MIS 15a – insolation = 480 W m?2,
MIS 17 – insolation = 477 W m?2
If you want to use NOAA: @ 60N vs 65N
(www1DOT)ncdc.noaa.gov/pub/data/paleo/climate_forcing/orbital_variations/berger_insolation/insol91.jun
Holocene peak insolation: 523 Wm-2
……………………………………………..decrease = 47 Wm-2
NOW (modern Warm Period) 476 Wm-2
…………………………………………….. decrease = 12 Wm-2
Depth of the last ice age – around 464 Wm?2
That says the earth has no business being warm right now…
And the idiotic US government want to cut this life giving gas that might be all that is keeping the earth from glaciation. The gas that is in such short supply that C4 plants evolved to cope with the deficiency?
STARK RAVING MAD!
About the starvation level of the present CO2 levels:
Royal Society Carbon dioxide starvation, the development of C4 ecosystems, and mammalian evolution
Carbon starvation in glacial trees recovered from the La Brea tar pits, southern California. this is at sea level!
Impact of lower atmospheric carbon dioxide on tropical mountain ecosystems
Carbon dioxide measurements above a wheat crop
This study is telling you that wheat can suck the CO2 levels down to about 310 to 320 ppm It is also telling you wheat will be in starvation mode bellow 320 ppm in an open field.
How fast do plants suck down CO2?
Tomato Plant Culture: In the Field, Greenhouse, and Home Garden, Second Edition
That says that CO2 starvation means less seed produced and a slower time to maturity. Wheat and tomatoes are both C3 plants.
I think I have said this several times before…
The demonisation of CO2 and the attempts to actually restrict CO2 emissions is probably..
THE MOST STUPID THING HUMANS HAVE EVER DONE !!