
Gaia is simply not cooperating with the global warming scam.
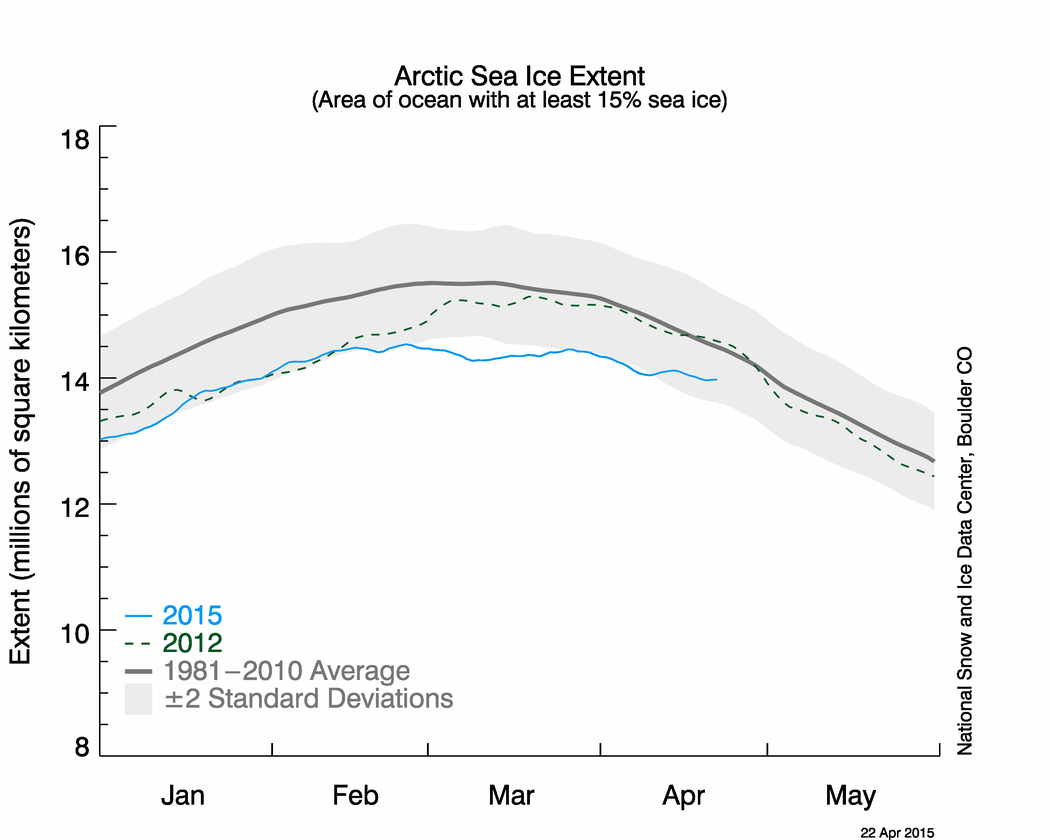
Arctic sea ice is in the normal range.
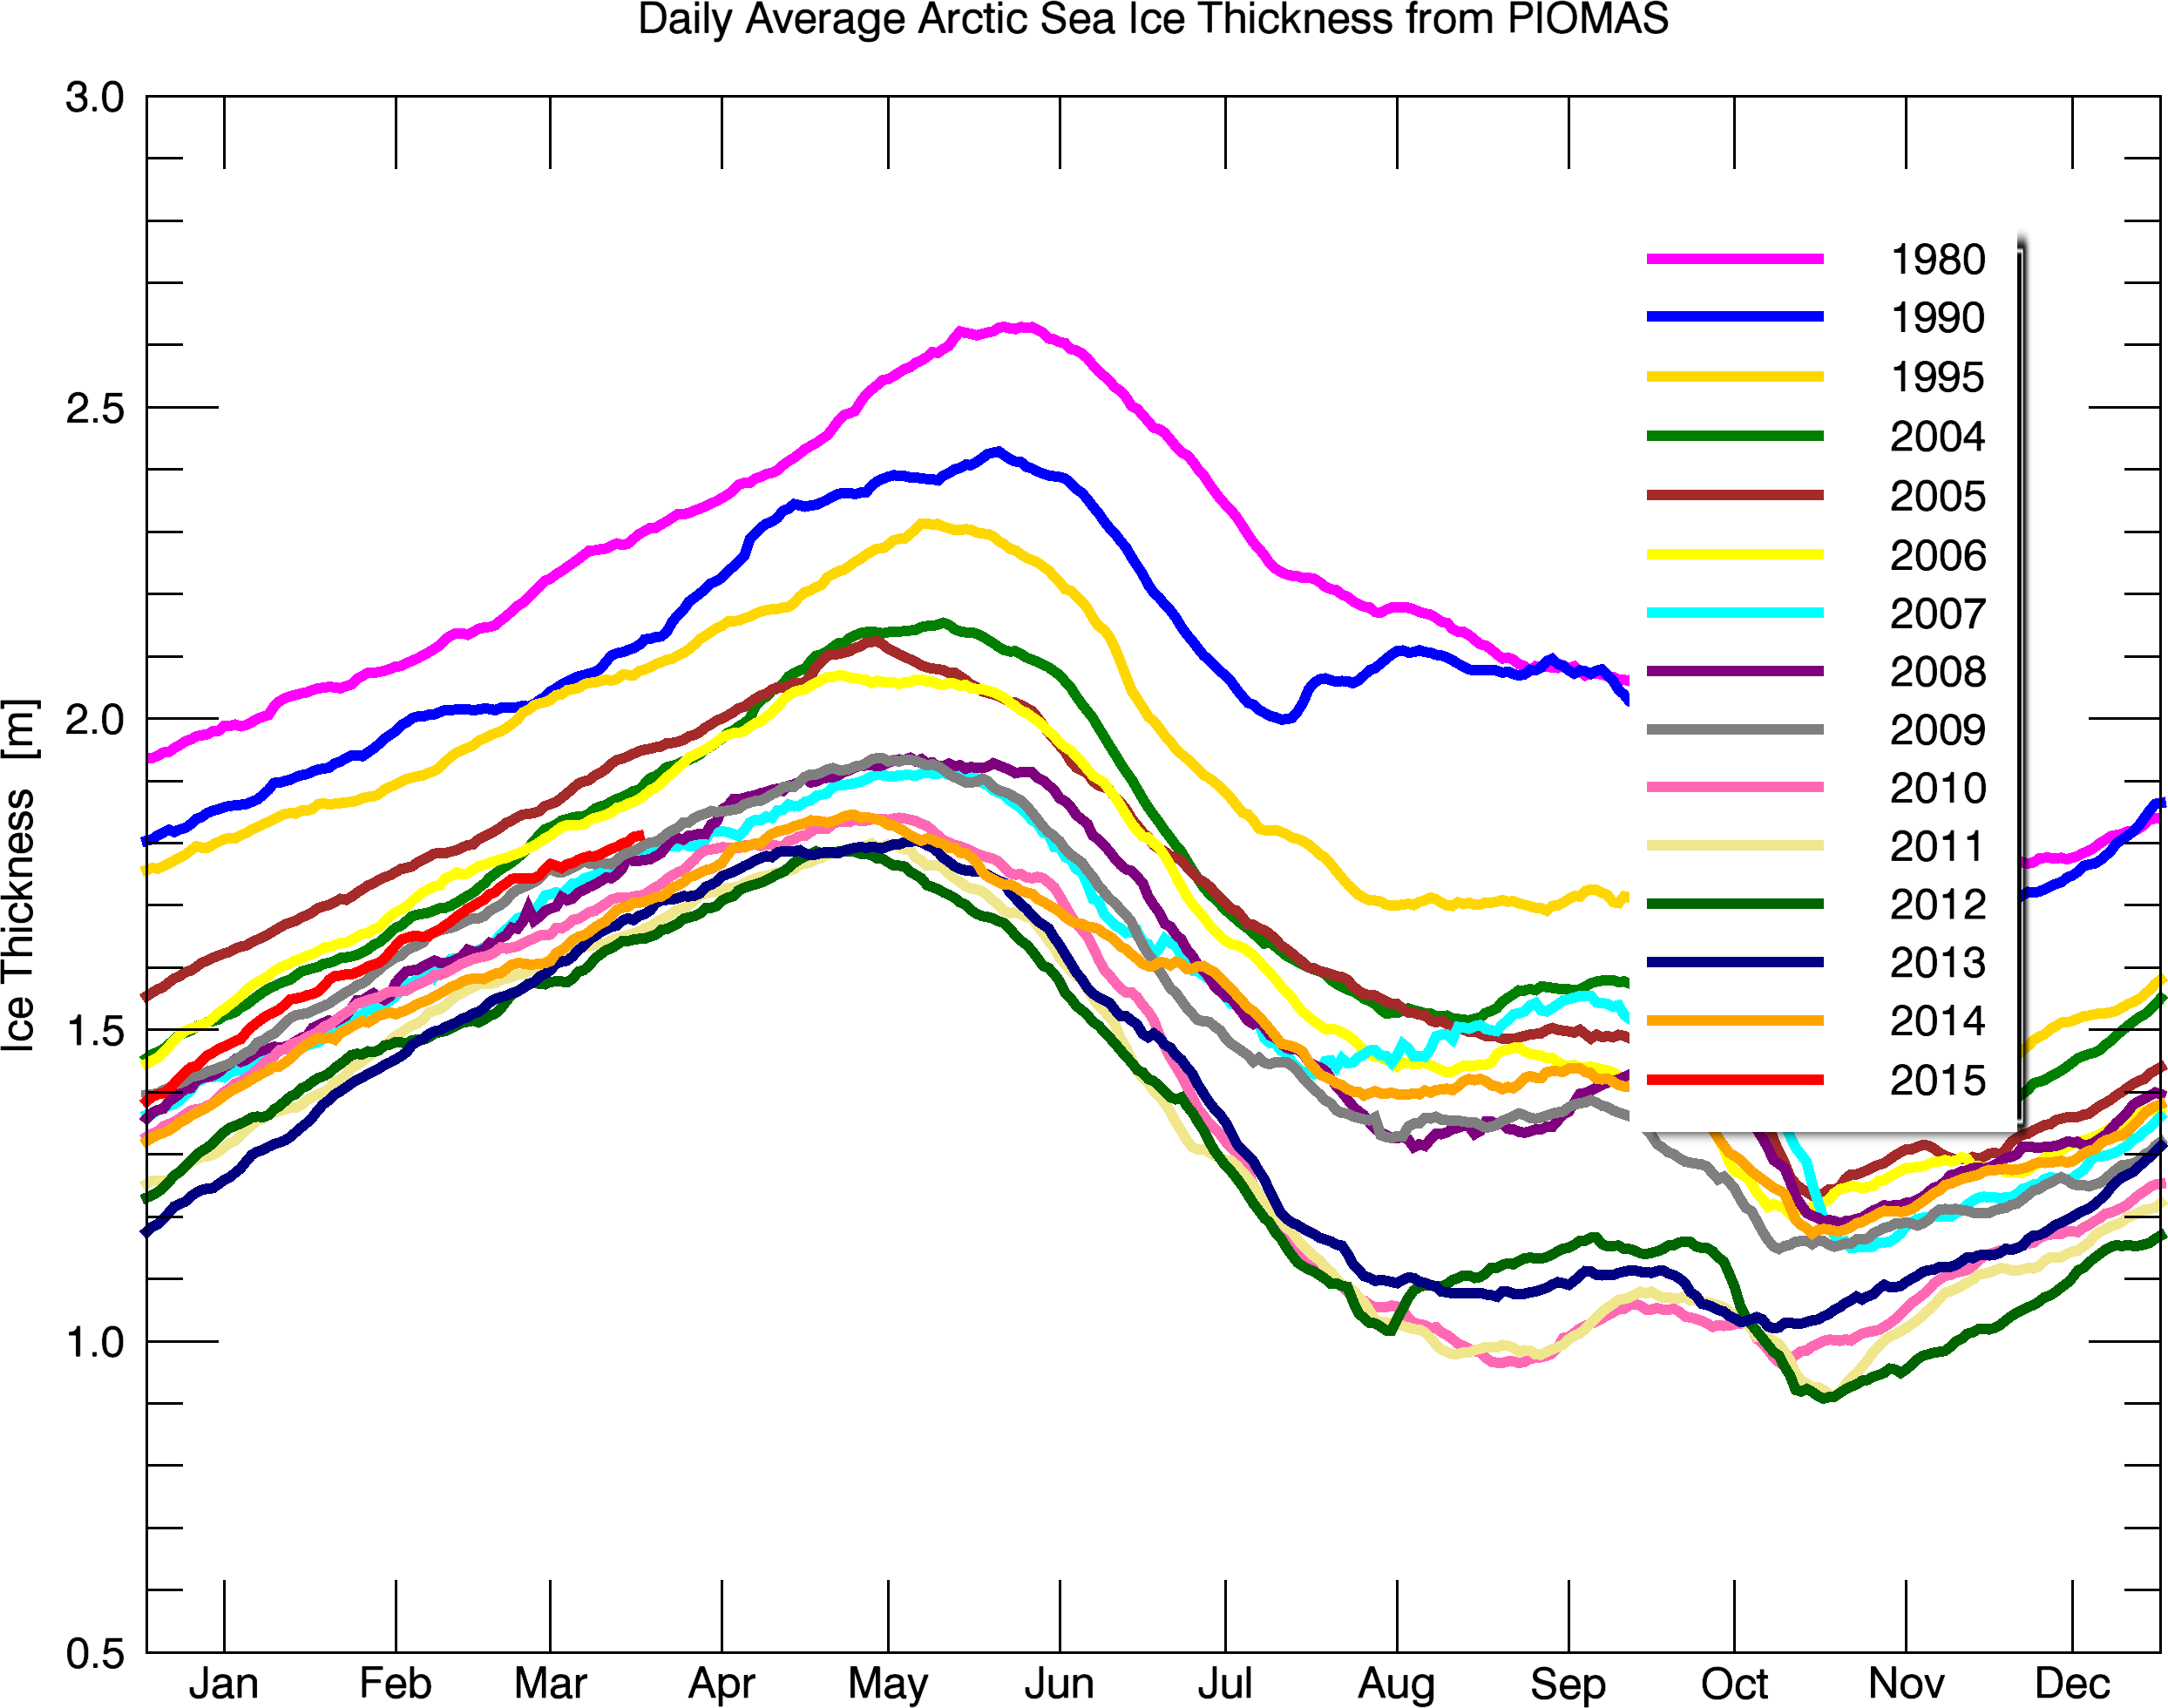
Arctic sea ice is the thickest it has been since 2006
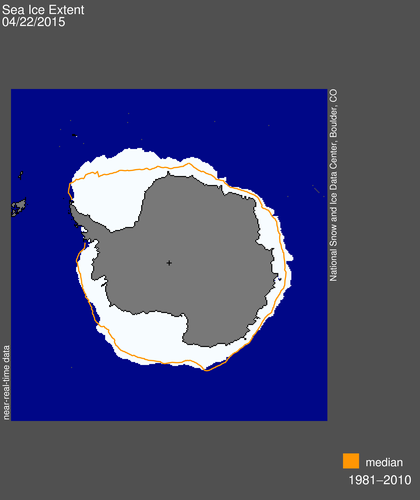
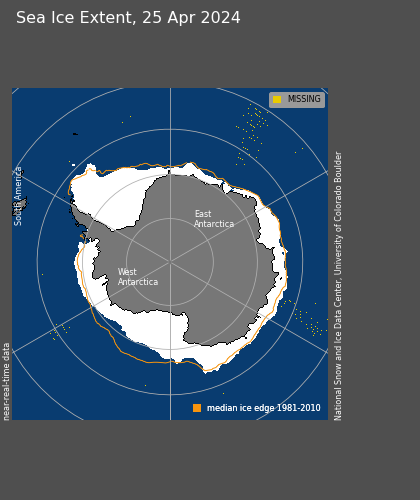
Antarctic sea ice is at record levels

The claimed melt areas of Antarctica (Larsen, WAIS) have excess sea ice, indicating the water and air is persistently colder than normal and near or below the freezing point.
Atmospheric temperatures are below what 97% of climate models predicted. Global warming theory is based on atmospheric temperatures.
Winter snow extent continues to increase, indicating that cold air is pushing further south.

US tornadoes have been occurring at record low levels in recent years. US hurricane activity is the lowest on record. Before data tampering, the US is experiencing a century long cooling trend. The US continues a century long trend of being wetter with less drought
Climate at a Glance: Time Series | National Climatic Data Center (NCDC)
There has been no change in the rate of sea level rise as measured from tide gauges over the past century. Many tide gauges show no rise at all
Climate alarmists are lying about nearly every single talking point. Almost none of the things they predicted have come true, and they have instead resorted to data tampering, outright lying, intimidation, censorship, and worse.

thank you for this information.
There is nothing ‘normal’ about weather or climate, and certainly nothing ‘normal’ about a cherry picked 1981-2010 ‘average’.
A peer-reviewed paper published in the Canadian Journal of Earth Sciences finds that Arctic sea ice extent at the end of the 20th century was more extensive than most of the past 9000 years. The paper also finds that Arctic sea ice extent was on a declining trend over the past 9000 years, but recovered beginning sometime over the past 1000 years and has been relatively stable and extensive since.
http://hockeyschtick.blogspot.com/2010/09/paper-current-arctic-sea-ice-is-more.html
Climate alarmists always have something to look forward to. Usually it’s climate devastation caused by excess humans. The current decline in global temperature, and subsequent ice, snow accumulation is only a temporary problem for the scammers. Given a long enough time line, Mother Nature will cooperate. The question is: can they keep up ClimateGeddon fever for tens of thousands of years?
65, 000 years to be exact.
Or with human influence. 1,000 mi diameter space mirrors, anyone?
Nice synopsis. Imagine if some editor had enough balls to print this on the front page; that would cause some change/disruption etc.
As it is, at least we have Al Gore’s interweb to dig for the truth.
HMMMmmm …Breitbart and James Delingpole come to mind….
I am a regular on Breitbart, but unless you are specifically seeking such knowledge a search engine will rarely if ever lead you to that site. I was thinking an editor or publisher of say New York Times, Washington Post or Winnipeg Sun.
Perhaps a rich person who does NOT support AGW might take out a full page NY Times ad with that content. They would also need pretty thick skin to survive the various assaults they could then expect for their trouble.
I think that Arctic ice is now within 1 standard deviation of the mean for the first time since I started paying close attention to the global warming/climate change/climate disruption war.
And I see that global sea ice area is 391,0000 sq kilometers above normal today.
Where are you getting that from?
Looks like it might be NH anomaly – SH anomaly from Cryosphere Today:
http://arctic.atmos.uiuc.edu/cryosphere/
They haven’t updated that in a couple of weeks.
Unfortunately, there are no dates on the graphs and the site is called ‘The Cryosphere Today’ – maybe they should rename it ‘The Cryosphere The Week Before Last’.
/sarc
Looks like they are working on another trick.
Reblogged this on Climatism and commented:
Many thanks to those who have helped restore Mother Earth to her former glory. Without these people, their orgs and their tireless taxpayer funded dollars, we would still have climate and weather.
Gaia salutes:
– Barack
– UNEP
– Copenhagen
– Kyoto
– Lima
– Gore
– UN
– DiCaprio
– Earth Hour
– Schneider
– Maurice
– Earth Day
– Mikey
– Gavin
– ManBearPig (Al)
– NASA
– Jones
– Romm
– CSIRO
– Flannery
– Klein
– Trenberth
– NOAA
– Heyhoe
– NSIDC
– Gillard
– Rudd
– Santer
– UNFCCC
– Kook & Nuttercelli.
Oh and thanks to those who funded those above who brought us back from the tipping point of climate thermageddon:
– Taxpayers
– Poor people and
– Poorer people.
Paris, here we come!
December… WIth luck Ma Gaia will dump a really big blizzard on Paris, the likes of which we have not seen since the Little Ice Age.
I so wish you are right.
http://wxmaps.org/pix/temp7.html
I inadvertently started watching BBC’s ‘Frozen Planet’. I wasn’t into it by more than 15 minutes are so when they dragged out the idiocy that the Northwest Passage will be open for the first time in recorded history. Uhhh, it IS recorded that it opened in the late 1800’s and then again in the early 1900’s. I guess that has been flushed down the memory hole.
There is NO lie they won’t tell to support their misanthropic power grab.
Warmist assertions are a reliable guide to the exact contrary of reality. It’s uncanny!
Nazi’s never change…
https://www.youtube.com/watch?v=MFc4MxupCNM
(As an aside, Bob Crane looks so much younger than he did when I watched this as a kid)
Here is why Big Brother and his consensus lies are headed south.
FACTS [1] versus FALSEHOODS [2]
“Empirical Facts versus
Consensus Fables“”
1. EF: The Sun generates hydrogen
1. CF: The Sun consumes hydrogen
2. EF: Neutrons repel other neutrons
2. CF: Neutrons attract other neutrons
3. EF: The interior of the Sun is iron (Fe) surrounding a pulsar core
3. CF: The interior of the Sun is hydrogen (H) encasing a H-fusion reactor
4. EF: Aston’s “nuclear packing fraction” tells nuclear stability
4. CF: Weizsacker’s “nuclear binding energy” tells nuclear stability
5. EF: The Sun’s pulsar core created and sustains every atom, life and planet in the solar system.
5. CF: World leaders and government scientists united under the UN and NAS try to rule the world.
“Truth and Freedom versus
Falsehoods and Slavery“
TF: We were endowed by our Creator with inalienable rights to life, liberty and the pursuit of happiness.
SF: We are endowed by Big Brother with a life of servitude if we do not question the consensus science Big Brother purchases with public funds.
CONCLUSION: Ordinary liars would not accept public funds to deceive and enslave the public. Only the most arrogant fools would try to hide the creator and sustainer of every atom, life and world in the solar system from the public.
References:
1. “Solar energy” or Teachers Supplement to “Solar Energy”
https://dl.dropboxusercontent.com/u/10640850/Solar_Energy.pdf or
https://dl.dropboxusercontent.com/u/10640850/Supplement.pdf
2. UN, NAS, RS, DOE, NSF, NASA, EPA, NOAA, Science, Nature, PNAS, PRS, etc.
Thank you for giving members of [2] an opportunity to explain why they overlooked or ignored experimental data [1] that challenge the validity of consensus “science”.
Your government at work for you!
Secretary of State John F. Kerry said that the Arctic is undergoing profound climate change at an alarming pace that will affect northern coastal communities and, eventually, the world.
“We’re on a dangerous path,” said Kerry, citing rising methane and soot emissions from diesel engines, airplane exhaust and wood-burning fires, all of which cover snow and absorb the sun’s heat, speeding warming.
http://www.washingtonpost.com/world/how-the-us-plans-to-combat-arctic-combat-change/2015/04/24/d2a38a92-ea8c-11e4-9a6a-c1ab95a0600b_story.html
To avert an ice age, Kerry’s buddies back in the ’70s were offering up a solution that we spread man-made soot all over the Arctic. They didn’t have to do that, because hardly any sooner, two very busy solar cycles in a row began a the end of 1976, and provided the perfect ingredients for a new, man-made, global warming scare.
Now, he’s claiming the snow is covered by man-made soot from emissions, and speeding up warming of the Arctic. That’s two bold-faced LIES in the same sentence.
I’d be at least $1.00 everyone of these Washington politicians that are pushing a climate agenda have their hand in the till somewhere along the way.
That is not a bet that is a certainty and everyone knows it.
OUCH! a wee bit of a vote of no confidence for the general public.
IPCC AR5
7.2.1.2 Effects of Clouds on the Earth’s Radiation Budget
The effect of clouds on the Earth’s present-day top of the atmosphere (TOA) radiation budget, or cloud radiative effect (CRE), can be inferred from satellite data by comparing upwelling radiation in cloudy and non-cloudy conditions (Ramanathan et al., 1989). By enhancing the planetary albedo, cloudy conditions exert a global and annual shortwave cloud radiative effect (SWCRE) of approximately –50 W m–2 and, by contributing to the greenhouse effect, exert a mean longwave effect (LWCRE) of approximately +30 W m–2, with a range of 10% or less between published satellite estimates (Loeb et al., 2009). Some of the apparent LWCRE comes from the enhanced water vapour coinciding with the natural cloud fluctuations used to measure the effect, so the true cloud LWCRE is about 10% smaller (Sohn et al., 2010).
!!!!!The net global mean CRE of approximately –20 W m–2 implies a net cooling!!!!
(emphasis mine)
Anthropogenic GHGs between 1750 & 2011 added less than 3 W/m2. CRE cooling is six times as much as GHG warming.
Earthshine (albedo) Changes
http://wattsupwiththat.files.wordpress.com/2007/10/earth_albedo_bbso.png
I think they have some method to the madness. It is such a huge steaming pile of filthy lies that pointing them out to the brainwashed just is too much for their minds too swallow.
People believe that “scientists” are somehow some special breed of extra honest and selfless persons, above saying anything that is untrue or that they are unsure of.
But there is fresh ammo nearly every day, if you know how to spot it.
I was just reading about how the FBI has now admitted that all the experts who have ever testified in a courtroom about hair analysis forensic evidence were lying about how certain they could be of matching hairs being used for identifying criminals…or anyone else for that matter.
The whole science of hair analysis was and has been a huge fraud, one in which people have been sent to jail, and even to their death on bogus evidence and bogus expert testimony.
Add this to the revelations about arson forensics a few years back, and it is plain that even supposed justice officials have stood up in open court and sworn on bibles, and then lied big fat lies and sent innocent men and women to jail and to their death in some cases.
WTF is the world coming too?
http://www.slate.com/articles/news_and_politics/jurisprudence/2015/04/fbi_s_flawed_forensics_expert_testimony_hair_analysis_bite_marks_fingerprints.html
This is definitely another example of how science is not absolute, and that scientists lie and show false confidences. I just hope it does not cause the release of dangerous inmates.
I know a guy who did over 20 years in maximum security pisons, and he said he never met an innocent man there. It is wrong to give false testimony, and those witnesses should do time, but when it comes to hard time and violent crime, there is a reason those folks are behind bars.
Most of the time, yes. But I do not believe that there are no innocent people in jail. I think it happens more than anyone would like to think.
Even one is too many.
I am a law and order person myself, and I hated to read a story like this. As I hated to read about the Texas man, Cameron Todd Willingham, who was sentenced to death for setting fire to his own house and letting his babies burn alive.
That Slate article (which I ever read, but someone I know posted that article on FB yesterday) has a link to a story about a guy who has been in jail for 26 years for something even the police who arrested him and the prosecutor who tried him now think is definitely innocent.
DNA evidence is freeing people all the time, and it is very depressing to think about someone spending their life in jail for something they did not do.
In nearly every such case, it always sounds like the person was just assumed guilty because he was arrested, and no one really even listened to the innocent man or looked at the case objectively.
I didn’t say jail. I am talking about hard time and violent offenders.
I have seen people released who may not have committed the particular offense for which they were ultimately imprisoned, but I have not seen any who were “innocent”. First time offenders are not put behind bars without a very good reason.
Don’t know if this is the best place for my questions, but considering the audience and participants the answers should be nearby.
Many moons in the past I spotted a footnote in the World Bank 4 C report that gave me pause. It’s about the chemical difference between carbon and carbon dioxide. As we chemists and combustion engineers know burning one pound of carbon produces 3.67 pounds of CO2, 44/12, pretty basic.
World Bank 4C report Chap 2, Fig 1
“Different conventions are used are used in the science and policy communities. When discussing CO2 emissions it is very common to refer to CO2 emissions by the weight of carbon—3.67 metric tons of CO2 contains 1 metric ton of carbon, whereas when CO2 equivalent emissions are discussed, the CO2 (not carbon) equivalent is almost universally used. In this case 350 billion metric tons of carbon is equivalent to 1285 billion metric tons of CO2.”
When someone says xxx.x Peta (E15) grams, Giga (E9) tonnes (1,000 g = kg & 1,000 kg = tonne) of Carbon, do they mean carbon carbon or carbon dioxide?
Attempting to resolve this I used data from IPCC AR5 Chapter 6.
“CO2 increased by 40% from 278 ppm about 1750 to 390.5 ppm in 2011.”
“Anthropogenic CO2 emissions to the atmosphere were 555 ± 85 PgC (1 PgC = 1015 gC) between 1750 and 2011.”
“About half of the emissions remained in the atmosphere (240 ± 10 PgC) since 1750.”
(240/555=43%, World Bank 4C report says 45%)
………Atmospheric dry air = 5.14E18 kg (Wiki)
1750…………..278 ppm……..1.43E18 g
2011………….390.5 ppm…..2.01E18 g
Difference……112.5 ppm…..5.78E17 g
If C stands for carbon carbon than the 555 PgC must be multiplied by 3.67 to get CO2 and then by 45% for the amount left in the atmosphere or 9.17E17. That’s 159% of the amount added between 1750 and 2011 based on ppm.
When you eliminate the impossible what is left no matter how improbable…..
So in this case PgC carbon must mean carbon dioxide. Applying the 45% atmospheric component to the 555 PgC/y gives 250 PgC/y or about half, 43%, of the 5.78E17 grams CO2 increase between 1750 and 2011.
I have frequently read/heard that man’s CO2 was responsible for 100% of the atmospheric CO2 ppm increase between 1750 and 2011. The analysis above says less than half. Should this 50/50, (man’s CO2)/(no man’s CO2), relationship hold steady what does that do to all of the GCMs and RCPs that might be based on 100% man’s CO2?
This AGW/CC ground has been plowed thoroughly and deeply (while flogging dead horses) and chances are several of you plowmen have covered this ground before, have the answer and related links at hand, and can simply paste them into your replies.
Thanks.
It’s me again, I’m going to take another shot at this.
After further investigation it appears that my ppm gram weight based method in an earlier post has some flaws. Let’s discuss ppm.
The IGSS site (Mass of atmos CO2 page) says ppm is volumetric based. I have seen other sources that refer to ppm as volumetric based including references to Mauna Loa. ppmv
My approach posted earlier suggested that ppm is gram weight based. ppmgw
World Bank 4C report says ppm is mole based. See earlier post in this thread. ppmmol
Which is it? Which one did IPCC use? Why don’t they specify?
Since the specific volume of CO2 is less than that of air, the anthro CO2 ppm volumetric or mole basis will be even less than the gram weight based. All of these cases use the residual 45% atmospheric component.
IPCC AR5
Year……ppm
1750……278
2011……390.5
Diff…….112.5
Additional CO2 due to man…….555 PgC (As noted in my earlier thread this C is carbon dioxide. If this C were carbon one would have to multiply by 3.67 and the result would be more than the ppm & mass difference.)
ppm gram weight based=(grams CO2 added)/(atmospheric grams)
(5.55E+17/ 5.14E+21)*.45 = 48.6 ppm or about 50% of the 112.5 ppm CO2 increase between 1750 and 2011.
ppm volumetric based=((grams CO2 added)/((1.842 grams CO2)/m^3 ))/((grams air)/((1.205 grams air)/m^3 ))
(5.55E+17 * 1.205)/ (5.14E+21 * 1.842)*.45 = 35.4 ppm or about 30% of the 112.5 ppm CO2 increase between 1750 and 2011.
ppm mole based=((grams CO2 added)/((44.01 grams CO2)/mole))/((grams air)/((28.97 grams air)/mole))
(5.55E+17 * 28.97)/ (5.14E+21 * 44.01)*.45 = 35.6 ppm or about 30% of the 112.5 ppm CO2 increase between 1750 and 2011.
What it all boils down to is: 1) mankind’s CO2 output contributed about 30% of the CO2 increase between 1750 and 2011 and 2) evaporating water vapor absorbs the increased RF from CO2 without increasing the global temperatures.
http://www.warwickhughes.com/icecore/call2.jpg