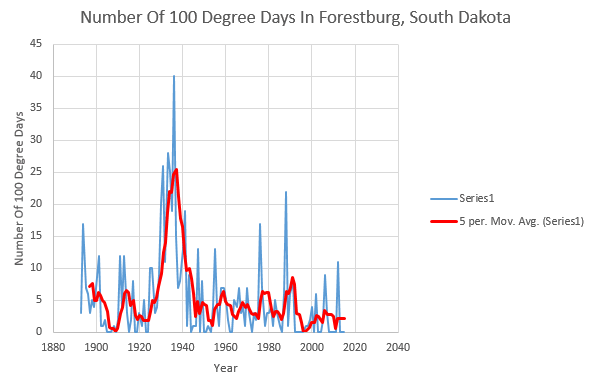
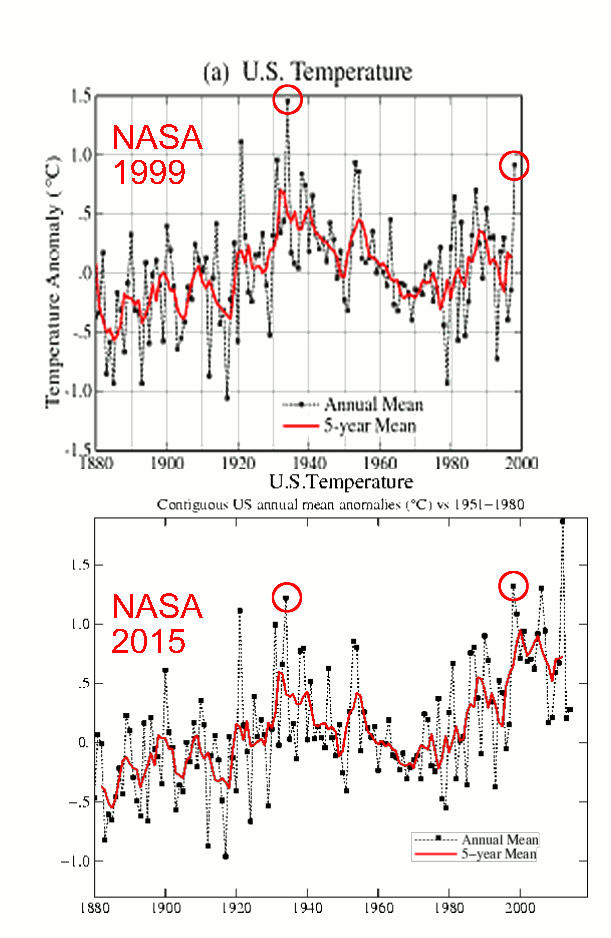
On this date in 1935, Forestburg, South Dakota was 104 degrees, compared to a forecast high of 68 degrees today. One hundred degree days used to be very common there, but they rarely happen anymore. In order to hide this cooling, criminals at NOAA and NASA massively tamper with the temperature data.
Disrupting the Borg is expensive and time consuming!
Google Search
-
Recent Posts
- Gaslighting 1924
- “Why Do You Resist?”
- Climate Attribution Model
- Fact Checking NASA
- Fact Checking Grok
- Fact Checking The New York Times
- New Visitech Features
- Ice-Free Arctic By 2014
- Debt-Free US Treasury Forecast
- Analyzing Big City Crime (Part 2)
- Analyzing Big City Crime
- UK Migration Caused By Global Warming
- Climate Attribution In Greece
- “Brown: ’50 days to save world'”
- The Catastrophic Influence of Bovine Methane Emissions on Extraterrestrial Climate Patterns
- Posting On X
- Seventeen Years Of Fun
- The Importance Of Good Tools
- Temperature Shifts At Blue Hill, MA
- CO2²
- Time Of Observation Bias
- Climate Scamming For Profit
- Climate Scamming For Profit
- Back To The Future
- “records going back to 1961”
Recent Comments
- Bob G on Gaslighting 1924
- Hank Phillips on Climate Attribution Model
- conrad ziefle on Gaslighting 1924
- Bob G on Gaslighting 1924
- conrad ziefle on “Why Do You Resist?”
- conrad ziefle on Gaslighting 1924
- Bob G on Gaslighting 1924
- John Francis on “Why Do You Resist?”
- conrad ziefle on Gaslighting 1924
- Bob G on Gaslighting 1924


The 1930’s were truly astounding. How can they possibly claim there is catastrophic warming, when we can’t remotely approach the temperatures from 80 years ago?
I have personally examined in detail the actual temperature records from the 1930’s for many states. It is utterly delusional to claim it is currently as warm or warmer than it was back then.
I was in Rapid City, South Dakota on July 6th, 1973. Officially the temperature hit 110.8 degrees F. Some places around town reported 113 degrees. Whew!
That graph looks a lot like the summer temp series from the CAG page. (hope the link works)
http://www.ncdc.noaa.gov/cag/time-series/us/39/0/tavg/3/8/1895-2015?base_prd=true&firstbaseyear=1901&lastbaseyear=2000&filter=true&filterType=binomial
Switching to Tmax really makes it obvious.
http://www.ncdc.noaa.gov/cag/time-series/us/39/0/tmax/3/8/1895-2015?base_prd=true&firstbaseyear=1901&lastbaseyear=2000&filter=true&filterType=binomial
Checking the adjustments http://www.ncdc.noaa.gov/temp-and-precip/divisional-comparison/ made to the records from SD, even with the cooling of the past, it still shows up.
I have a theory.
CO2 and US Gun ownership show a much higher degree of correlation than does temperature.
http://beforeitsnews.com/alternative/2014/11/gun-ownership-by-the-numbers-3058416.html
https://www.newscientist.com/article/dn11638-climate-myths-human-co2-emissions-are-too-tiny-to-matter/
The next step in my research is to determine whether CO2 causes Guns or Guns cause CO2.
We all know that correlation means causation. I know it sounds far fetched, but lets face it, its a better theory than the one Pope Obama and President Francis are proselytising.
🙂
https://en.wikipedia.org/wiki/Steele,_North_Dakota
And yet, just 79 years later, further north, in North Dakota…….compared with….
http://www.weather.com/weather/monthly/l/58482:4:US
Really? What really is the difference?
74 degrees on that same date in 2015?
This is very torrid………
Arghhhhhhhhhhhhhh! The pain.the pain…….and, at lower carbon footprint…paranoia will get ya!!!!
Correction: 38 degrees difference……it was the Port Wine….forgive me