
National Geographic published this spectacularly fraudulent hockey of sea level, along with this wildly false claim.
Local measurements of sea level with tide gauges became common after 1880; satellites began global measurements in 1992. They’ve shown a clear acceleration: At an eighth of an inch a year, sea level is rising twice as fast as it was a few decades ago.
NOAA says that sea level rise rates are one half of the fake National Geographic claims.
absolute global sea level rise is believed to be 1.7-1.8 millimeters/year
This hockey stick is exactly inverted from the real data. Sea level rise has slowed tremendously over the last seven thousand years.
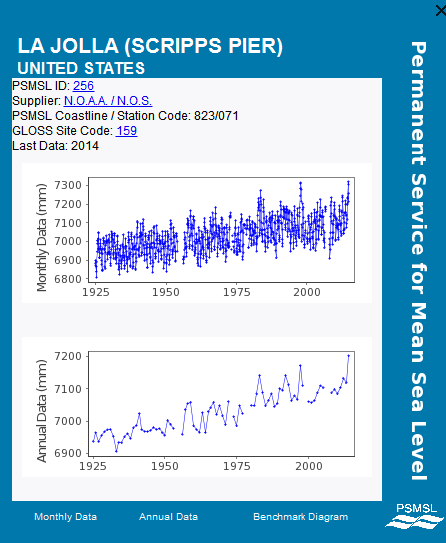
And their claim of recent acceleration is wildly false. Many gauges show no sea level rise, or sea level falling. Few, if any show acceleration (upwards curvature) in recent decades. National Geographic is defrauding their readers with their flagrant lies.
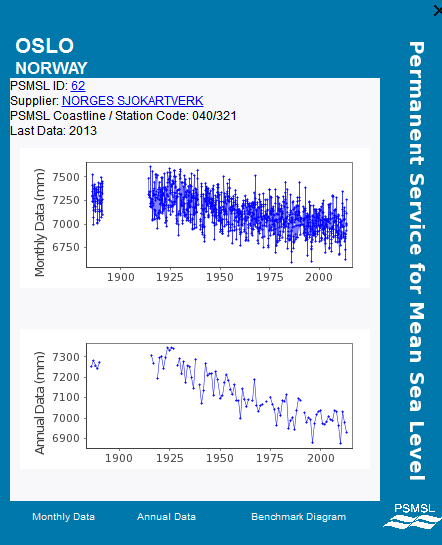
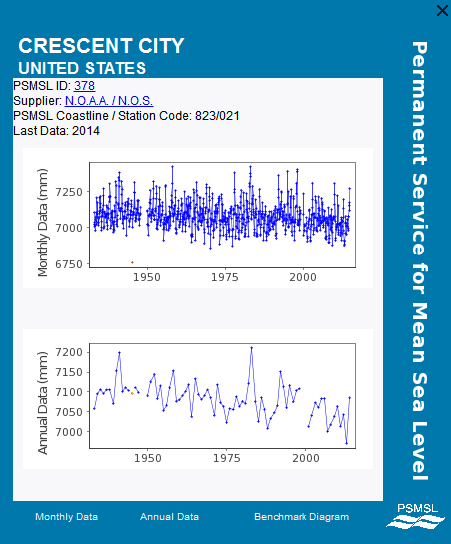
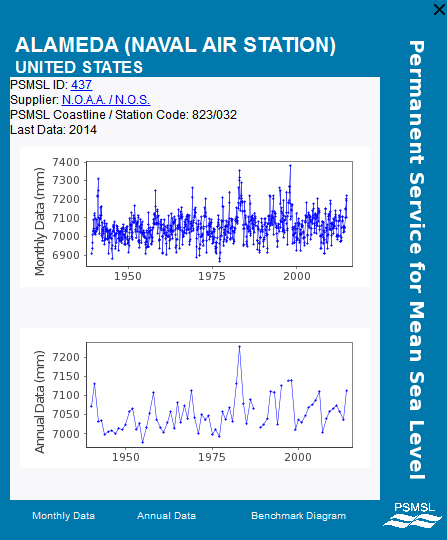
Tide gauges that do show sea level rise, generally show that sea level rose faster in the past.
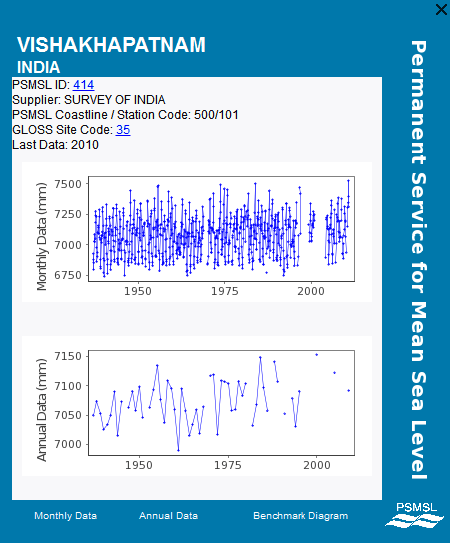
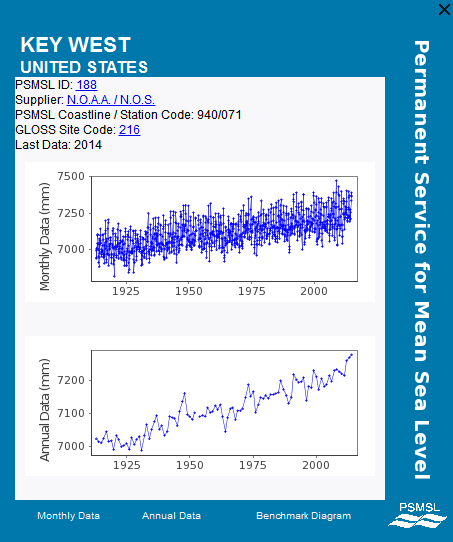
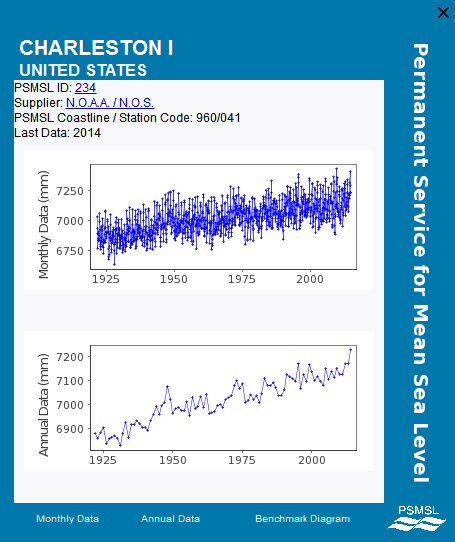
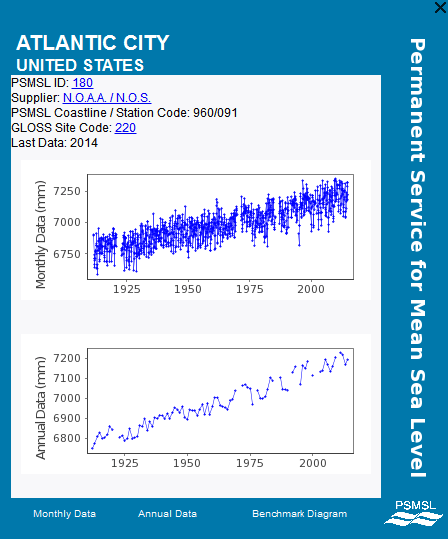
East coast tide gauges show that sea level rose much faster prior to 1950.

http://www.hyzercreek.com/BrokenCueStick.jpg
Look at the broken cue stick, National Geographic’s contribution to climate change sporting goods.
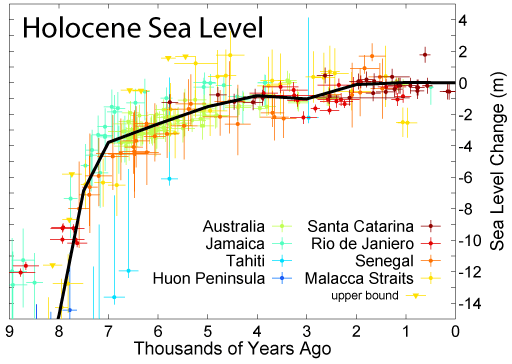
Note in the chart of the Holocene sea level rise the red cross on the top right (Santa Catarina) moves the line through the points from a decreasing sea level trend to an increasing sea level trend.
This is a critical study because it is the one that yanks the WIKI sea level chart (adjusted of course) from a falling sea level to a slowly rising sea level. (The area is tectonically stable and unglaciated so there is no need for adjustments.)
https://upload.wikimedia.org/wikipedia/commons/1/1e/Holocene_Sea_Level.png
Again Santa Catarina is that dark red cross above the pack on the right. Remove it and sea level is actually falling for the last 2,000 years.
The Quaternary Geological History of the Santa Catarina Southeastern Region (Brazil) 1999
The first part discusses drilling in several locations and analyzing samples. They mention dating prior to that was guesses. “…. A drilling campaign done in the domain permitted the sampling of material for 14C datings, and the obtained data confirmed some previously assumed ages. The sequence of events, that originated the Holocene deposits, has been also reconstructed through drilling and 14C dating of the collected peat and shell samples…”
In the body of the text is this:
“…a relative sea-level change curve for the last 7 ky in the area Florianópolis-Jaguaruna (Fig. 7) is outlined…” Note the curve at the very top of the post.
https://i0.wp.com/www.scielo.br/img/fbpe/aabc/v72n2/0025img17.gif
This study shows a sea level highstand ~ 4 meters above the present level about ~5000 years ago. With sea level oscillating since then. Not only has the sea levels dropped since the Holocene Optimum the evidence shows that “warmer paleotemperatures were favourable for great proliferation of mollusks in the area” (Santa Catarina Brazil is at latitude 27.2500°S. )
Two more studies showing falling sea level.
Mid to late Holocene sea-level reconstruction of Southeast Vietnam using beachrock and beach-ridge deposits
Translation the sea level was up to 1.5 meters higher than today in a tectonically stable area ~5000 years ago to 2000 years ago.
Late Quaternary highstand deposits of the southern Arabian Gulf: a record of sea-level and climate change
This study shows a sea level highstand ~1 to 2 meters above the present level about ~5500 years ago.
All three studies from around the globe show FALLING sea levels! WHERE does that ‘adjusted’ graph show that fall of 1 to 2 meters? Instead if you look closely the graph shows a ~1.5 meter RISE instead of a fall since 5000 years ago! That is an ‘Adjustment’ of 3 or more meters to data from tectonically stable areas. Lysenkoism at it’s finest.
What I love about climate is that day after day after day, the evidence keeps mounting against them. So, sooner or later even idiots like Obama will realise that these fraudsters are just that.
And thankfully, because of sites like this, they will not be able to claim “but no one said anything different” … which is what they’ve always said in the past when they controlled what could and could not be printed.
Reblogged this on Climatism and commented:
And they want to jail people who question, or are ‘sceptical’ of whacko claims like this, and not the other way around?
We live in truly bizarre and dangerous times.
It’s not just National Geographic, it is now even more than a national pasttime, because it is a North American Union charter…
As noted in an earlier post here, approximately 66% of the GHCN record is estimated after processing by the GHCN adjustment models. In the current GHCN data set, there are 226 unique country codes represented. Following are the top and bottom stewards of temperature data, by country, based on the frequency that the GHCN adjustment models replace their raw data with an estimated value.
The top 10 countries with the most pristine temperature record:
Country % Estimated
DJIBOUTI 0.0%
TROMELIN ISLAND (FRANCE) 0.0%
QATAR 0.0%
COCOS ISLANDS (AUSTRALIA) 0.0%
WESTERN SAMOA / SAMOA 0.0%
BELARUS 0.0%
KAZAKHSTAN 0.0%
ARGENTINE BASE IN ANTARCTICA 0.0%
PEOPLE’S DEMOCRATIC REPUBLIC OF YEMEN 0.4%
MOLDOVA 1.0%
The 10 bottom-feeding countries requiring the most adjustment are:
Country % Estimated
BARBADOS 97.8%
CHRISTMAS ISLAND (AUSTRALIA) 95.7%
NIUE (NEW ZEALAND) 95.6%
CYPRUS 94.2%
SOUTH GEORGIA (U.K.) 93.3%
MACAU (PORTUGAL) 93.2%
UNITED STATES OF AMERICA 92.5%
BERMUDA (U.K.) 92.3%
BAHAMAS 92.2%
CAPE VERDE 91.9%
http://wattsupwiththat.com/2015/09/27/winners-and-losers-in-the-ghcn-estimation-derby/
This Title:
“Why has an acceleration of sea level rise not been observed during the altimeter era?”
Found at this link:
http://www.aviso.altimetry.fr/fileadmin/documents/OSTST/2011/oral/02_Thursday/Splinter%203%20SCI/04%20Nerem%20ostst_2011_nerem.pdf
Tells us that the acceleration of sea level rise has been negative since 1992.
That presentation by Dr. Steve Nerem (He keeps the satellite data at Colorado U’ Sea Level Research Group) is a few years old now but it remains true.
Anyone can download the data from CU’s web page
http://sealevel.colorado.edu/files/2015_rel3/sl_ns_global.txt
and do the acceleration calculation for themselves.
Reblogged this on 4timesayear's Blog.
Sydney, Australia. 6 cm per century … not that any of the local government nor local media want to share the truth.
http://theclimatescepticsparty.blogspot.com.au/2014/10/no-dangerous-sea-level-rise-for-nsws.html
Any of the hundreds of serious book on geology or oceanography written since 1899 will show you and explain thousands of examples of places were the stable sea level seems to rise or fall because the continental ground is subsiding or emerging. The arguments given by the #AGW and #AGWstooges are false and unscientific. More at:
SEA LEVEL RISE NATGEOGRAPHIC http://wp.me/p5UsvC-3c
SEA LEVEL RISE = http://wp.me/p5UsvC-2J
I started looking into the ‘adjustments’ due to post-glacial rebound and tectonic uplift (mountain building) and got side tracked into the censorship performed by NOAA/NASA.
This is the chart censored:
https://web.archive.org/web/20060505184553/http://www.homepage.montana.edu/~geol445/hyperglac/isostasy1/uplift.gif
A new paper was written in 1998 and that is now the basis for the MODELED post-glacial rebound equation used by NOAA/NASA
This is the paper:
Near-field hydro-isostasy: the implementation of a revised sea-level equation (The authors have the art of Bafflegab down pat and do a pretty good run-on sentence too.)
Had some fun today..
Was walking along the beachfront and this obvious greenie was looking at the rock shelf that had been exposed by the heavy swells over the last week..
He said something about “climate change” causing it..
so I replied.. “yes, the sand is usually much higher than that.” 😉
poor guy didn’t know how to respond 🙂
Bad boy Andy, go lie down…. (snicker)
That Nat Geo graph says basically – anything can happen in the next 85 years. What’s the point of that? Is it meant to show that years of accumulated ignorance have been unable to reveal to us how sea level will progress in the future?