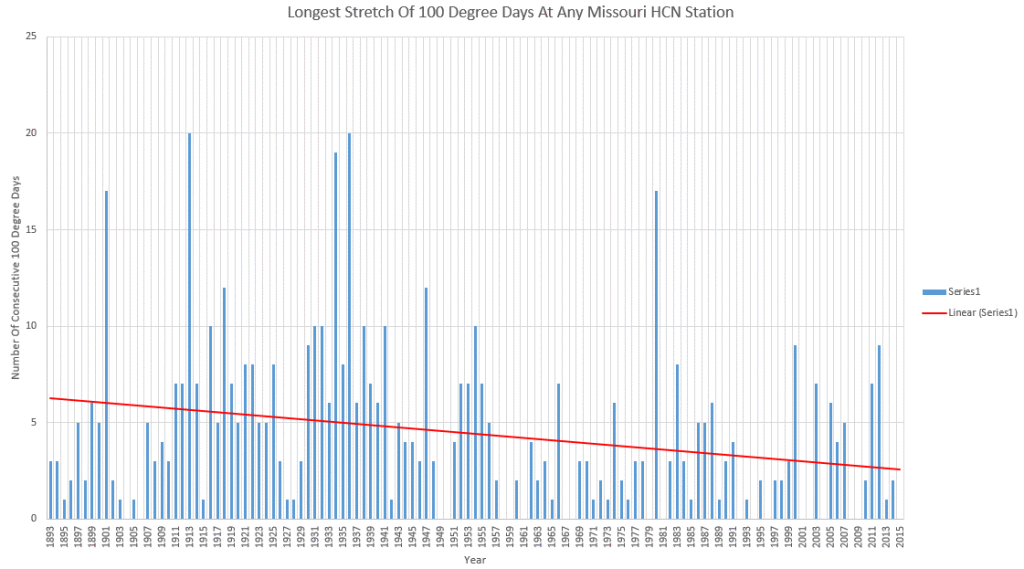
The last time Missouri had a 10 day heatwave of 100 degrees was 1980, when CO2 was below 350 PPM. The average 100 degree heatwave length is now less than three days, compared to six days a century ago. In 1913 and 1936, Clinton and Appleton Missouri had 20 consecutive days over 100 degrees.
Missouri has had no 100 degree days for two years. Experts say heatwaves are getting worse, because they are paid to lie to push the White House agenda.


Very good information!
Tallbloke’s Talkshop linked to this blog post which posits a formula for determining lapse rate: http://newmars.com/forums/viewtopic.php?pid=121411#p121411
It appears to be worthy of a closer look. A formula that has nothing to do with greenhouse gases, but gravity and speed of sound enter the equation.
Thank you, Steven aka Tony, for using your talents for the benefit of a deeply troubled society. The challenge ahead is to peacefully end government deception of the public without inflicting more damage by panic collapse of social and economic structures.
Perhaps the Ice-Age Scaremongers had it right all along… the data points towards longer-term (decades) cooling; or even an excursion towards Maunder Minimum-like climate conditions.
Does anyone have an idea of how and if GATA relates to an empirically known value for the transition to a full-scale glaciation ice-age? I’ve asked the question a number of times and I’m just curious. Seems the climate (so-called) scientists guesstimate that a 2 deg C rise in GATA is just bad, bad, bad. What about 1.85 C? Anyhow, back to my question; does anyone have a GATA number on the minus side for bad, bad. bad resulting in mile-high ice covering New York City?
Incidentally, no one has ever had an answer for my glaciation number. And I ask the question in all sincerity. I just don’t know.
But if I knew that number, say it was an anomaly of 5 degrees C from current average GATA; then I’d know we have minus 5 to plus 2, or a seven degree window of survivability for large-scale human life to exist on this planet.
Do we know the numbers of the survivability window?
I am highly suspicious of the +2 degree number. First off, I don’t think we’ll hit it. Second, if we do I don’t think it would necessarily be a bad thing.
Peak temperatures in North America have been difficult to find recently. In Canada, I use 32 degrees as a benchmark. Taking Toronto as an example, there has been 1 day that hit 32 in the last 2 years. There were 12 in July of 1916 alone. The Weather Network, which has become a serious GW propaganda outlet, has taken to referring to 30 as “searing” heat.
During 1936, Toronto had 3 straight days of 105 (F). I think that is at least 40 (C). What has Toronto’s highest temperature been during recent years?
Those 3 days in July 1936 were the hottest ever in Toronto but that month was, in terms of average temperature (22.9) and in terms of days 32 or more (7), not in the top 10. I have a few graphs related to this posted at https://www.facebook.com/realclimatedata, go to the photo album “Toronto Climate History”.
Reblogged this on Climate Collections.