
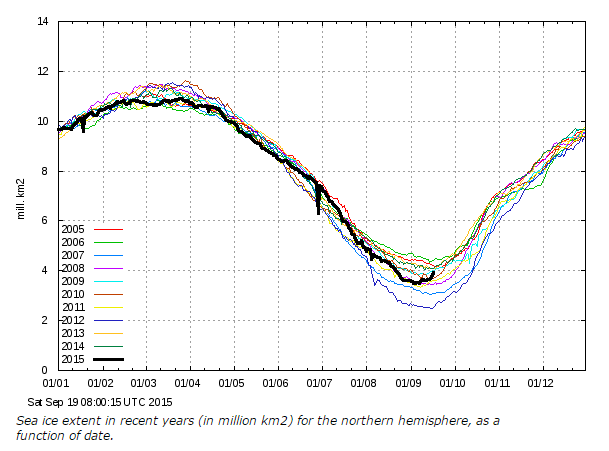
The Arctic is blowing away all records for sea ice growth this September, after a record short melt season. Over the past two weeks, half a million km² of new ice has formed, during a time when ice is normally being lost.
The climate criminals at government funded agencies will of course not report this information, because it trashes Barack Obama’s energy infrastructure wrecking agenda.

“Ahhh CRAP!” Says the alarmists because this does not bode well for Paris or their argument. “Ahhhh Crap!” says this skeptic and truck driver also because it makes me wonder about my winter driving to come.
Meanwhile, out in reality, we are about to see the arctic sea ice extent anomaly get larger. For those skeptics that don’t understand the terminology or what is actually happening, despite this headline and misleading article, arctic sea ice extent is more than 1.4M sq kms below average for this time of year. That number is likely to grow in the upcoming weeks meaning that the anomaly will grow to maybe 1.5M sq kms or 1.6M sq kms or maybe even more.
The reason is that everywhere except the arctic basin the water temps are above average and above freezing, which tends to bode ill for ice formation.
But feel good about accepting this article despite the likelihood that in the near future we are going to move even further away from the average for this time of year
For those troglodytes that ignore the Earth’s history…
The current Arctic sea ice levels are well above the levels of most of the first 3/4 of the Holocene.
The only reason that Arctic sea ice levels are so high is that we haven’t really climbed that much out of the coldest period in the last 10,000 years, the LIA.
But you go ahead and keep ignoring history and basing your ABJECT FEAR and PANIC on a tiny period of warming, a tiny natural bump in temperatures.
So the article is accurate, and true and factual but misleading because “Koop” knows what will happen in the future. Got it.
Chicken-coop has shown he has never met Jack-S**t
I see YOUR “reality”! Last year the fact that Antarctic sea ice extent was setting new records in the satellite era which drove the global sea ice extent well above the mean did not matter. But all of a sudden NOW that Antarctic sea ice extent is below the mean (but still within 2 standard deviations of it) and the Arctic is melt near it’s low for the year, the global sea ice anomaly as primarily effected by less ice in the Antarctic is vastly important and indicative of Global Warming. Yep, that would be a true believers “reality”. As if transient sea ice which in every way, volume, extent, age of ice, etc is dependent on currents and storms and winds and such, and not just temperatures of the water or air is the REAL indicator of where the climate is going.
And never mind that RSS and UAH STILL show no significant warming in the lower troposphere that was supposed to be burning up with a hot spot long ago despite the fact of a pretty strong El Nino.
And THAT is a question you should be asking. Why? Why is neither RSS or UAH showing anything close to the warming that was recorded during the 1998-1999 El Nino despite the fact that ENSO topped out recently near 1998 levels? Could it be because the earth is generally in a cooling mode? NA! NEVER! Right!
Now go work on that little problem for awhile. And be sure to ignore the FACT that right now as I write this this solar cycle 24 shows the lowest solar activity seen since solar cycle 14 in 1906! And that is using NASAs system which uses much superior optics compared to the 40 mm base used. If one goes the 40mm base optics that had back then the actual sun spot count now is around where it was during the Dalton minimum.
What is happening right now is residual heat in the largest ocean is being released through the current El Nino but there isn’t as much as there was before and thus the much lower spike as shown in the RSS and UAH. Meanwhile in the next largest ocean it appears that the AMO is turning negative. IOW the residual heat in the Atlantic from the last solar era of solar maximums is gone and that in the Pacific is right now being released. And when that done, here comes a cold earth like nobody alive to today has every experienced.
IF as predicted by NASA the next solar cycle is as muted or even less active than the current one, then no words from anyone will keep the AGW scam alive!
But that is just the opinion of a dumb ass truck driver that least has the intelligence to know that when you turn the thermostat up during the winter and the furnace is working the temperature in your house goes up. And when you turn it down the temp is eventually going down no matter how much insulation you have in your abode. And understanding THAT simple fact puts me miles ahead of a heck of a lot of “climate scientists” after having read their “work” on AGW and Climate change which does not give the furnace it’s due.
Looks like Dr Evan’s prediction agrees with you RAH.
The ClimAstrologists and scaming Banksters and lying Politicians must be really freaking out hoping to get a binding treaty and their global government in place before the 200 year de Vries cycle knocks their theory completely out of the ring.
https://upload.wikimedia.org/wikipedia/commons/thumb/d/d0/Bellows_George_Dempsey_and_Firpo_1924.jpg/737px-Bellows_George_Dempsey_and_Firpo_1924.jpg
“so the cooling is likely to start in 2004 + 13 = 2017”
Which is why the UTTER PANIC to get some totalitarian UN government in this year !
https://3.bp.blogspot.com/-7BTnRqeqVxo/Usw2ugazZ8I/AAAAAAAA2Vw/Up68eQgj6Aw/s320/mother_nature_denies_global_warming.jpg
Finally, we are witnessing the pivotal point, that destroys every Arctic warming Prediction! There is a limit as to how long data can be bent by warmists ; we are now close to that point in time.
The cyclical pivot point is inevitable, I hope your call is correct because we do not need more government meddling in the energy economy.
As for there being a limit to data being bent by warmists, I doubt it. If they were sensitive to the truth the tune would have changed by now. A massive turn to cold MIGHT lower their recruits below replacement level. As long as the bucks can be printed up to pay them, there will be warmists doing what they do, at least for my lifetime.
In the next several years when we set a new record low in recorded history for the arctic sea ice extent do you think that you are likely to admit that you are wrong or do you already know what excuse you’ll have for saying why the globe isn’t really warming?
Will you then comeback to this article and be made at Steven for so thoroughly misleading you?
Here’s a good gentlemanly wager that can show you what I mean. This article states that there is record sea ice growth in the arctic. Somebody might read that and think that because we are actually below average in sea ice extent that we would be getting closer to the average for this time of year in the next several weeks. The arctic sea ice extent (via the folks at Cryosphere) is usually 4.818M sq kms. We are currently at 3.393M sq kms. For an anomaly of 1.425M sq kms.
So what do you think? Will that 1.425M sq kms figure go up or down in the next several weeks? My guess is that it will go up meaning that despite Goddard saying “record sea ice growth”, in the next several weeks we will sink even further below the average for this time of year. Time will tell, of course, but my layman’s interpretation of the data seems to be pointing in that direction
“In the next several years when we set a new record low in recorded history for the arctic sea ice extent”
ROFLMAO.. your ignorance proceeds you. !
The historic low is basically ZERO Arctic sea ice through much of the first 3/4 of the Holocene.
When will you stop trying mislead people with your ignorance. !!
Unfortunately the Arctic sea ice level has bottomed out (day 251) and is now heading back up.
The people living up there could really benefit from a return to the near zero levels of open summer Arctic seas from the first 3/4 of the Holocene
You are calling other people ignorant and you resort to name calling and you don’t seem to even understand what “recorded history” means.
So, go ahead and look it up and then respond back and let everyone know whether you still think the Holocene is part of the time frame of what is known as “recorded history”.
Also, care to actually address my prediction that the arctic sea ice extent anomaly will actually increase in the coming weeks? Would you agree that if that happens it makes this article rather silly and misleading?
Recorded history.. roflmao
You want to start in 1979 to display your ignorance..
Keep digging, fool !!
Here is a better wager.
Is the Earth going to descend into a full blown glaciation or is it going to bump along just above glacial inception giving the human race one heck of a ride?
This threshold region is described as a climatic “madhouse”! by Neuman and Hearty (1996)
“The lesson from the last interglacial “greenhouse” in the Bahamas is that the closing of that interval brought sea-level changes that were rapid and extreme. This has prompted the remark that between the greenhouse and the icehouse lies a climatic “madhouse”!
Rapid Sea-level Changes at the Close of the Last Interglacial (substage_5e) Recorded in Bahamian Island Geology
The time between the two precession peaks of MIS11 (a possible Holocene analog) was such a climatic “madhouse” The true discussion about climate is among Quaternary Scientists over whether or not the Holocene will go long as MIS11 did or if it will head in to glaciation very shortly.
The Holocene interglacial is now 11,717 years old. That’s two centuries or so beyond half the present precession cycle (or 23,000/2=11,500). So the little Ice Age was about the right time for glacial inception. However we had the Modern Grand Solar Minimum, the strongest in 3000 years – Evidence for distinct modes of solar activity
Cycle 24 was rather quiet and Cycle 25 is expected to be dead. So if Dr Evan’s Solar Notch-Delay theory is correct, in the next 5 to 15 years the earth should see a major drop in temperature. This time without another Grand Solar Minimum to pull the earth out of the decline we could be looking at the “climatic madhouse.”
Of course if the idiot elite have their way and stifle energy we will also see Ted Turner population decline of about 95%.
To: Koop in VA – I believe Andy & Gail have explained it well. Also Steve’s statement “record sea Ice growth” is factual because the rate change increase is greater than anything in recorded history. ( not just the Arctic, probably for planet earth ).
…
On the issue of coming back, when someone is misleading you ? We would like to see you back in a few years, when this AGW is obsolete due to real Cooling ; will we see you returning with an apology… no… it will be a vanishing act with no accountability.
I hear you. You are probably a sincere believer that the science is either wrong or is a hoax. I’m not in the field and so I tend to accept what experts say unless it can be proven by other experts that they are wrong or that they are perpetrating a hoax. Neither has happened to my satisfaction and so I go where the experts lead me.
But within 5 years I’m guessing that we will see a new record high global mean temp (that’s an easy prediction to make and it will likely be this year) and we will likely also break the low arctic sea ice extent record. And sadly, Andy will likely quote something about the Holocene and others will either say it remains a hoax, the data is wrong or even if it isn’t wrong, it is natural.
Be well. Keep an open mind. I’ll do the same.
Your mind is slammed shut from brain-washed ignorance..
Your every post tells us that.
“But within 5 years I’m guessing that we will see a new record high global mean temp ”
You know Gavin Schmidt well, do you. !
“and we will likely also break the low arctic sea ice extent record”
NO WE WON’T.
That record is ZERO, set many times in the first 3/4 or so of the Holocene.
The piddlingly small period you want to reference is meaningless and irrelevant to everyone except the PANIC meer-chants
Koop in VA says:
“…..I tend to accept what experts say unless it can be proven by other experts that they are wrong or that they are perpetrating a hoax. Neither has happened to my satisfaction and so I go where the experts lead me.”
>>>>>>>>>>>
Here you go Koop
How Many Scientists Fabricate and Falsify Research? A Systematic Review and Meta-Analysis of Survey Data
US scientists significantly more likely to publish fake research, study finds
The FDA Underreports Scientific Misconduct In Peer-Reviewed Articles
FDA says CRO Cetero faked trial data; pharmas may need to redo tests
Now don’t you feel safe with the FDA watching over you? I certainly don’t!
Why Most Published Research Findings Are False
Information Warfare: The Golden Age Of Artful Dodging
Here is more:
Just peer-review your own papers…
Retraction of articles from Springer journals: Springer confirms that 64 articles are being retracted from 10 Springer subscription journals, after editorial checks spotted fake email addresses, and subsequent internal investigations uncovered fabricated peer review reports. After a thorough investigation we have strong reason to believe that the peer review process on these 64 articles was compromised….
“Peer review is sick and collapsing under its own weight,”
Unreliable research, Trouble at the lab: Scientists like to think of science as self-correcting. To an alarming degree, it is not
SAGE Publications busts “peer review and citation ring,” 60 papers retracted
Use of ‘language of deceit’ betrays scientific fraud
Publishers withdraw more than 120 gibberish papers
The reputation of science as honest has been throughly trashed. Papers going against the prevailing bias are going to be vigorously vetting and therefore much more likely to be true than papers that support the political agenda of the day.
Actually papers going against the political agenda of the day are going to have a heck of a lot more trouble getting published. As Phil Jonessaid: “We’ll keep them out somehow, even if we have to redefine what peer review is!” … referring to keeping skeptical papers out of journals.
There is much else in the Congressional Record Volume 157, Number 188 (Thursday, December 8, 2011)
The fact that CAGW was not dead and buried 6 years ago after Climategate broke says there is a heck of political leverage involved, not to mention a lot of money to be made.
>>>>>>>>>>>>>>>>>>>>>>>
“We’ve got to ride this global warming issue. Even if the theory of global warming is wrong, we will be doing the right thing in terms of economic and environmental policy.”
– Ex-SenatorTimothy Wirth, President of the UN Foundation.
“No matter if the science of global warming is all phony… climate change provides the greatest opportunity to bring about justice and equality in the world.”
– Christine Stewart, former Canadian Minister of the Environment.
“The only way to get our society to truly change is to frighten people with the possibility of a catastrophe.”
– Daniel Botkin, emeritus professor.
“This is the first time in the history of mankind that we are setting ourselves the task of intentionally, within a defined period of time, to change the economic development model that has been reigning for at least 150 years, since the Industrial Revolution… Democracy is a poor political system for fighting global warming. Communist China, is the best model.”
– Christiana Figueres, the UN’s executive secretary of the Framework Convention on Climate Change
Eeeek! A hockey stick!
YOIKS. And all that cold is poised to come down here to where I live on my little mountain in NY. Just began putting away a winter’s supply of firewood which is huge.
Anyone who follows this matter, or rather any skeptic who follows it, just knows (somehow) there is some “reasons” being worked up somewhere, to “explain” why a rebound in arctic sea ice doesn’t mean anything.
Yes just like a frozen Potomac meant nothing to those warning of dangerous warming within sight of it this spring.
If a mile high glacier was sitting on Washington DC, hundreds of miles south of the Wisconsin terminal moraine, Obama & company would STILL claim Gore Bull Warbling.
It truly doesn’t mean anything because a one or two week spurt of “record ice growth” is really meaningless. Just as a week or two of record ice melt is pretty meaningless. It’s the overall trend.
For example, this article is written to give you skeptics a mental boost and to mislead you. But when, as is likely, the sea ice extent dips even further down below the average for this time of year, you likely won’t see an article here showing that.
So, once again I’ll point out that the sea ice extent anomaly is currently at 1.425M sq kms. My guess is that in the next several weeks it will go beyond 1.5M sq kms which will make this whole article pretty meaningless, right?
The overall trend from the cold of 1979 is also MEANINGLESS.
The level of Arctic sea ice is still anomalously high because we haven’t ever fully recovered from the LIA.
WAKE UP and LEARN .. FFS !!
So here’s a question for you. Let’s say that pre-industrial CO2 levels were 290 ppm. If we reduced CO2 levels by 290 ppm you would agree that basically life as we know it would be wiped out, right?
So let’s say you increase CO2 levels by 290 ppm. What do you think the repercussions would be? How much warmer do you think it will get?
The point being all too many skeptics rely on the argument that CO2 is a trace gas and seem to make the argument that changing a trace gas level would have virtually no impact on global temps. But while they might agree that removing 290 ppm would be absolutely catastrophic they don’t seem to think that major changes would happen if we add 290 ppm. It’s inconsistent to say the least.
BTW, is your argument that we are heading into a period of natural warming? Wouldn’t that make warming due to increased CO2 even worse?
Koop in VA,
That’s an astonishing argument you made there:
Removing all CO2 from the atmosphere would be catastrophic to life on Earth because all photosynthesis would stop, therefore doubling the atmospheric concentrations of CO2 must lead to major changes in the Earth’s temperature.
I urge you write a paper on this photosynthetic forcing. Climate science has grown boring and dull lately. The world needs something truly radical to get excited about global warming again.
OMG. your ignorance astounds !!
CO2 at 250 or below is manifestly dangerous to all life on Earth, because a lot of photosynthesis stops.. NO FOOD.
Levels up to 1000ppm+ are totally and absolutely beneficial to all life on Earth.
Did you know, that here is absolutely no CO2 warming signature in the whole of the satellite temperature data. Bet you didn’t, because you are a brain-washed, ignorant, propaganda swilling twerp.
Badly worded.. correction required.
Levels of 1000ppm and above are totally and absolutely beneficial to all life on Earth.
https://wattsupwiththat.files.wordpress.com/2010/03/heating_effect_of_co2.png?w=720
This graphic shows carbon dioxide’s contribution to the whole greenhouse effect
https://wattsupwiththat.files.wordpress.com/2010/03/co2_modtrans_img2.png?w=720
From the IPCC
https://wattsupwiththat.files.wordpress.com/2014/08/clip_image002_thumb3.jpg
So CO2 has pretty much shot its wad in the first 200 ppm and the effect falls off rapidly from there.
But it gets WORSE!
Dr. Happer’s major new contribution to science was refining the size of the CO2 absorption wave band.
The take away from his UNC lecture was the present CO2 ‘modeling’ is a mish-mash of theoretical equations and experimentally derived data. Where the Climate alarmists missed the boat is in using equations for ‘line broadening’ aka the ‘wings’ where the additional CO2 absorption ( at 400 ppm) is supposedly taking place. These equations produce results that do not match up to the experimental data. The lines are not as broad as theory would have it. as his Slide 22 says
Lorentzian line shape nor Voigt line shapes are correct in the far wings!
This means you take the log curveshowed above and squash it even flatter at 400 ppm and above. This means the CO2 sensitivity is much smaller than calculated by the IPCC.
David Burton put up an audio video and slides of Dr Happer’s presentation at this. link
SLIDES: link
Slides 16, 22, 42, 43 and 44 are the critical slides.
You can get useful background for the physics in these comments from WIKI .
SUBJECTS:
Mössbauer effect< (recoil energy lost during absorption <===CRITICAL)
The Pound–Rebka experiment (VERY IMPORTANT because gases are moving randomly and in random directions)
Motional narrowing
Voigt effect
And WORSE….
Paraphrasing Dr. Brown (physicist Duke Univ.)
What is the absorption cross-section for a 15 micron photon?
That’s the effective surface area intercepted by each CO_2 molecule. It is large enough that the mean free path of LWIR photons in the pressure-broadened absorption bands of CO_2 in the lower atmosphere is in the order of a meter. That means that LWIR photons — whatever their “size” — with frequencies in the band go no more than a meter or few before they are absorbed by a CO_2 molecule.
When CO2 near the earth’s surface absorbs back radiation, the lifetime of the excited state caused by the absorption of the photon is much longer than the mean free time between molecular collisions between the CO_2 molecule and other molecules in the surrounding gas. That means that the radiative energy absorbed by the molecule is almost never resonantly re-emitted, it is transferred to the surrounding gas, warming not just the CO_2 but the oxygen, nitrogen, water vapor, argon as well as the other CO_2 molecules around.
In other words near the surface back radiation, aka a ‘resonantly re-emitted’ photon is a RARE EVENT.
Dr Happer in his lecture agreed and further stated that the time to radiate is about ten times slower than the time to the next collision in the troposphere. Dr Happer in his lecture also answered my question about where CO2 energy is radiated instead of being handed off via collision. Experimental data shows barely any radiation at 11 KM and that radiating is in the stratosphere ~ 47 KM above the surface.
Dr Happer’s information is illustrated by this image the Warmists use to say ozone is a greenhouse gas. The Figure is from Uherek, 2006. They even say it “show how carbon dioxide is cooling the stratosphere.” The black dotted line is the tropopause and you can see water is dumping energy just under the tropopause (the pink splotches surrounded by dark blue) while CO2 is dumping energy from just above the tropopause and up (the big yellow streak on the left) just as Dr. Happer, Dr Brown and the Camel stated. Ozone is the smaller yellow streak on the right.
The legend with the illustration:
What is NOT mentions is that is where CO2 is active and NOT in the troposphere at least not below 11 KM where it barely starts radiating.
http://www2.sunysuffolk.edu/mandias/global_warming/images/stratospheric_cooling.jpg
Too much information for the chicken coop, Gail.
Doubt he will ever read it, let alone understand it.
But others will read it……… drip, drip 😉
And then there are the out right LIES!
http://tamaracksheep.com/images/Global%20warming/global%20warming_clip_image001_0001.jpg
Callender cherry picked low values for the pre-industrial era. CO2 was never as low as the ClimAstrologists now state. What is really really interesting is the Barrow Alaska 1947-1948 data at 420 ppm! (average of 330 samples)
http://www.biomind.de/realCO2/bilder/CO2back1826-1960eorevk.jpg
Notice the major spike in the 1930-1940s when the temperatures were much higher than today. This would be expected because as the oceans warm they outgas CO2.
ICE CORE readings give false lows.
(Try leaving a 2 liter bottle of Pepsi in the closet unopened for a year and see just how fast the CO2 migrates through the plastic!)
Stomata data from fossil plants by Wagner, Aaby and Visscher prove conclusively that the ice core data is seriously in error.
http://www.pnas.org/content/99/19/12011.full.pdf
As Lucy Skywalker says “This may well be Jaworowski’s best paper. It is pure detailed science “ The paper is actually by Z Jaworowski, T V Segalstad, & N Ono. It gives the earlier ice core data by location, age, ppm and authors. It discusses the different methods used for analysis.
Note this is not Jaworowski ‘opinion’ rather it is a survey of the field. With a good library it would be possible to dig out all the papers referenced.
I ran across a reference recently where it was stated: ” ” .. Air bubbles trapped in polar ice sheets reveal the composition of the atmosphere of the past….” The idea of using the whole sample and not just the air bubble has now vanished. (I can possible dig out the paper… maybe.)
Back-up papers that show air bubbles in ice do not represent the actual composition of ancient air.
First ‘‘in situ’’ determination of gas transport coefficients
(DO2 , DAr , and DN2 ) from bulk gas concentration measurements (O2, N2, Ar) in natural sea ice
The paper is dealing with landfast sea ice but does look at the diffusion and transport coefficients.
Also this paper
The hydrochemistry of Lake Vostok and the potential for life in Antarctic subglacial lakes
“is your argument that we are heading into a period of natural warming”
NO. Moron.
The period of natural warming from the series of strong solar cycles in the latter half of last century has/is coming to an END…
We are heading into a period of natural cooling !!
Tony,
When I clicked the link from Danish sea ice et al, I get a disclaimer at the bottom of the page that they had previously blocked out coastal zones thereby underestimating sea ice extent.
http://arctic.atmos.uiuc.edu/cryosphere/IMAGES/seaice.recent.antarctic.png
Now that the Antarctic sea ice is declining rapidly is this a sign of global cooling ?
We know that global warming makes the sea ice extend bigger (at least that’s what they told us )
https://www.skepticalscience.com/increasing-Antarctic-Southern-sea-ice-intermediate.htm
Wouldn’t it be hilarious if the 2015 line was above all the others come December. 🙂
Popcorn, anyone?
Oh yes lets hope so. Not that it will mater since NASA and NOAA lie like a rug and so does the MSM.
Oh yes, it was a very bad week for skeptics you know! That is just one of the stupid ignorant stories floating around because of a single paper applying a statistical methodology never used before in climate science to try and make the hiatus go away. Sometimes I think that the skeptic blogs and CFACT are just being bombarded with total BS to keep them busy trying to clean up the messes instead of going on the offensive as strongly as they could.
And because of the call for RICO criminal investigation of companies the alarmist “think” might be funding skeptics. No probable cause required you know.
Now I gotta shut down. Heading to MA with a load at 01:30. See you all Tuesday night if things go without a hitch (improbable with this load).
Wouldn’t it be funny if, come December, it wasn’t any where close to that you looked back on this article and said that it was a pretty dumb article given the overall status of the arctic sea ice extent?
The overall status of Arctic sea ice level is that it much, much higher than for most of the rest of the Holocene,
Except of course for the brief climb out of the LIA.
Go to Siberia if you think the LIA was “better”, moron !!
Hey Koop?
If melting ice is such a catastrophe, why are you hoping against hope for a resumption of the downtrend?
Fair enough question but it is really pretty simple. We are in an era when AGW isn’t being adequately addressed. I would like to think that most of my fellow “conservative” brethren are actually persuadable by facts and so in some ways I want to see a record high global mean temp or record low arctic sea ice extent so that some of the skeptics that came this way via their political philosophies would finally understand that we don’t have to deny science simply because other conservatives say to do so. We can look at the data and say, oh, this is actually real, what do we do?
We can accept the science and then instead of supporting a big government approach we can support a more free market based approach.
Anyway, once we get in the era where we accept the science and are addressing the issue, I will then, of course, want to see our approaches working.
For the record, while I have historically self-identified as conservative I tend to say “conservative” nowadays because I probably don’t have much in common with my fellow “conservatives” even though I’ve been a registered Republican since 1989. So take my self-identification with a grain of salt.
“We can accept the science ”
BUT YOU DON’T.. you ignore it and listen to the alarmista rhetoric instead.
“So take my self-identification with a grain of salt.”
So do we.. I assure you !!
“We can accept the science ”
OK accept the science that Arctic sea ice as currently anomalously high and that CO2 has no impact on global temperatures and is in fact the one of the main atmospheric gases that the whole world relies on for food.
This STUPID, ANTI-SCIENTIFIC, ANTI-CO2 CRAP has to stop. !!
Thankfully China, India, Turkey, Poland, South Africa and many other developing nations are not going to bend to the anti-CO2 agenda.
Hence atmospheric CO2 will continue to climb, to the benefit of all life on Earth.
“We are in an era when AGW doesn’t exist.. Why should we address it.
There is absolutely no CO2 warming signature in any satellite temperature record.
There is absolutely no acceleration of sea level rise
We are in fact still very much in a cooler period of the Holocene.
Here, listen to a real scientist, as opposed to political agenda fraudsters
https://vimeo.com/14366077
Koop says, “…. I want to see a record high global mean temp or record low arctic sea ice extent so that some of the skeptics that came this way via their political philosophies would finally understand that we don’t have to deny science simply because other conservatives say to do so. We can look at the data and say, oh, this is actually real, what do we do?….”
No Koop we do not deny science™ we defend it. Saying we ” deny science™” is just tossing mud and hoping it will shut down debate. If you weren’t going to radically transform society into a miserable totalitarian hell hole I would allow you your fantasies. But the fantasies are not harmless. The goal is the complete destruction of the middle class and a return to serfdom for the masses.
On another board, someone challenged ‘Science Deniers’ to take a quiz with about 30 questions. I missed only one question but found many many of the questions were misleading or outright false. I aced the test because I ‘knew the right answers’ I also knew WHY those questions were false or misleading at best. They could not believe, I could understand ‘The Science ™’ and still refute it.
The scientific knowledge at that believers board was unbelievably scanty. The idiots didn’t know the oceans are alkaline. They didn’t know what the heck a buffer is much less that the oceans are highly buffered by calcium Ca++ and magnesium Mg++. When I tried to explain this I got “You do not UNDERSTAND THE SCIENCE™!” Good grief, I am a chemist and have spent years titrating acid and base solutions, some of which were highly buffered by several different organic chemicals.
http://blogs.essex.ac.uk/careers/files/2012/08/BrickWall-150×150.jpg
Yes Gail,
Chicken coop has shown us, yet again, the general ignorance of the climate groupie.
Also the absolute brain-washing against accepting any actual facts of the matter.
Artic sea ice is definitely on the increase toward the northern winter. Early.
It bottomed out on day 251, remained just above for a few days, and now seems to be heading upward.
https://sunshinehours.files.wordpress.com/2015/09/arctic_sea_ice_extent_zoomed_2015_day_261_1981-2010.png
Volume is the real measure, stay tuned for PIOMAS September and CryoSat-2 in the winter. The “recovery” has stalled.
The “recovery” to MWP temperatures?
https://media2.stickersmalin.com/produit/100/stickers-devil-smile-R1-143760-2.png
Yep, unfortunate.
cfnt will be able to enjoy the cold still..
where do you choose to live, cfnt (region will do)
I bet its somewhere warmer than frozen solid. !!.
Arctic Sea Ice Concentration
http://home.comcast.net/~ewerme/wuwt/cryo_latest_small.jpg
Arctic Sea Ice Concentration – Same Date Compared With 2007
http://home.comcast.net/~ewerme/wuwt/cryo_compare_small.jpg
Arctic Sea Ice Extent – 15% or greater
NSIDC
http://nsidc.org/data/seaice_index/images/daily_images/N_stddev_timeseries.png
Sea Ice is now within the 2 sigma limits. If it was an industrial process, you would say goo, leave it alone.
Arctic temp has dropped:
http://ocean.dmi.dk/arctic/meant80n.uk.php
RSS Northern Polar Temperature Lower Troposphere (TLT) – 1979 to Present
Peaked ~2010 and is starting to drop.
ftp://ftp.ssmi.com/msu/graphics/tlt/plots/rss_ts_channel_tlt_northern%20polar_land_and_sea_v03_3.png
RSS Southern Polar Temperature Lower Troposphere (TLT) – 1979 to Present
Peaked ~2010 and is starting to drop.
ftp://ftp.ssmi.com/msu/graphics/tlt/plots/rss_ts_channel_tlt_southern%20polar_land_and_sea_v03_3.png
Gail, You have to watch those inserted graphs.
Even though you cut from an up-to-date page, they can paste several months in arrears.
Its bizarre, no idea why they do it !
Andy,
Half the time the blasted graphs do not even appear on this old antique of mine. All I get is [IMAGE] GRRrrrr It just started happening too. Word UnImpressed must be fooling with the code again.
Paul shows that apart from 2010, Greenland temps are pretty much on par now than they were in the 1930’s, 40’s
https://notalotofpeopleknowthat.wordpress.com/2015/09/19/dmi-show-greenland-was-warmer-in-1930s/
NO CO2 warming signature.. just like in the satellite record.
The only data that shows “man” made warming is GISS and its stablemates, and that warming is for absolute certain “climate change” agenda driven.
Gail said “Sea Ice is now within the 2 sigma limits. If it was an industrial process, you would say goo, leave it alone.”
If it was just within 2 sigma limits but above the average would that make a difference to your thoughts on it’s significance ? 🙂
Andy
No of course not. (and goo = good BTW) The mean ± 2 sigma is just expected variation.
As Dr Deming said ‘Profound Knowledge’ is also needed. Since the oceans give four modes:
Atlantic + Pacific +
Atlantic + Pacific –
Atlantic – Pacific –
Atlantic – Pacific +
And the atmosphere has two modes meridional and zonal jets, the mean ± 2 sigma for all these combinations would have to be known and we just don’t have the data. We need at least 200 years (cycle IDed by Joan Feynman) before we would know if 2007 was ‘abnormal’ and that is not even getting into the fact it was a storm driving the ice out into the North Atlantic that caused the ‘melt’
Actually Andy, given the 2007 storm, you would have to consider the process as ‘reset’ and ONLY look at the data from 2007 to present. Is the sea Ice recovering? Yes, unfortunately. Cold is not good.
You mean the 2012 storm? 2007 was more warm sunny days and also warm southerly winds melting the ice AND compacting it, so double whammy. 2007 and 2012 were exceptional years, each time the Arctic minima “recovers” back to a more realistic value for minima. This is still declining though currently. It might go back in the future, we will have to see.
Andy
“each time the Arctic minima “recovers” back to a more realistic value for minima.”
You mean ZERO like for all but the COLDEST period of the current Holocene.. right !
Now that is a recovery that would be highly beneficial to the people trying to survive up there.
“The mean ± 2 sigma is just expected variation. ”
Actually, be more precise..
The ± 2 sigma value is the expected value for a very short period at the end of a short period of warming out of the coldest period of the last 10,000 years.
Even the instrumental period is based on a short period of the dip in the AMO.
Maybe, or not, intentionally cherry-picked, but certainly reality cherry-picked
https://notalotofpeopleknowthat.files.wordpress.com/2015/09/tsgcos-corr_-81-146-41-42-261-10-54-16.png
From the graph you can see why ALL alarmista Arctic rhetoric/tripe ABSOLUTELY MUST start in the late 1970’s !
Ignore anything except since then……. Right, Chicken Coop ??
Note that the Arctic sea ice is following the AMO quite well. Not surprising since it is water that does the melting.
Certainly the air temps up there aren’t going to cause much melting !
Who else is stating a record short melt season for the Arctic 2015 ? It’s just not the case.
According to JAXA the ice growth in last 2 weeks has been 250 000 km2 not 500 000 km2.
In 2012, the record minima the ice extent from the low was
3177455
3213910
3319816
3370214
3427076
So 250 000 in 4 days!
So nothing unusual. As all the plots tend to be same extent around Nov / Dec it means that the years with lower ice extent put on greater growth rates. That would seem sensible because the ice edge tends to be further north at the minima
Andy
Bottomed out a week or so earlier than any of the last several years except 2011. (Day 251)
And the current Arctic conditions seem to indicate it will grow fast.
It will be fun to watch if it does, especially the antics of the climate trolls such as yourself.
(or will you just crawl back under your bridge and sulk! 😉 )
I personally, would rather it recovered to times of the open Arctic seas in summer, like in the earlier Holocene, but that is just not going to happen.
When have I ever mentioned climate change on here being a cause ? Just interested in the Arctic changes.
JAXA has lowest as day 259, whatever the minima date is within the normal range, nothing to shout about either way.
Andy
There are many different ways of measuring..
As you say , this is all perfectly normal for the current “slightly warmer than the LIA” period.
“When have I ever mentioned climate change on here being a cause ?”
Sorry, but your posts are written in the style of a rabid brain-washed alarmista. !
I apologise if I am mistaken.
“Bottomed out a week or so earlier than any of the last several years except 2011. (Day 251)”
According to JAXA it looks like that in the last 10 years 4 years were earlier, 4 were later and one tied! Nothing spectacular this year either way.
Andy
Yep, nothing spectacular.. so why the PANICKED ALARMISM about Arctic sea ice..
Have you ever considered that question?
Its a NON-ISSUE !! … except to support the anti-CO2 agenda.
AndyG55 says: “Too much information for the chicken coop, Gail.”
Well Andy he is the one who said we ‘deny science™’……
(That is a statement that really makes me angry considering I have been fired more than once and finally black balled for refusing to change data.)
For my last contract, Stage 2 was “not continued” because the contractors didn’t like the results of stage 1.
Beauty is that we have the data analysis for stage one, and I doubt anyone else can continue the project without it.
(I can’t say what field this was in.. because of the political/employment situation 😉 )
Still.. plenty of other work at the moment. Too much actually, its coming into summer down here and the beach is looking very enticing.
“deny science™”, from what appears to be a low-end Arts failure. Quite funny !! 😉
Andy, It really would be funny if they weren’t bound and determined to completely wreck western civilization and forces into serf’s collars!
“This is the first time in the history of mankind that we are setting ourselves the task of intentionally, within a defined period of time, to change the economic development model that has been reigning for at least 150 years, since the Industrial Revolution… democracy is a poor political system for fighting global warming. Communist China is the best model.”
— Christiana Figueres, Executive Secretary of the UN Framework Convention on Climate Change
DEMOCIDE: Death by Government Dr. R.J. Rummel
Now tell me again Ms Figueres, why “democracy is a poor political system” and “Communist China is the best model.” And best for WHO? The elite?
Figueres only thinks she will be part of the elite.
Actually just a doormat !
About that 2007 sea ice loss…
NASA issued a press release explaining why Arctic sea ice loss was so great that year. (They were a bit more honest compared to now.)
NASA Examines Arctic Sea Ice Changes Leading to Record Low in 2007
In simple terms, polar wind patterns changed and blew sea ice further south to warmer waters than it normally would. Sea ice can easily be wind driven. This is why I mentioned a change in jet stream patterns as a factor.
“(They were a bit more honest compared to now.)”
Then Gavin and Karl appeared..
….now honesty is a thing of the past.
And OBUMMER, never forget Obummer and his War on America!