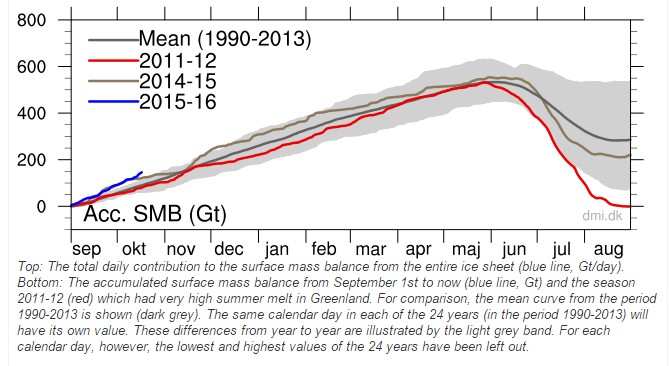
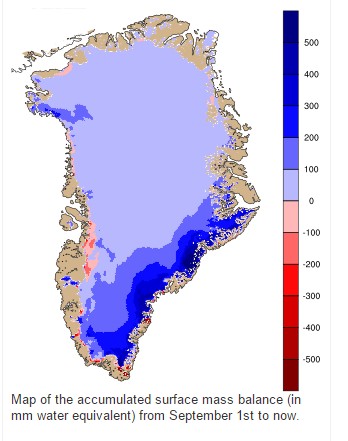
Greenland has gained 150 billion tons of snow and ice in the last six weeks, blowing away all previous records.
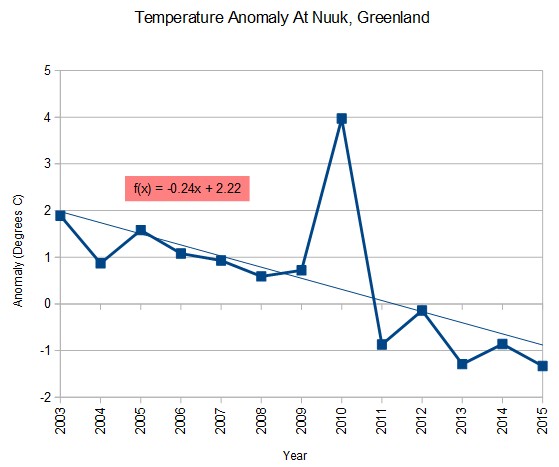
Temperatures in southwest Greenland have been dropping at a rate of 24°C per century since 2003.
US government climate experts say that Greenland is overheating and melting down, because they are criminals paid to lie to push Obama’s political agenda.


But But it stills shows brown along the rocky steep edges along the coasts! [sarc]. Just thought I’d beat some of the alarmists to it. It’s all the poor delusional types that claimed Greenland ice and snow was going melt away and come drown us all, have left when one talks about Greenland ice and snow.
Reblogged this on Canadian Climate Guy and commented:
Greenland, not so green!
Reblogged this on Climatism and commented:
The delegates on their #RoadToParis will be stoked about this news.
Those delegates are bringing their own data to their taxpayer funded 5 star hotels complete with foie gras and fine french wines. They have elevated spending other peoples money to an art form.
There is so much truth and irony in the point you’re making.
Why can’t these ‘climate change’ activists meet via low carbon technologies like Skype? Why do they have to spend other people’s money and carbon emissions, to talk about money and other people’s carbon emissions?
Answer: because Paris has *nothing* to do about the environment, rather controlling your ’emissions’ which control your life.
You are forgetting about all the fine Ladies of the Night flocking to gay Paris to entertain the delegates.
Reggie’s blowtorch ran out of Brawndo.
Dear Tony,
Greenland temperatures are indeed plummeting, they are not rising by all means, that’s for sure. And they may even be plummeting faster than official records show, because these temperatures are being measured at an airport that has seen more and more traffic over the years, so there could be a UHI effect, which is not being corrected for. But to be honest now, temperatures are plummeting, but they are not plummeting thast fast. You chose a high point as a start to your graph. This is more or less the same trick that the alarmists use a lot of times, They start their graph always at a low point and they end it at a high point. So please go back a few more years with your graph. If you could go back to the time of Eric the Red, the Medieval Warm Period, when Greenland was still green, the graph would show a steady decline. I still like you a lot, Tony, you’re a good man. .
“On January 4, 2008, a reversed-polarity sunspot appeared—and this signals the start of Solar Cycle 24,” says David Hathaway
The minimum to minimum from Solar Cycle 23 to Solar Cycle 24 was 12 years. 2015 -12 = 2003.
Tony’s graph looks at the 12 years from second Maximum to second Maximum. (Solar Cycle 23 was a double peak like Solar Cycle 24 BTW.)
http://vencoreweather.com/wp-content/uploads/2015/04/sunspot-numbers.png
Current image of the sun with relatively blank conditions; courtesy NASA/SDO
http://sdo.gsfc.nasa.gov/assets/img/latest/latest_1024_HMIIC.jpg
April 30, 2015 image of the sun with virtually blank conditions; courtesy NASA/SDO
http://vencoreweather.com/wp-content/uploads/2015/04/solar_image.jpg
So there’s a spike on the last six weeks, yet when you look at this chart of the whole year, you see the ice melt of the past 12 months is two standard deviations higher than the 1980-2010 average.
Reblogged this on 4timesayear's Blog.