The latest government fraud being pimped by the press is the NOAA Climate Extremes Index (CEI.) This is a completely fraudulent index designed to mask the recent lack of heat and other extreme weather in the US.
NOAA shows that the area of the US experiencing unusually hot summer afternoons has increased to record levels.
percentage of the United States with maximum temperatures much above normal.
U.S. Climate Extremes Index (CEI): Graph | National Centers for Environmental Information (NCEI)
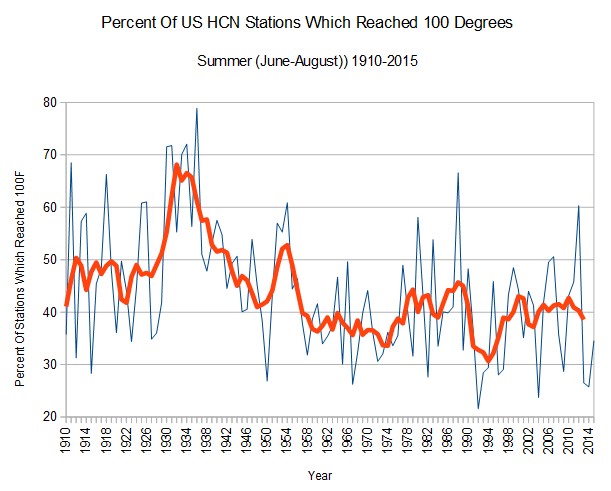
The actual NOAA data set shows the exact opposite. The area of the country reaching 100 degrees has plummeted to record lows. None of the published NOAA adjustments should have any impact on this metric. They have no excuses for this fraud.
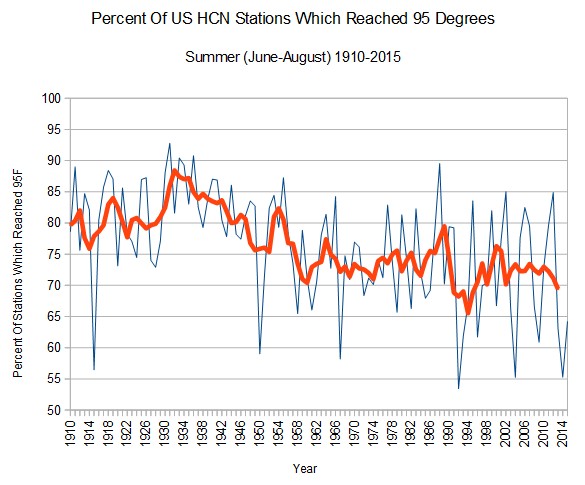
The same is true for 95 degree days. The area of the US reaching 95 degrees has also plummeted and near record lows.
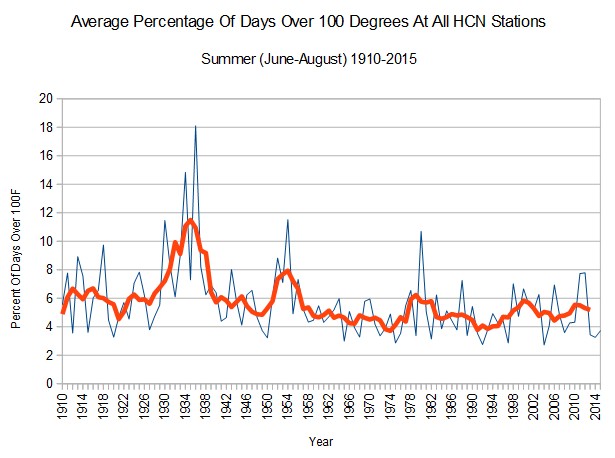
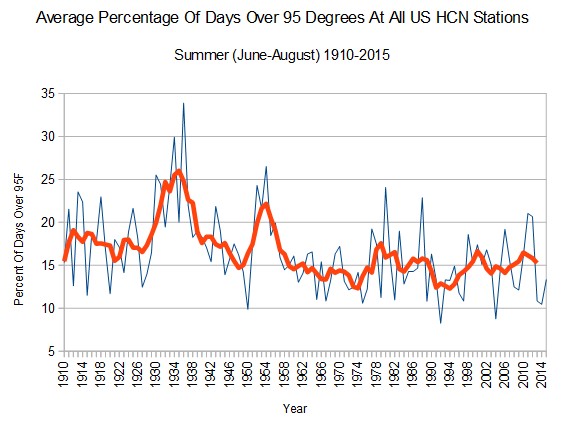
Not only has the area affected by hot weather plummeted, by the frequency of hot weather has also plummeted.
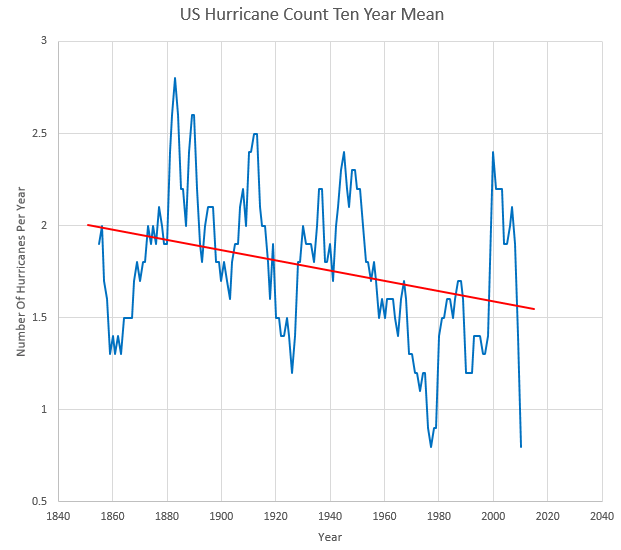
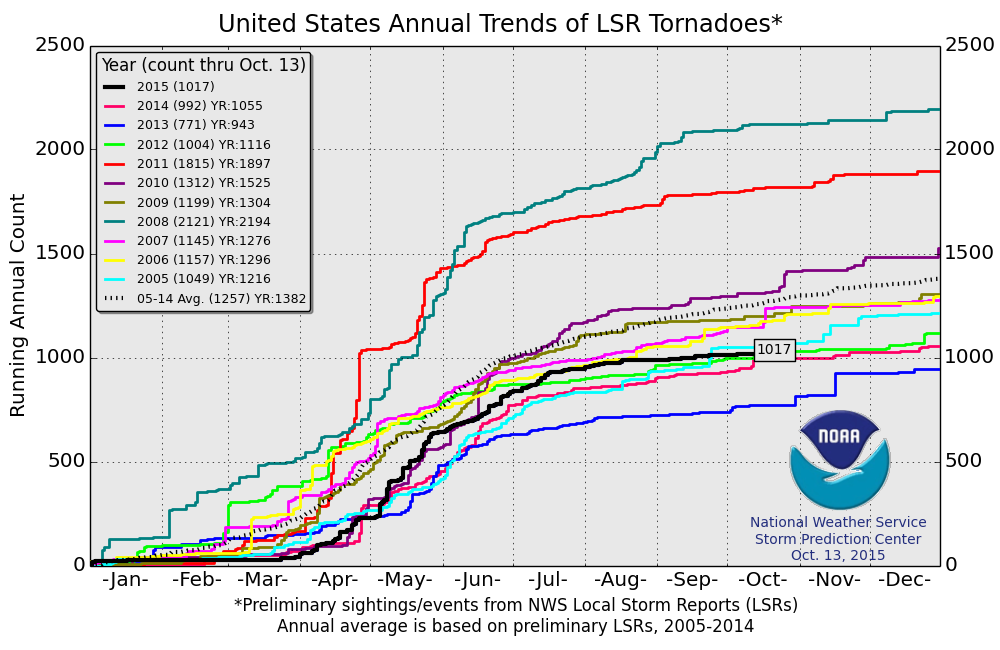
The US has been enjoying very mild summers with record low numbers of hurricanes and tornadoes, so NOAA simply made up a 100% fraudulent data set (CEI) to distract attention. NOAA (Department of Commerce) reports directly to Barack Obama.


Reblogged this on WeatherAction News.
Truly spectacular vigilance by this blog. Thank you.
If you haven’t seen it, I just saw this outstanding video from Anthony Watts from June, and Anthony really does an outstanding job in explaining the nuts and bolts of temperature measurement, and the bs manipulations. It is a quick and graphical presentation. Watch it, and then spread the word about the video into “the liberal realm” because it could change some opinions:
https://www.youtube.com/watch?v=pjlPvwRP-fM
Winters and summers in my neck of the woods [Milwaukee] seem to be more mild than they were decades ago.
I grew up in MKE, and had paper routes from the age of 12 through 17, and helped my brothers on their routes from the age of 10 or so. Which would mean 1967 through 1974. To this day, I have paper route dreams — “do 5, skip 1, do 4, skip 1 …”
And the frostbitten fingers, toes, and ears to show for it. We always had lots of variation in winters when I was a kid. There were years when Lake Michigan froze over, and there were years when you wondered where winter went. Same for summers. Usually hot and humid, but there were cold ones from time to time. Same goes for the level of the lake. Up and down.
You say the winters are milder? Where have you been for the last few years?
Tony, we have another 1000 yr flood story, this time for CA
http://www.latimes.com/local/california/la-me-mud-climate-20151017-story.html
This is hardly a “fraud” as even the NOAA data show extreme hot weather events in the 1930s. Who was saying that it was not hot then? It is already well known that there were more extreme hot days in the 1930s, for inland US data. That has already been noted. Nobody but some straw-man version of the NOAA. In fact if you dig deeper into the weather data no one was hiding the warm 1930s – or cold 1940s for that matter. And furthermore this hot weather data only addresses inland US stations. Why? because mean temperatures, including the 1930s, would not fit into the “fraud” narrative.
This is just another Steve Goddard style exaggeration of nothing much into a “conspiracy”.
Why isn’t this the best data set for the globe during that time period
How does NOAA define ‘much above normal’? It seems to be an inherently flexible term.
Don’t be concerned, it only feels like intercourse.
Muss es sein? Es muss sein!
https://www.youtube.com/watch?v=9f5GqmSAaeI
Reblogged this on Wolsten and commented:
In years to come researchers will look back at this invaluable archive and simply ask “How the hell did they get away with this for so long?”
Reblogged this on Climate Collections.