A combination of cold cloudy weather and thick ice limits the possibilities for further melting this summer. It is shaping up to be a total disaster for climate alarmists.
Two weeks ago, the fraudsters at NASA and the Canadian Government put out this wildly misleading press release.
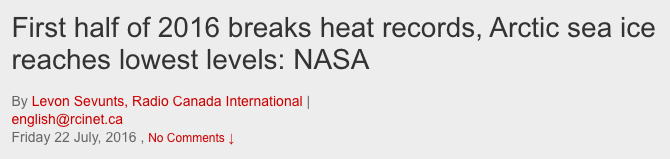
First half of 2016 breaks heat records, Arctic sea ice reaches lowest levels: NASA
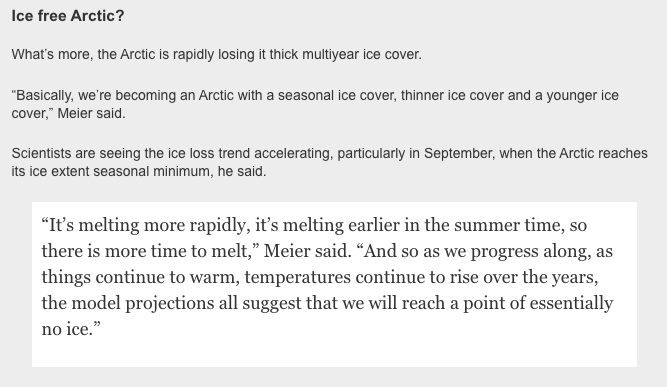
The exact opposite is occurring, The amount of old, thick ice has massively increased since experts declared it to be gone seven years ago, and Walt Meier is one of the people who altered the NSIDC maps to reduce the amount of five year old ice.
Meanwhile, the amount of ice in the Antarctic is also growing.
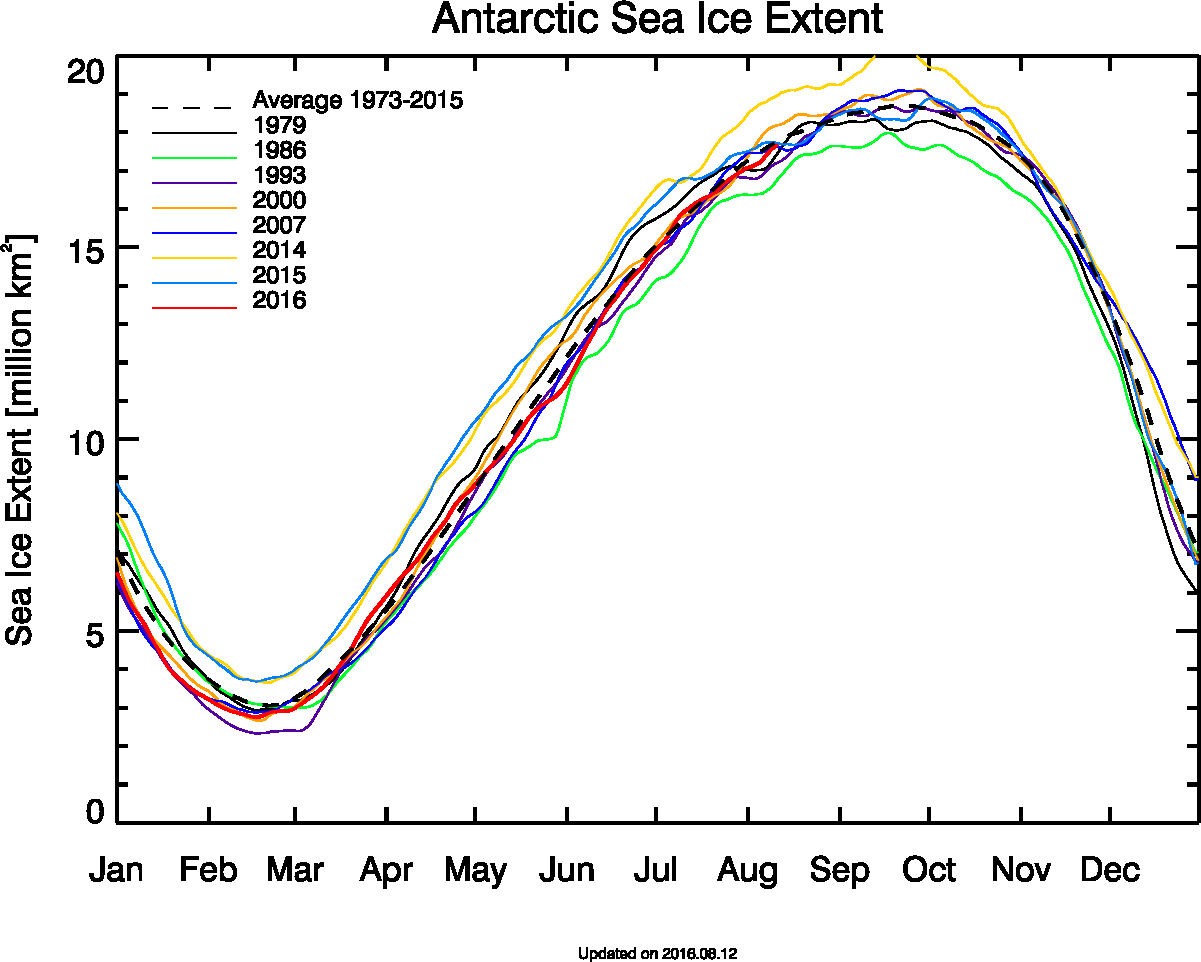
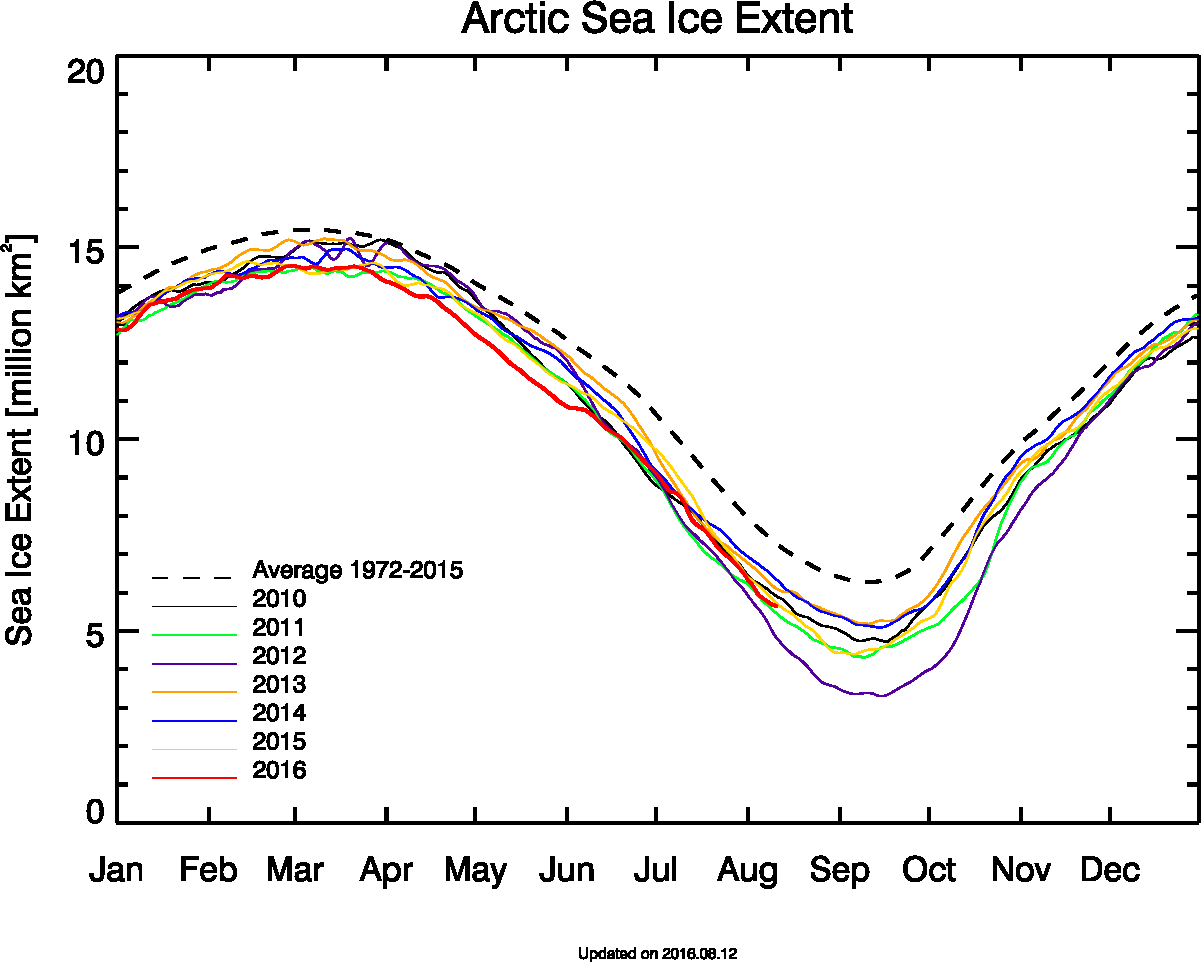
extent_s_running_mean_amsr2_regular.png (1201×962)
Ice is increasing at both poles, and NASA claims it is the hottest year ever.
NSDIC was already planning to commit fraud with the Arctic sea ice age prior to March 2015.
I managed to get hold of that year’s ice age graph from an email to somebody that posted it, but the graph was never released by NSDIC.
http://i1039.photobucket.com/albums/a475/Knownuthing/IceAge2015_zpsykqqhjqo.png
As the graph was showing that the ice age had turned and was recovering they decided to change the format into a new one where nobody can really say if old ice is increasing or not, at the same time as they fudged the ice age data.
This public deception was planned for months.
[IMG]http://i1039.photobucket.com/albums/a475/Knownuthing/IceAge2015_zpsykqqhjqo.png[/IMG]
Ok, I get it.
Hey Javier! Personally, I think that what you say is completely plausible. This would not be the first time that official governmental agencies have, uh, “put a spin on the facts.” That said, I wish there were some way to verify the graph. The true believers in thermagedon will just discount it and say what they always say, “you expect me to believe that ALL those scientists are lying?!”
Thanks for bringing this graph forward! Now, if there is some verification…
There was no graph in 2015, and the format changed in 2016. Together with Tony’s proof that they fudged the data the story is entirely consistent.
Hey Javier! Oh, I agree with you, and would also say that it is very much consistent!
My point was that since (as you say) the graph was never released by NSDIC, there will be alarmists who refuse to give it any credence. They will perhaps say that some sceptic just made it up, and will discount it.
I appreciate you posting that graph. It looks correct to me, especially in light of the info that Tony has shown.
Damn And we are leaving for the Nordkapp tomorrow (by car).
https://en.wikipedia.org/wiki/Nordkapp
Are those solar panels on that ship. How much energy do they generate during the polar night?
They still generate a little. Just mount them in your windows. Facing inward. :)
It’s another 4 weeks at least until end of the melt season, not sure why yet again the claim that it is “almost over”
In 2o12 this time was just the start of a massive loss of ice due to the storm that year, see here.
https://ads.nipr.ac.jp/vishop/#/extent
Not sure why Tony always calls the end of the Arctic ice melting season 1 month before it actually finishes?
Also this comment is true but meaningless
“Meanwhile, the amount of ice in the Antarctic is also growing”
Well, sea ice will continue to grow also for another month or more as per normal. Note that Tony does not call the end of the Antarctic winter maximum early ever …. go figure.
Andy
The daily mean in the Arctic above 80 degrees North just fell below 0 degrees centigrade or 273 degrees Kelvin – the freezing point of freshwater. In a few more days the temperature will be at the point where seawater freezes.
Yesterday by way of confirmation, our friends on the Northabout reported WATER temperatures of MINUS 0.3 degrees at only 76 43 degrees North.
http://polarocean.co.uk/team-great-genoa-engine-off-rain-off-reflex-off-fog-rain-blue-skies/
Strawman, TH said “almost over”
The sea ice mass is larger, thicker and less susceptible to wind. Yes, a large storm could move ice out of the arctic. But that would be zero indication of CAGW, would it?
It was another below average summer air T for the arctic.
Looks like at least two of the years shown, last year and 2013, had curves flattening/headed back up the first week of September. The temperature chart shows the temperatures headed below freezing so ‘Arctic Melt Season Almost over’ sounds like a good description
http://ocean.dmi.dk/arctic/meant80n.uk.php
And as Martin just said
Northabout reported WATER temperatures of MINUS 0.3 degrees at only 76 43 degrees North.
http://polarocean.co.uk/team-great-genoa-engine-off-rain-off-reflex-off-fog-rain-blue-skies/
Without an influx of warm North Atlantic water you are not going to get much more melting.
“Arctic sea ice reaches “low”- life levels” !
The low-lives at NASA and NOAA have once again pointed out the the Artic Sea Ice has completely melted but still won’t reveal just exactly how they came to that assumption !
And the “Chief” Climate Low-Life Walt Meier at the NSIDC expresses the same view point explaining that even though altering the pre-known Arctic data sheets, the fact is that the Arctic Sea Ice has vanished completely and when the piling of the melted ice reaches Florida that the Sunshine State will no longer exist, therefore Florida residents must evacuate immediately even though the rush of sea water will not arrive on the Florida Coast until April 29, 2029 not even explaining just how he came up with that date ?
I guess that’s what you expect from Low-Lives ?
AccuWeather Journal
Average DMI temperature north of 80 just dropped below freezing for the first time this year, a week or so earlier than normal.
http://ocean.dmi.dk/arctic/meant80n.uk.php
Here’s today’s weather map with 2m temp.
Next Tues forecast map continues with low pressure over the basin and colder temps.
And again by next Friday, no much difference.
Take note Andy (Wherever you are) Even the NSIDC is admitting now that “A new record low September ice extent now appears to be unlikely.”
https://nsidc.org/arcticseaicenews/2016/08/a-cool-and-stormy-arctic-in-july/
They say that: ” An extensive area of lower than average temperatures in the Central Arctic and the Siberian coast, attended by persistent low pressure systems in the same region, led to slightly slower than average sea ice decline through the month. The stormy pattern contributed to a dispersed and ragged western Arctic ice pack for July, with several polynyas beginning to form late in the month. A new record low September ice extent now appears to be unlikely.”
So Tony was right all along.