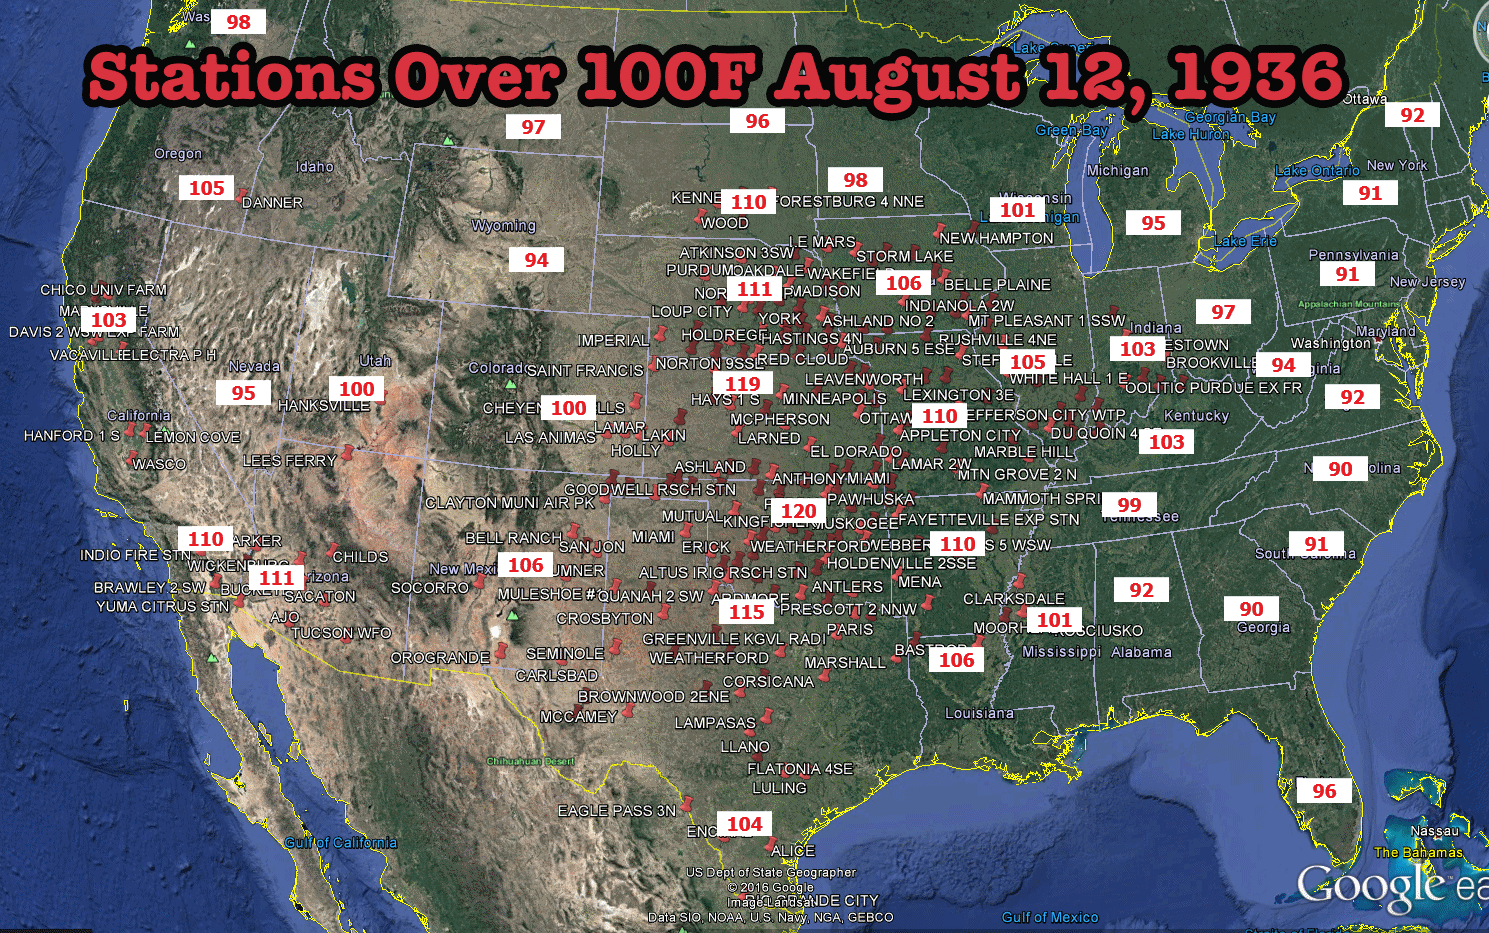
On this date 80 years, the entire US was engulfed in a massive heat wave which brought temperatures of 120 degrees to Oklahoma, 119 degrees in Kansas, 115 degrees in Texas, 111 degrees in Nebraska and 110 degrees in Arkansas and South Dakota.
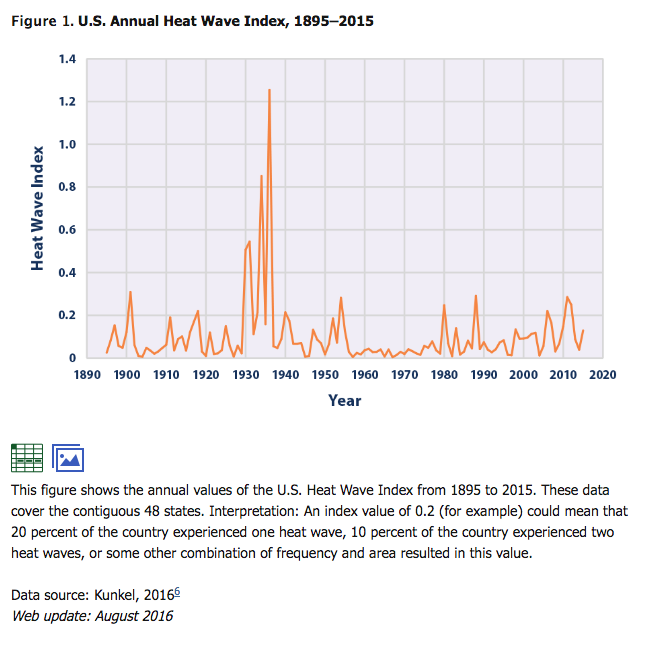
Government experts say that heatwaves are getting worse, even though their own data says the exact opposite.
Here is some additional historical evidence about the great heat wave of 1936 (this from Davenport, IA):
“1936 was a year of extremes not only socially and politically, but for weather as well. As the U. S. continued to struggle through the Great Depression, the winter of 1935 – 1936 brought record-breaking bone chilling cold while the summer saw record-breaking heat strike most of the country. Davenport was no exception. Many of the high temperature records set that summer still stand. Drought, grasshoppers, floods (in specific areas), and tornadoes also added to the natural disasters of the year.”
“Between July 5 and July 15 the temperature remained above 102 degrees during the day with temperatures only dipping into the 80s at night. The highest temperature came on July 14 when the thermometer hit 111 degrees. With no rain in sight newspapers began to report on crops dying. Adding to the agricultural distress were grasshoppers eating what crops were not withering away in the sun. Only a few hotels and movie theaters had air conditioning. Home cooling systems were still very rare. Families began to live in their basements during the day to keep cool. At night people slept in parks or on lawns trying to find what little comfort there was in the outdoors. The local papers continued to list those who had either died or collapsed from the heat.”
“Highs temperatures still on record from 1936: June 29 – 104° F, July 5 – 105°F, July 6° – 105°F, July 7 – 105°F, July 8 – 104°F, July 9 – 102°F, July 10 – 105°F, July 11 – 107°F, July 12 – 108°F, July 13 – 107°F, July 14 – 111°F, July 15 – 106°F, July 17 – 103°F, July 26 – 106°F, August 12 – 100°F, August 14 – 105°F, August 15 – 101°F, August 18 – 106°F, August 21 – 99°F, August 22 – 101°F, August 24 – 100°F.”
http://blogs.davenportlibrary.com/sc/2008/07/07/heat-wave-1936/
If this happened today, I wonder what the headline would be…
The August 12 maximum temperature for Midland, TX was 107 F, set in 1937.
http://w2.weather.gov/climate/getclimate.php?wfo=maf
A better link than above
http://w2.weather.gov/climate/?wfo=maf
Second correction (need more coffee):
That August 12 record was set in 1936.
Map shows high of 115º. This source indicates 120º, in Seymour, TX.
Highest
Seymour, Aug. 12, 1936 120°F
http://texasalmanac.com/topics/environment/extreme-weather-records
It was 120 degrees here in Oklahoma on this date in 1936, yet NASA/NOAA claim this year of 2016, is the “Hottest Year Evah!”.
In this “hottest year evah” of 2016, it will be in the upper 90’s today in Oklahoma, August 12, and the temperatures are supposed to drop dramatically over the next couple of days into the lower 90’s and lower, so we are not even close to being as hot as 1936, was.
The temperature drop in the next few days will probably turn into a trend of cooler weather as summer ends.
All in all, a very nice summer in Oklahoma this year. The people of 1936, would have loved this weather. We even got rain in August in Oklahoma! My lawn grass is still growing! That’s pretty rare around here.
NASA and NOAA don’t have a clue. At least none they would admit to.
People who are paid to not have a clue eventually get very good at it.
They are pretty darn good at feeding lies and propaganda to the media, who in turn feeds same lies and propaganda to the sheeple.
The epicenter of the dust bowl is pretty extreme. Is that the only place and period that represents evidence it was hotter in the past. What about Alaska? C’mon Tony quit recycling the same old dust bowl data. Daily highs from a small geographic region in the center of a continent is not compelling. Show us some data for India. Show us a multi-continent comparison from the same date in 1936 and 2016.
You must be reading comprehension challenged. The post was about CONUS heat wave claims only.
You want a different post entirely. Read SREX 2012 for starters. Then read essay Credibility Conundrums in ebook Blowing Smoke for an anlusis of the US National Climate Assessment 2014. Then look at Dr. Christy’s Feb 2016 Congressional testimony chart on the divergence between balloon and satellite troposphere temperatures and the CMIP5 models of same. Might open your eyes.
Dr……really?
Jo Nova has information of the 1930s heat wave in Australia Heatwave kills thousands of birds — this was climate change in 1932
I have three questions about this complaint:
Is it possible the meaning of the red numbers on the little white labels on the perimeter of the United States is beyond comprehension for some individuals?
Is there another explanation for the complaint besides illiteracy, innumeracy, gullibility or duplicity?
Doctor of what?
Maps are REALLY REALLY HARD to read Colorado so that is why the good doctor was unable to comprehend the information.
But, but, they promised there would be no maps!
Na! They just become one line parrots when the data and information provided does not agree with their desires. The line is that the area being discussed is not the world or the whole US or whatever.
Dr A
You want the worlds temp?
http://www.drroyspencer.com/2016/08/uah-global-temperature-update-for-july-2016-0-39-deg-c/
“Given the behavior of previous El Ninos as they transitioned to La Nina, at this point I would say that it is unlikely that the temperatures will remain above that projection for the rest of the year, and so it is unlikely that 2016 will be a record warm year in the satellite data. Only time will tell.”
I went to a local global warming conference and with it I brought the list of Washington, DC’s monthly all time high temperature records, most of which were set long ago. I also brought data for Des Moines, IA that showed that no daily high record for any day in July had been set since 1955. The alarmists said it was local information, but it is their job is to prove there is a climate crisis and even that little bit of data is pretty good evidence there is not.
You can always find a heatwave in Pango Pango or some other God forsaken place, but that does not prove a climate crisis,.
Do you trust data from India? How about data from Russia after the fall of the Soviet Union? Do you think that data from Siberia and the 12 time zones was reliable? I don’t think that it is reliable now.
Those temperatures, that is “amazing” ? !!!
To see the entire Country locked in heat from coast to coast, North to South like that is intimidating !
No where to run too, no where to hide ?
Nothing compares to the 1930’s, NOTHING !
And I don’t want to know the death count, tough times…
Question, I wonder what the temp was on that day in 1936 in DVOB (Death Valley), 129°+ ???
Close. google is your friend. Took 15 seconds to look up. Officially 127F on 8/12/36 at the Greenland Ranch, Death Valley Ca. Not the record. That was set in 1913 at 134F.
The high temperatures are not surprising considering the continental US was in the midst of an epic and extreme multi-year drought. Little humidity to prevent temperatures from soaring. Google dust bowl. If that’s the only time it was hotter than present its no surprise considering the size, scope, and duration of the drought. The most extreme meterological event of the century is the only time it was hotter than present. Not compelling.
But it’s a dry heat
If the Dust Bowl happened now, Dr (of what) A et al would claim it was due to CAGW. But of course, these are the same people who deny the MWP, science, and natural variability.
With this all being in regards to the United States, what about the temperatures around the globe in the 1930’s compared to today?
BK, there aren’t any good comparisons. Coverage was sparce, and QC for microsite and UHI issues almost nonexistent. You can go to specific quality station places like Australia Rutherglen or Iceland Reykjavik or Japan Tokyo prefecture islands for some sense that the US record is ‘right’ and the global record is ‘wrong’. It is not, and is still not, possible to go global with a UHI uncontaminated geographically representative sample. Despite BEST’s regional expectations try; See fn 24 to essay When Data Isn’t for several amusing examples including station 166900, south pole Amundsen Scott. Or just read this blog and use the free software for a more parochial perspective.
Bobby,
Try the Original Temperature Project (Frank Lansner @ http://www.hidethedecline.eu/ )
Frank’s essay at WUWT:
https://wattsupwiththat.com/2014/01/06/the-original-temperatures-project/
Places in central Washington State are experiencing warm temperatures this week with just under 100s today and likely just over 100 on Saturday. We call it summer.
I spent the day at 6,700 feet at Mt. Rainier National Park — helping fix a rocky bit of the Sourdough Ridge Trail. It was a marvelous day. Others prefer going to a beach.
[The map at the top shows a WA site with 98 for the one day. Checking a 10 period might be interesting for 1936. I suspect, then as now, there was a large high pressure system.]
Pingback: July 2016 Hottest Ever? Nope. Just Kind of Average. — GraniteGrok
This was when they banned 4 x 4 horses. It worked really well. The US has been cooler ever since.
1881 was a hot and dry year, and still holds many record highs.
http://query.nytimes.com/mem/archive-free/pdf?res=9F0CE6DF113CEE3ABC4951DFB667838A699FDE
If I am not mistaken, Germany’s record high was also set in 1881.
http://www.straitstimes.com/world/europe/germany-records-hottest-temperature-since-1881-as-europes-heatwave-boosts-power-demand
I believe the UK’s record heatwave during 1976 when as couple of stations hit 100 degrees. Even that was 40 years ago.
One thing to think about when considering the extreme temperatures of 1936, versus the rest of the world, is that 1936, was not the only hot year in the decade of the 1930’s, *every year” in the 1930’s was extremely hot.
Now if most of the United States baked for a decade under these kinds of temperatures, don’t you think that would affect the surrounding areas of the world?
The historic records of other areas of the world I have seen Tony produce, *do* show a heat spike in the 1930’s. Some of them don’t exactly correlate with the U.S. but they are pretty close. Unfortunately, we don’t have as much historical data as we would like.
And of course, with any discussion of local versus global temperatures of the past, we must note that the Climate Change Gurus apparently had enough historical global temperature data in their hands to show that the 1930’s was hotter than 1998, which caused them to enter into an international conspiracy to erase this fact from history by turning the temperature record upside down and making 1998, hotter than the 1930’s, as part of their effort to promote the CAGW theory.
The Climate Change Gurus would not have had to engage in this conspiracy, if they were just talking about local temperatures. They could have just dismissed the 1930’s as being a local effect. But they didn’t, did they. Instead they conspired to change the surface temperature history for political purposes and personal gain.
And the anecdotal evidence that the extreme heat of the 1930’s was global is overwhelming.
Hey, Florida was only 96!
Ya gotta look at the bright side!
I noticed Yuma or Phoenix was 111 degrees, about the same as it was on this day in 2016.
It certainly doesn’t seem to be getting any hotter. In fact, it has cooled from 1991.
it’s true, there was a stand alone spike in 1937 that is holding many of the heat records; it’s also true that #s 2-16 are all 2001-2017 in a row. Elephant party deniers are standing on a melting platform themselves, once that 37 record goes down they’ll be hard pressed to defend their ignorance
Look for the Dems to get wiped out in 2018.
That was what Rush said earlier this week about the 2018 elections.
As for the pagan climate change religion? It’s oracles are still projecting but nobody but the brain dead faithful are listening. tits mcguillicutty your religion is tits up! And most probably so is the political party you support. I mean after all here is an example of what they’re trying to sell for the future of the party.
I see that you are making no attempt to hide your ignorance.
Displaying it for all to see. Courage. ;-)
Cycles are difficult for brain-dead AGW twerps to comprehend.