Every year we are told by Nobel Prize winners, climate scientists and environmental activists that the Arctic will be ice-free that year. They are flat-earthers.
It is impossible for the Arctic to be ice-free under current climate conditions, because the Earth is round. Because of the high albedo of clouds and ice and the low angle of the sun, north of 80N they don’t get enough solar energy to melt that much ice. The prevailing winds also jam the ice up against the Canadian Coast, and make it very thick.
Climate scientists have been making idiotic predictions about an ice-free Arctic for generations. They have no idea what they are talking about.
North Pole already ice-free in 2000
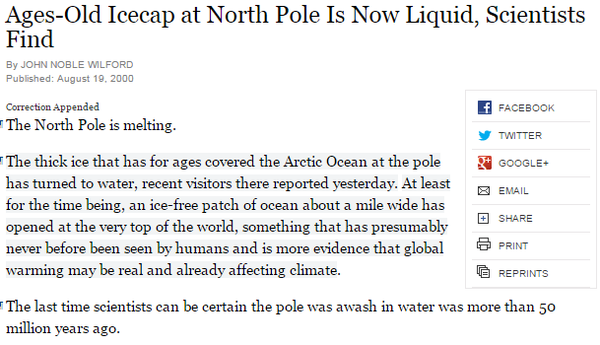
Ages-Old Icecap at North Pole Is Now Liquid, Scientists Find – NYTimes.com
Arctic ice-free by 2012.
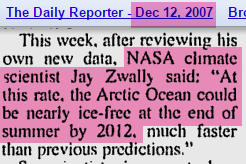
The Daily Reporter – Google News Archive Search
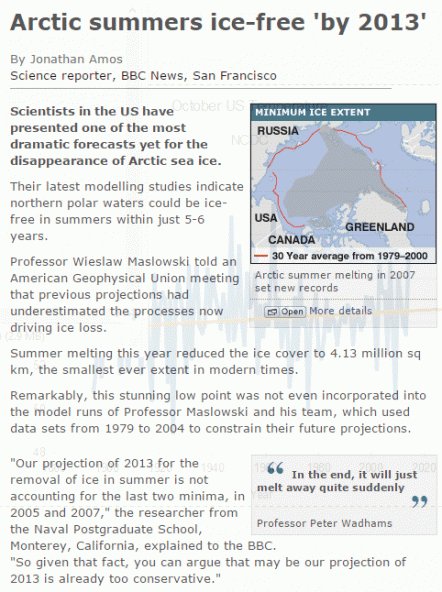
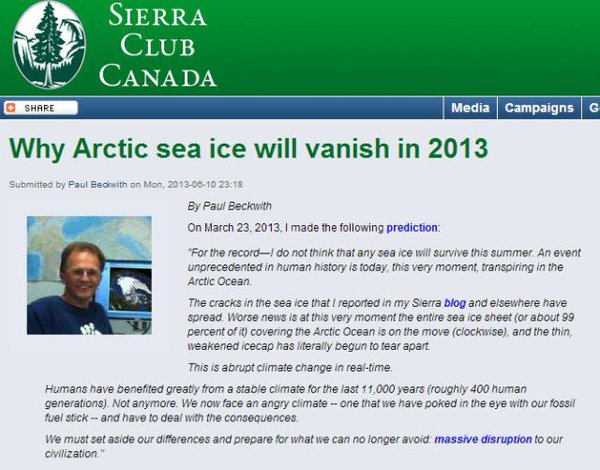
Arctic ice-free by 2013
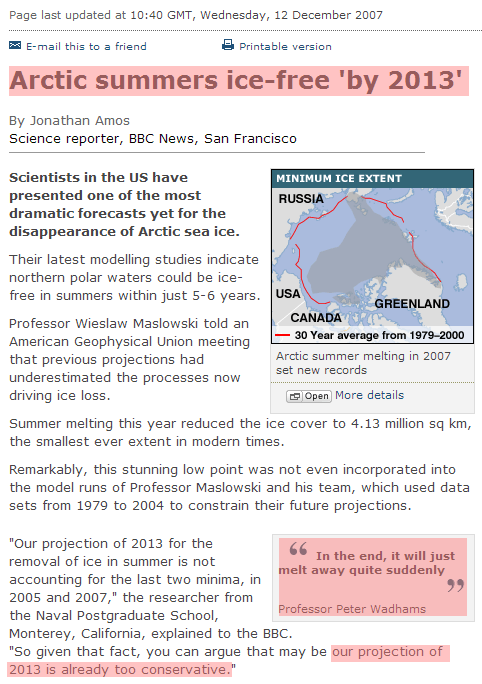
BBC NEWS | Science/Nature | Arctic summers ice-free ‘by 2013’
Arctic ice-free by 2014.
Gore: Polar ice cap may disappear by summer 2014
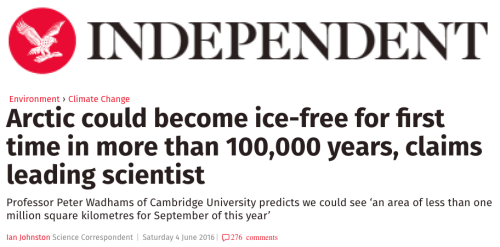
Arctic ice-free by 2015.
What climate scientists talk about now – FT.com
The End of the Arctic? Ocean Could be Ice Free by 2015 – The Daily Beast
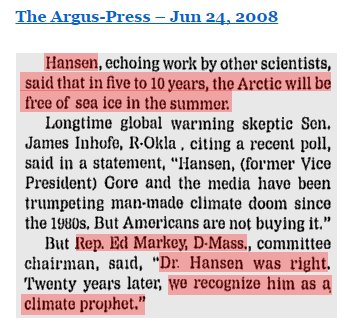
The Argus-Press – Google News Archive Search
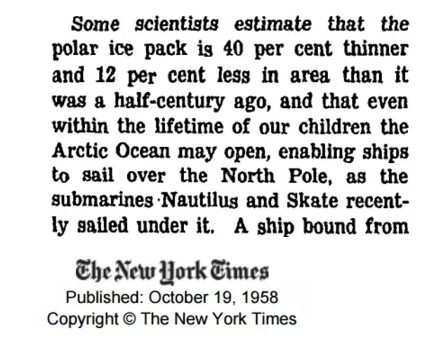
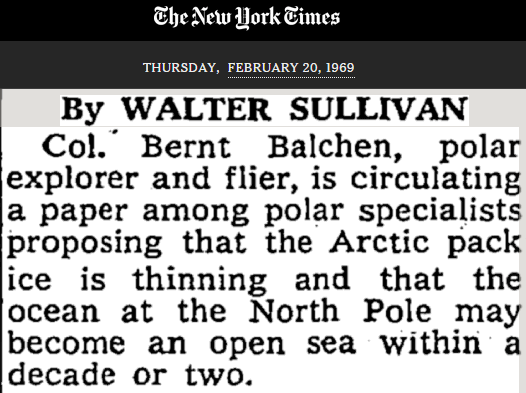
Scientists have been saying this same story for generations.
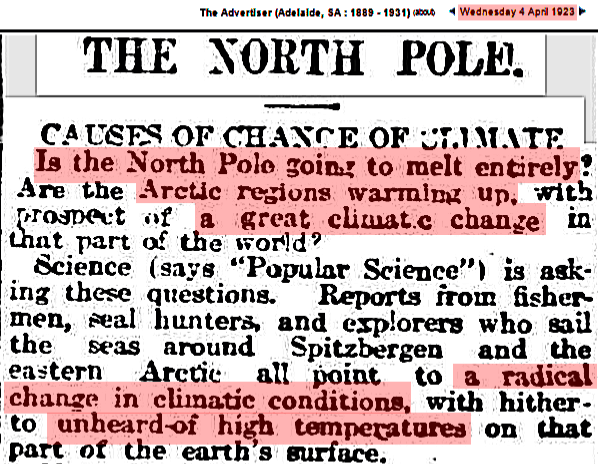
04 Apr 1923 – THE NORTH POLE. – Trove
The Changing Face of the Arctic – The Changing Face of the Arctic – View Article – NYTimes.com
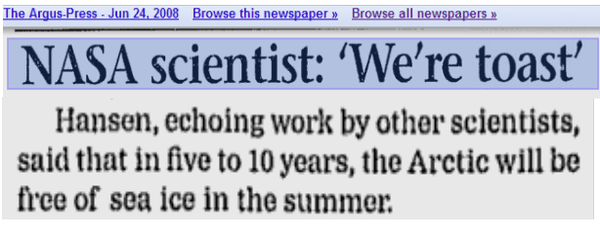
The Argus-Press – Google News Archive Search
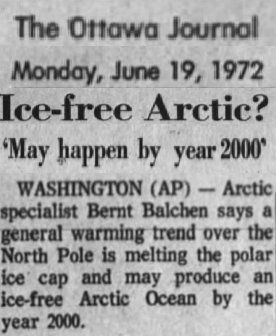
19 Jun 1972, Page 41 – at Newspapers.com
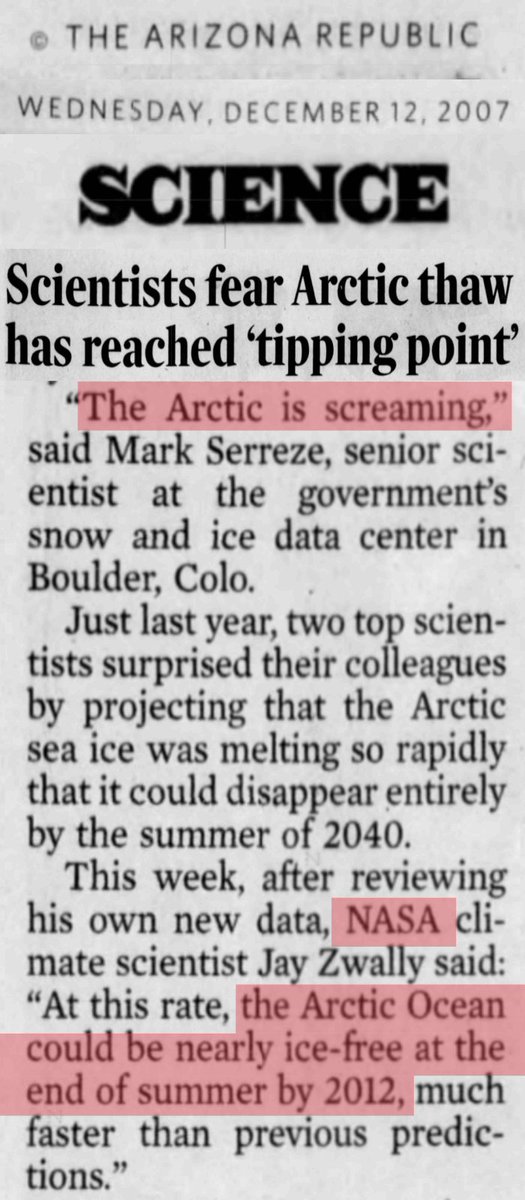
12 Dec 2007, Page 25 – Arizona Republic at Newspapers.com