
The first week of 2018 – eastern US and Canada in a deep freeze.
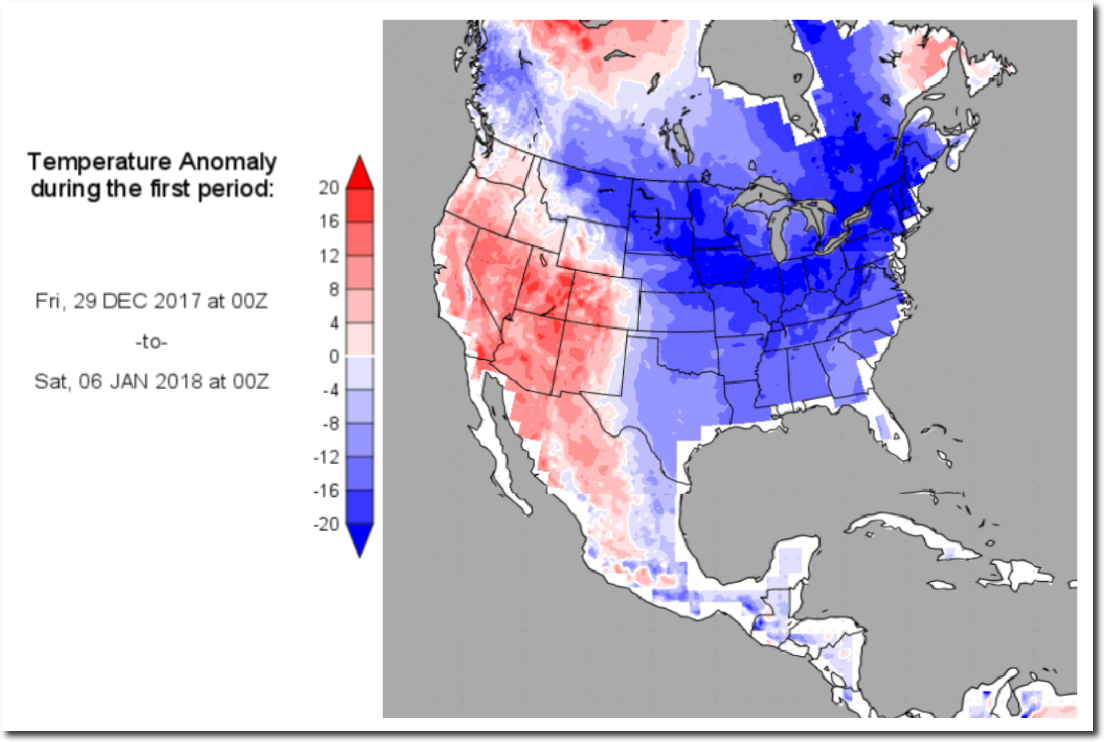
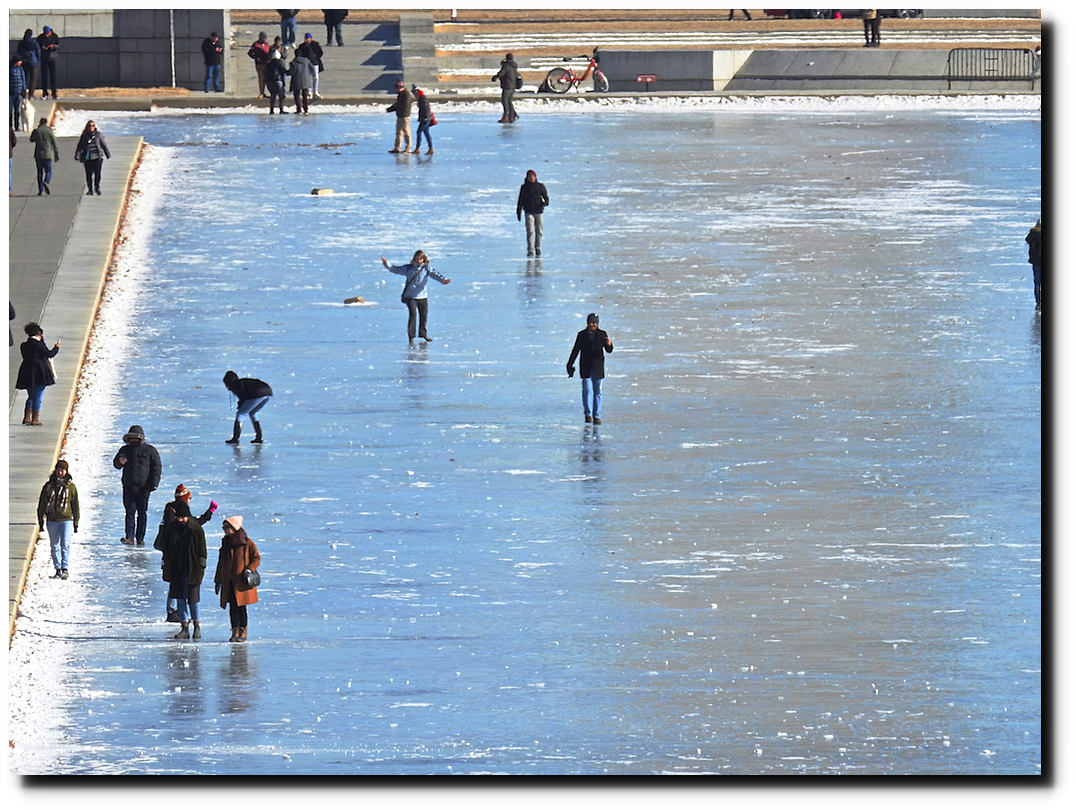
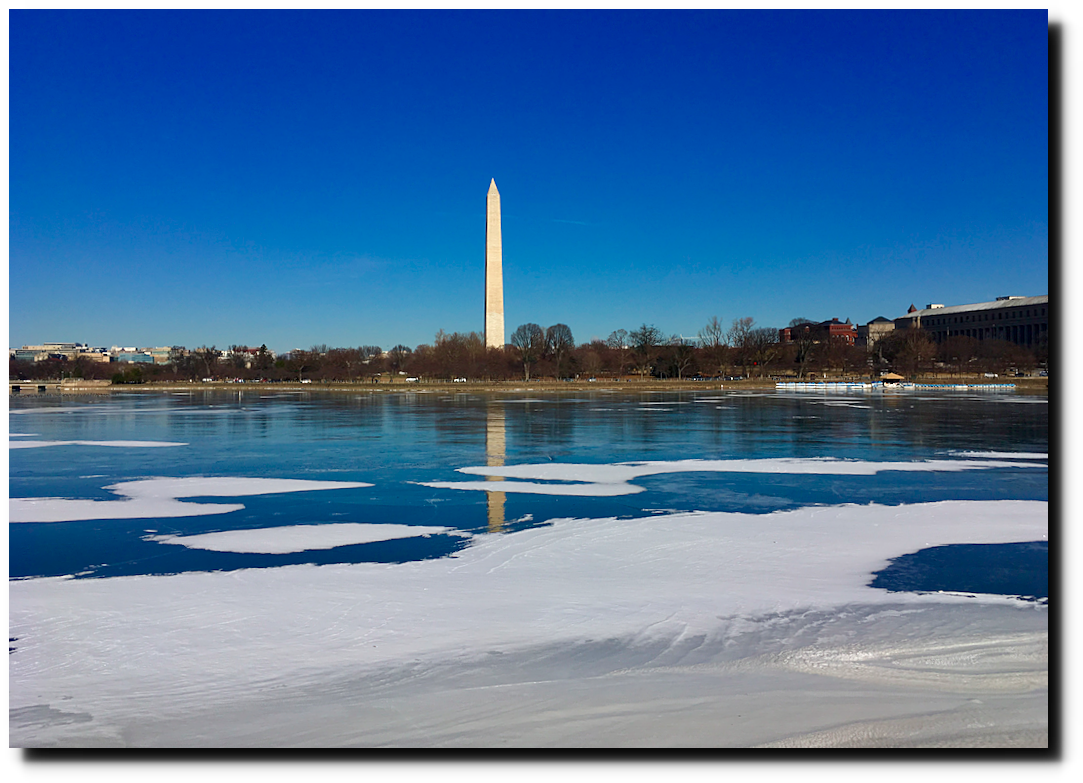
Washington DC was below 0°F and frozen solid.
Thirteen weeks later – the same pattern, and a big snowstorm headed to DC.
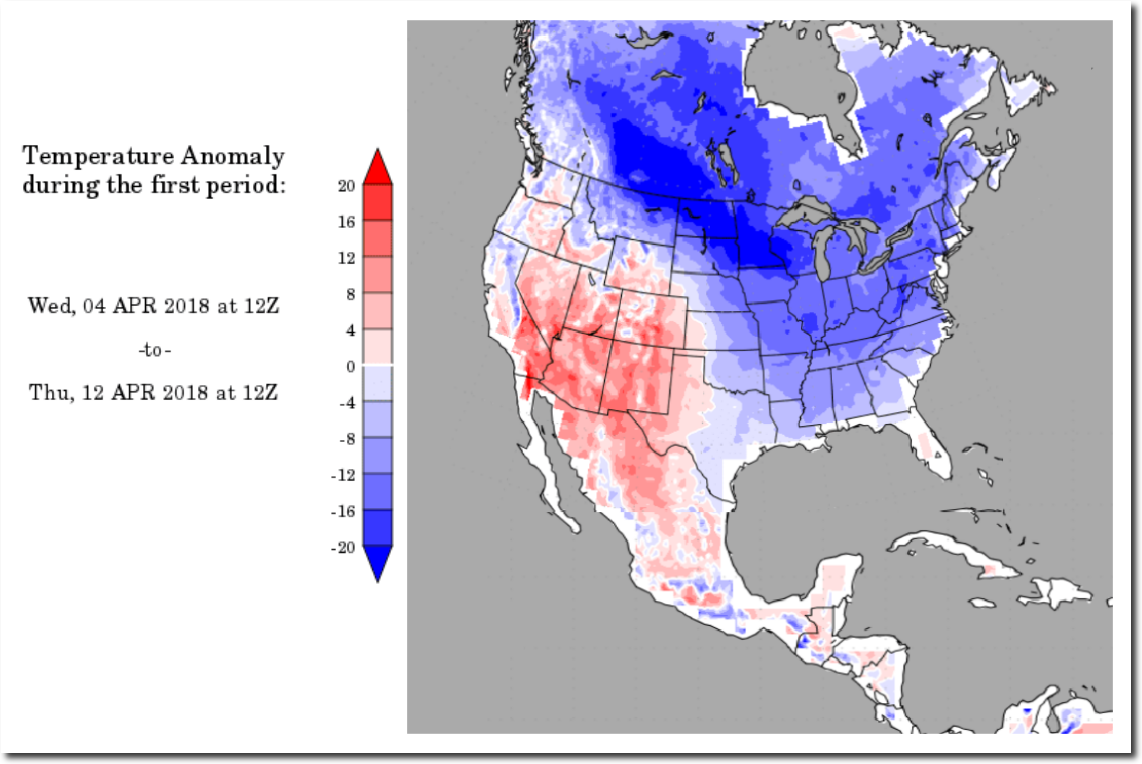
10-Day Temperature Outlook for the Conterminous U.S.
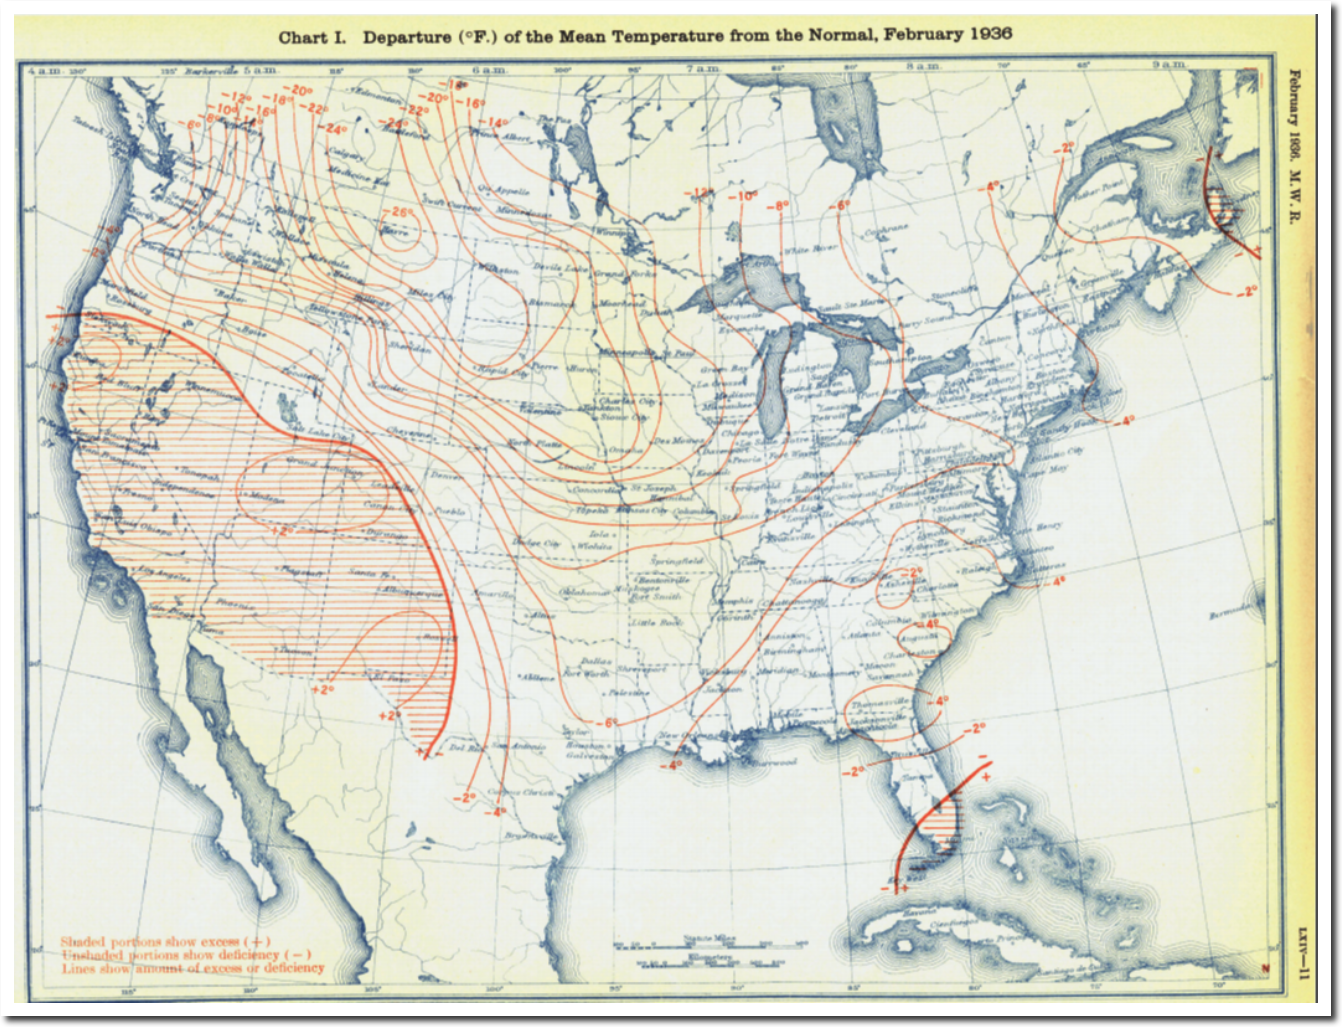
The pattern is similar to February, 1936.
Lets ignore the historic solar minimum, and keep talking about imaginary record heat – caused by a 0.0001 mole fraction increase in a harmless, essential trace gas.
