
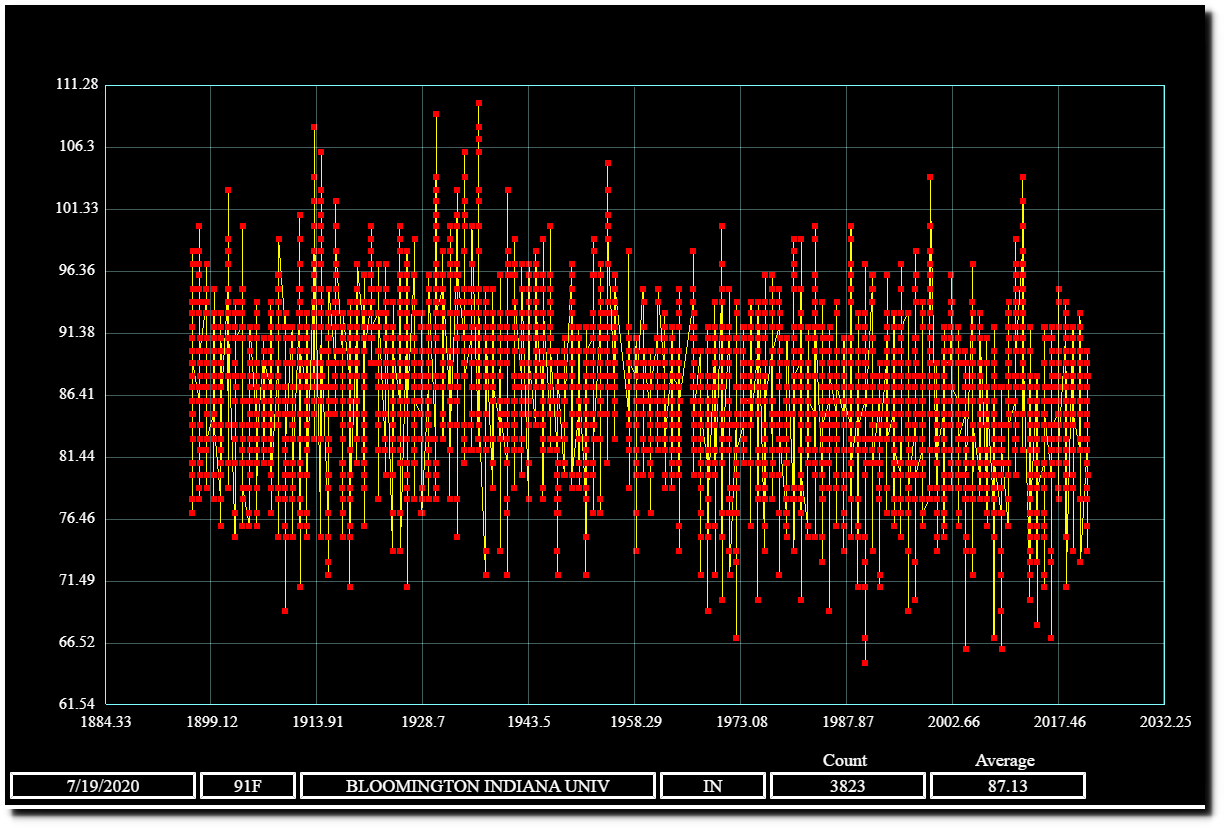
My new climate tool is online. This graph shows every July daily maximum temperature at Indiana University since 1895. There are 3,823 temperature readings with an average of 87.13 degrees.
My new climate tool is online. This graph shows every July daily maximum temperature at Indiana University since 1895. There are 3,823 temperature readings with an average of 87.13 degrees.
