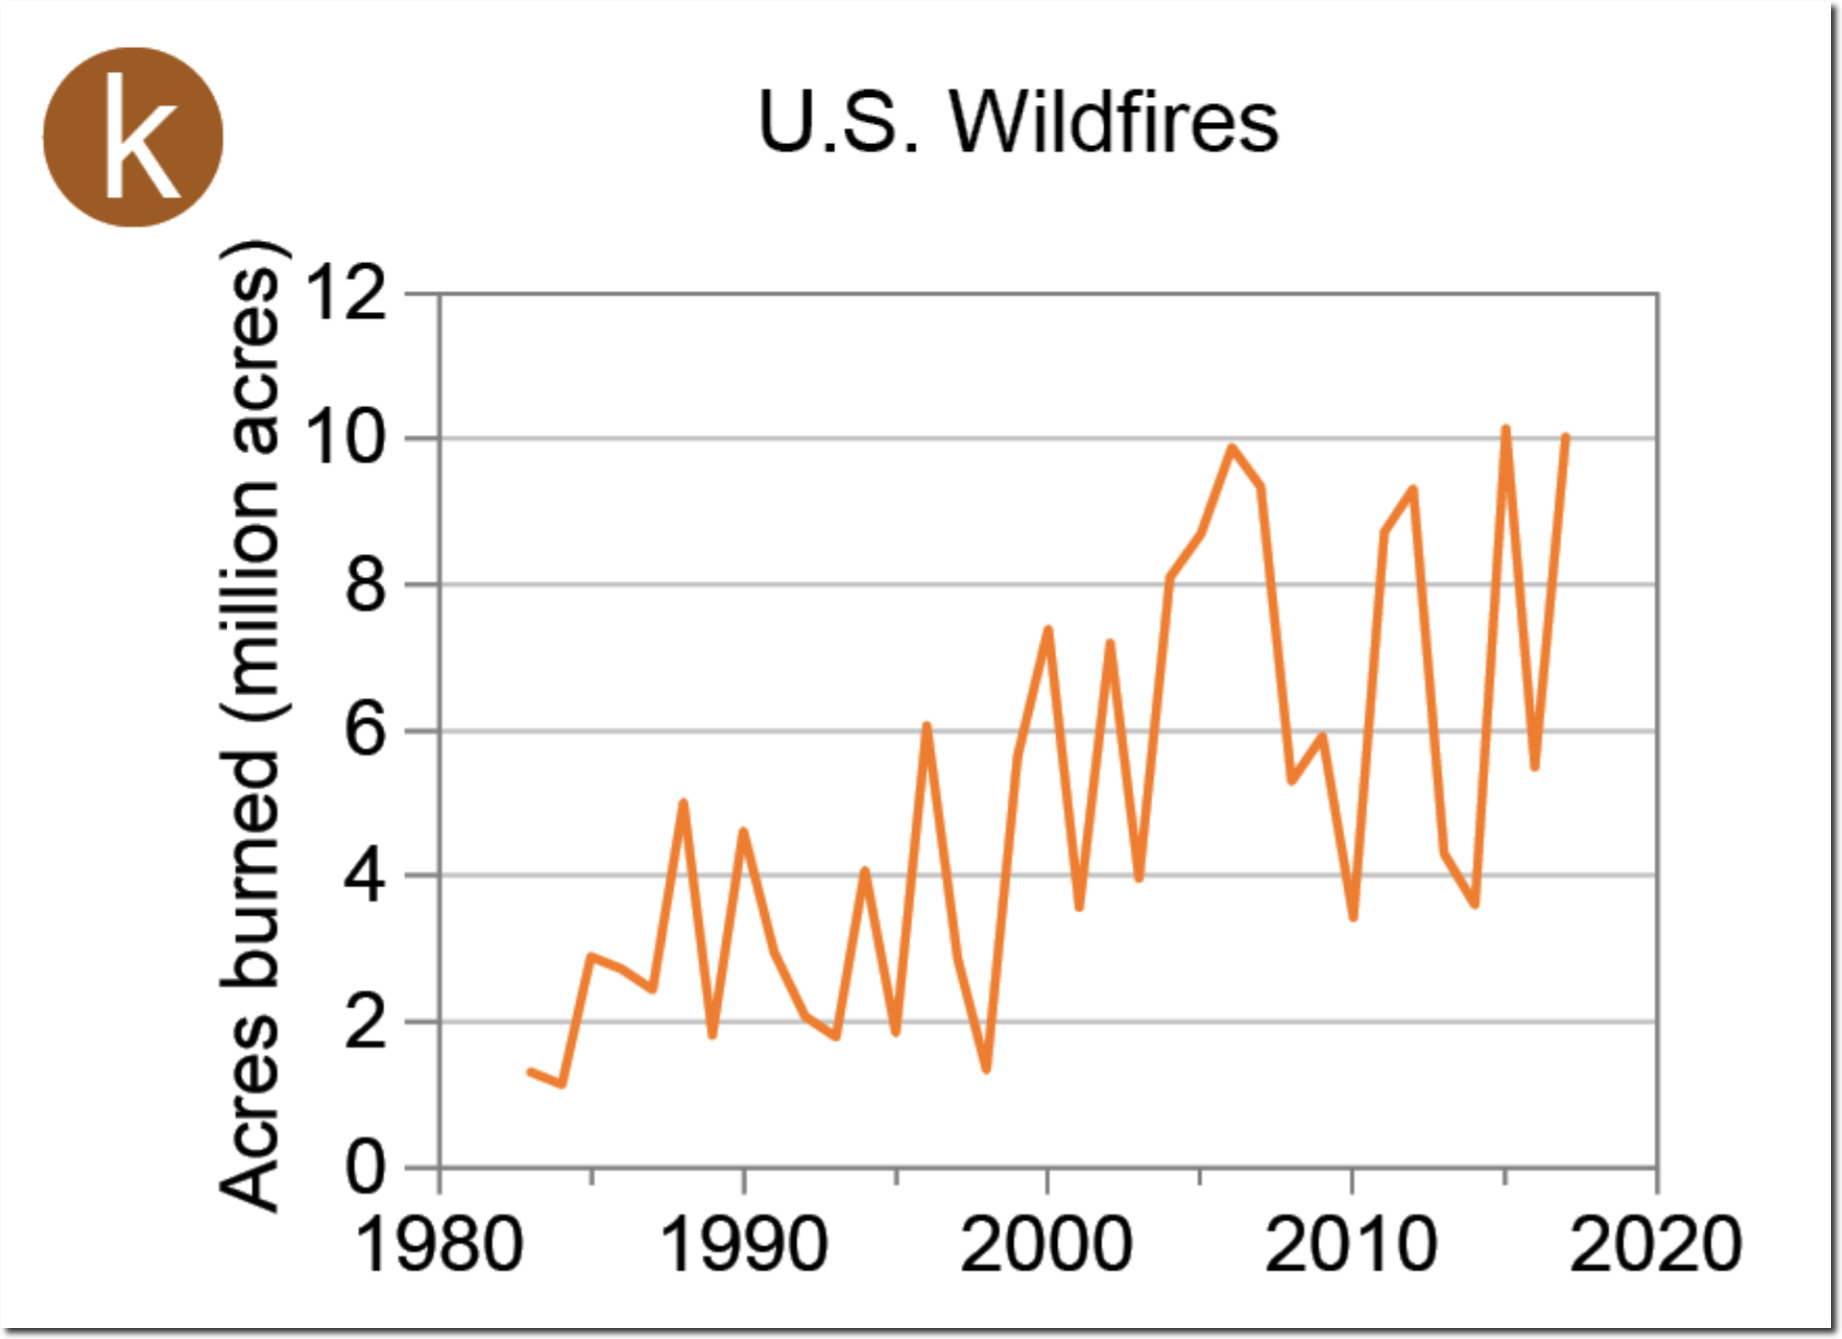
The 2018 National Climate Assessment included this summary diagram for journalists and politicians, which showed a sharp increase in US burn acreage since 1983.
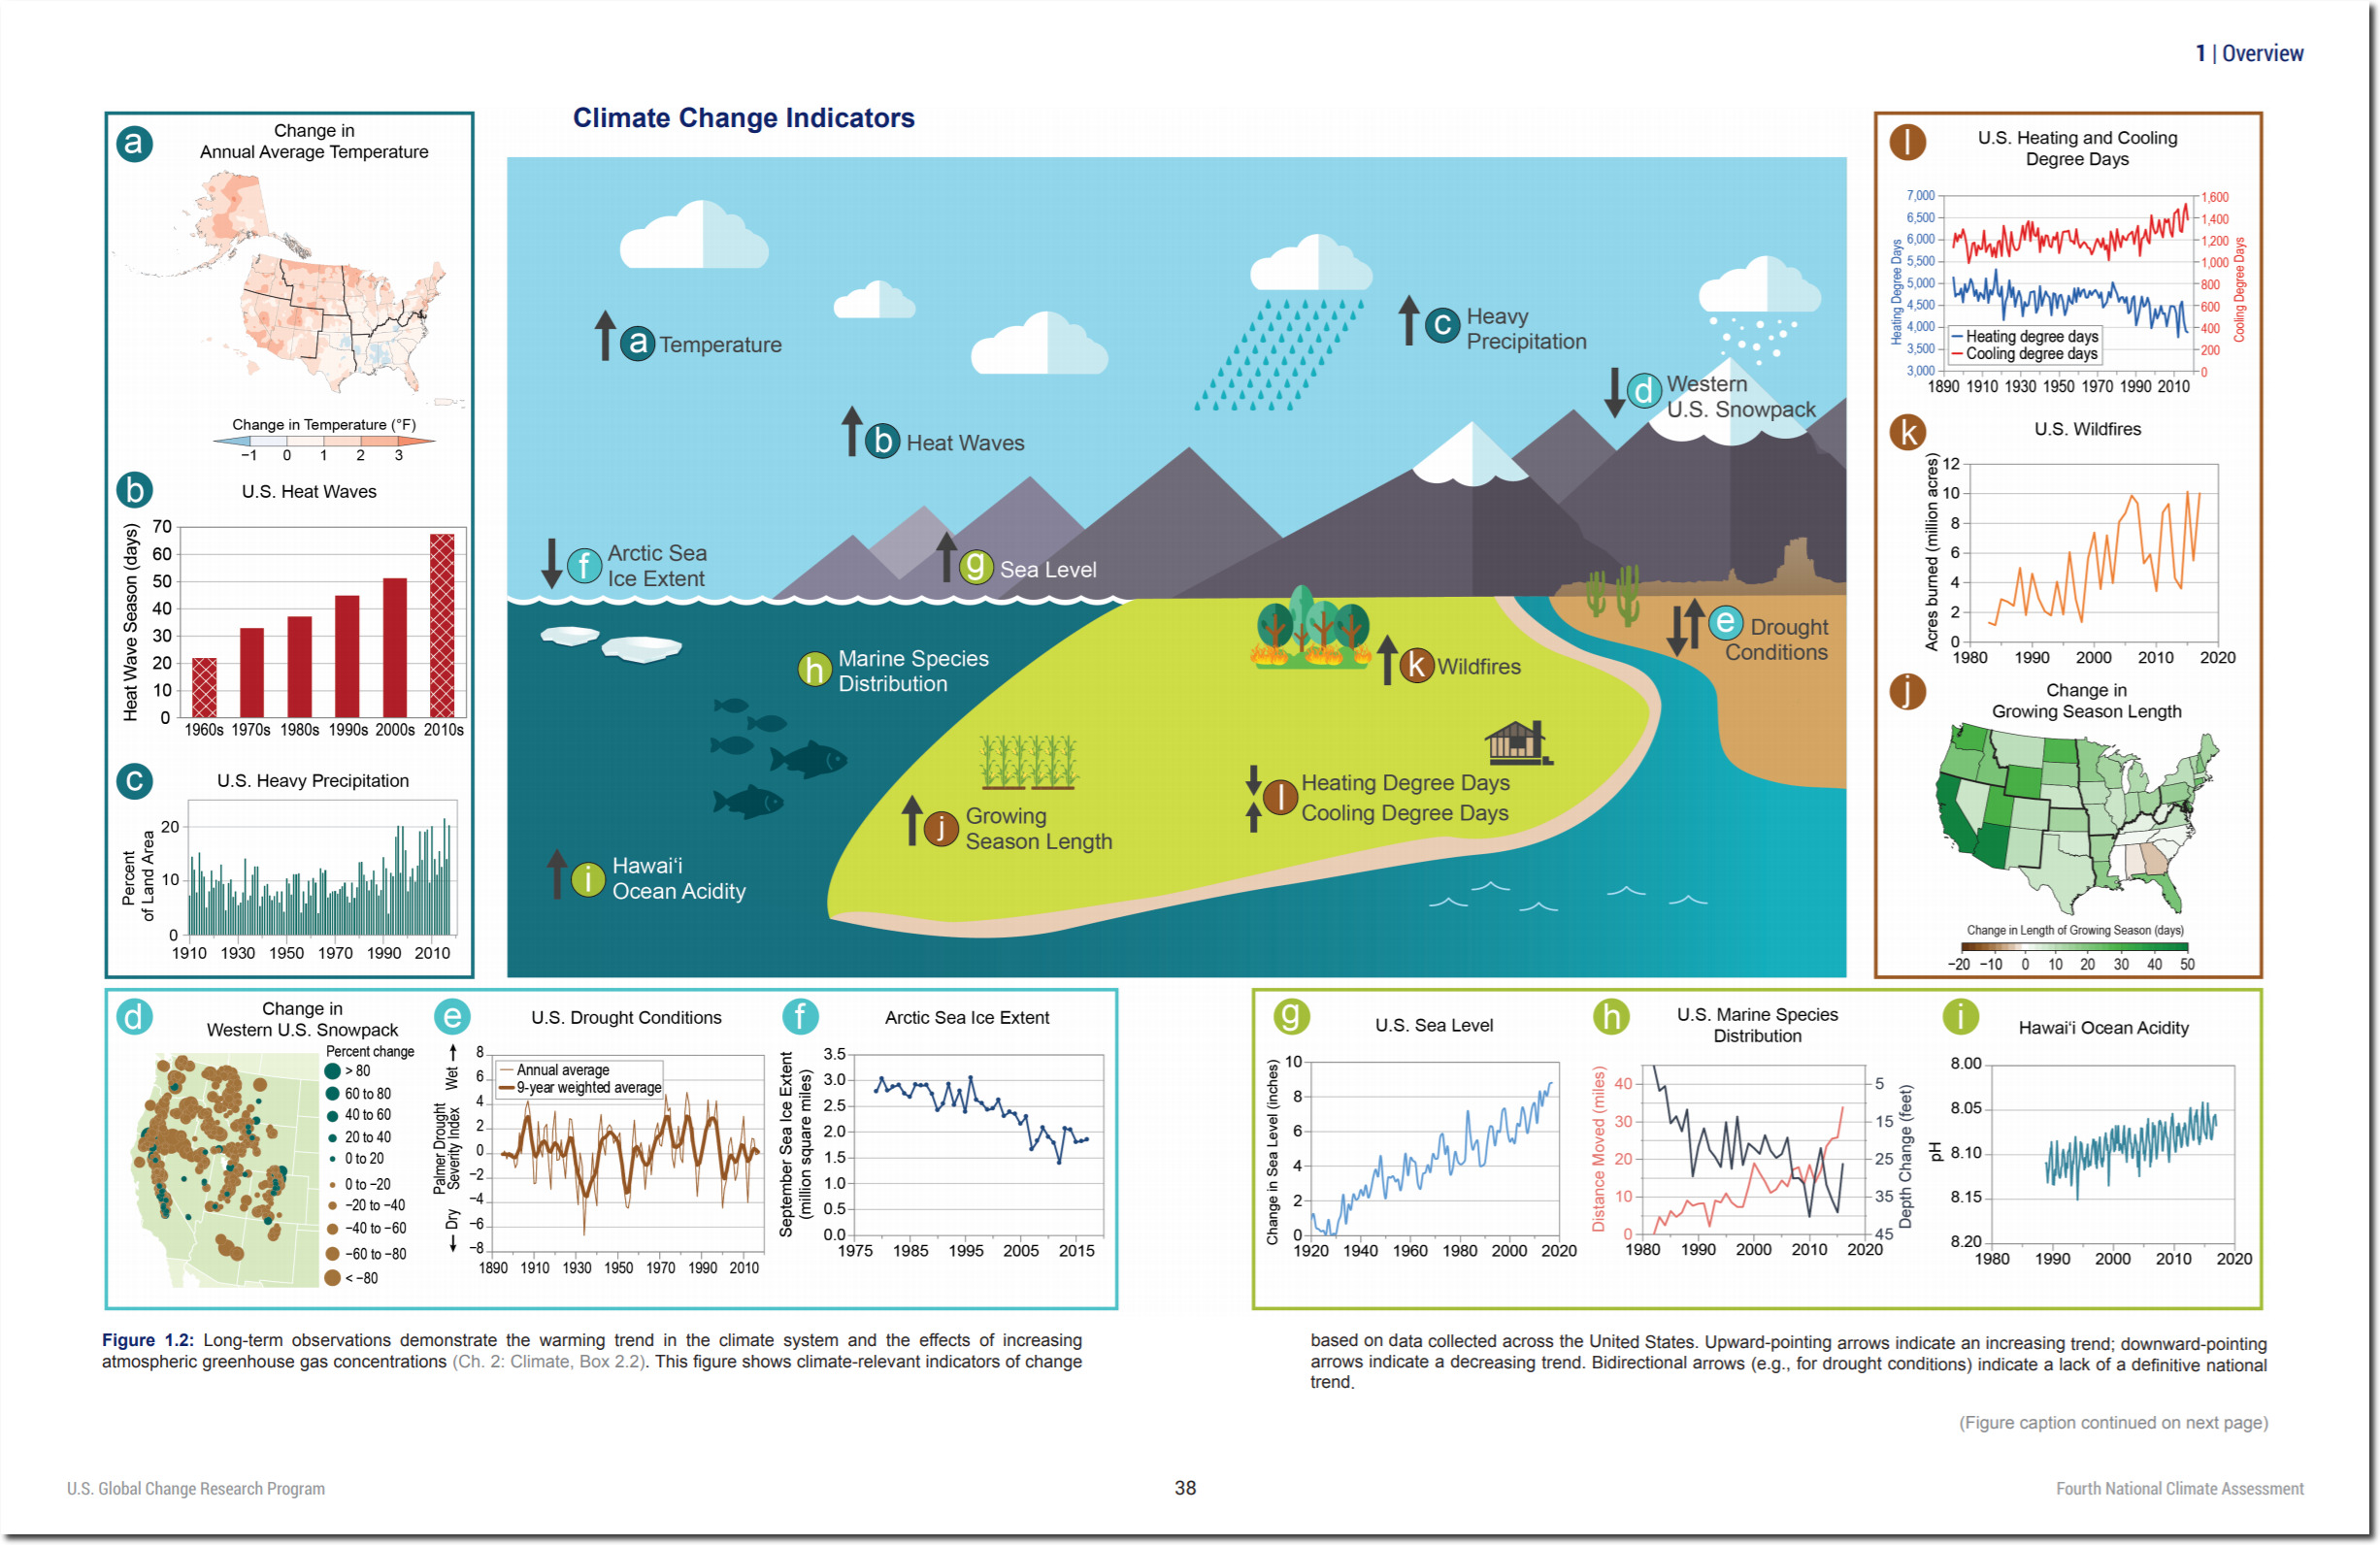
Fourth National Climate Assessment, Volume II: Impacts, Risks, and Adaptation in the United States
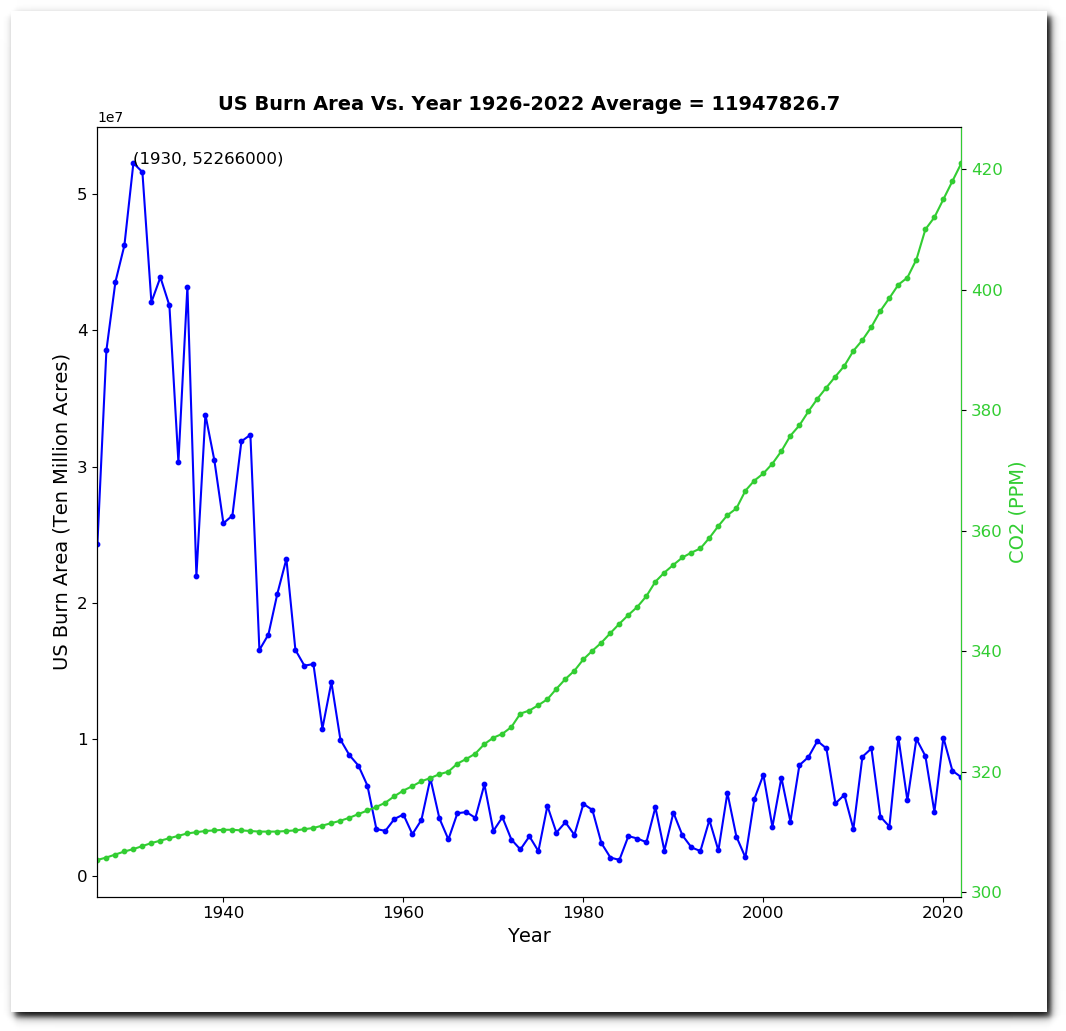
There appears to be good correlation between burn acreage and CO2.
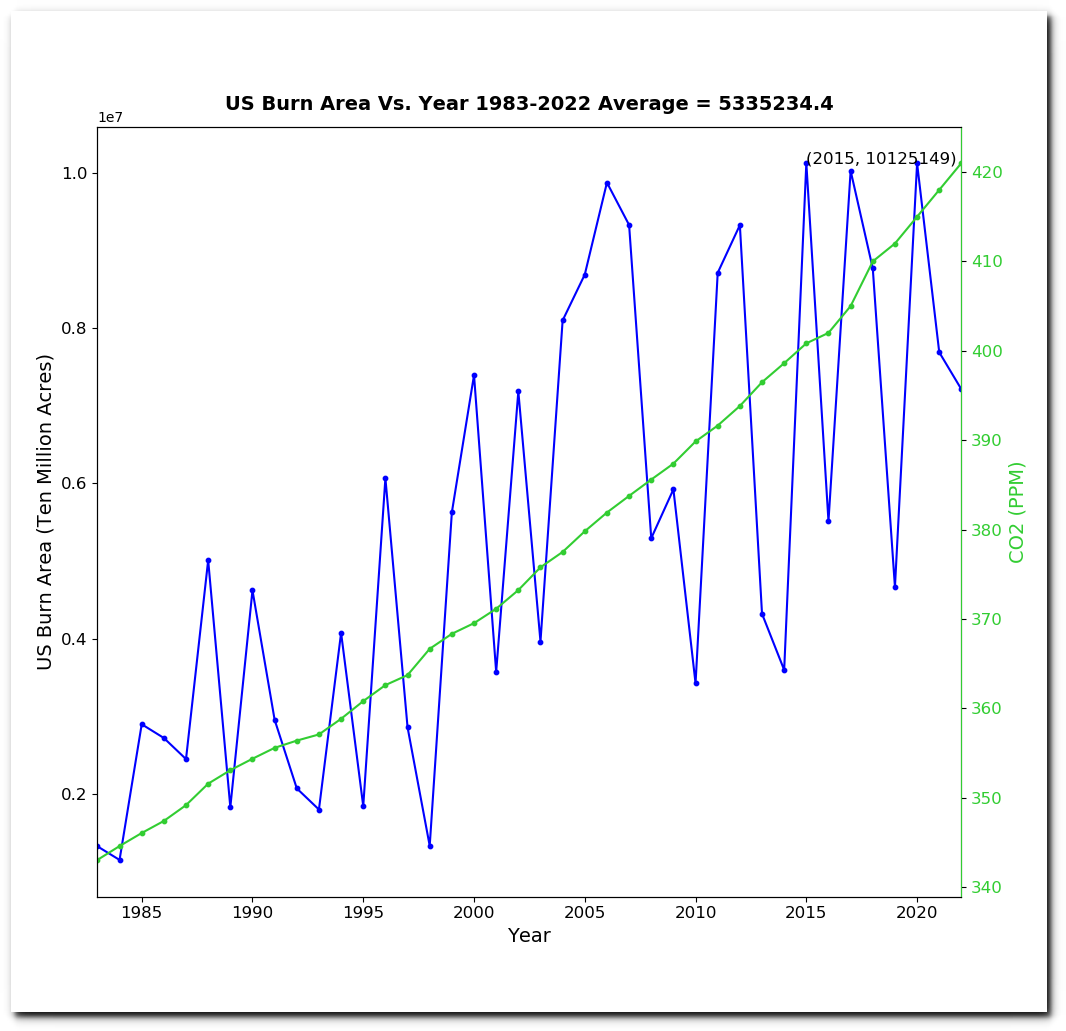
But why start in 1983? The US Forest Service has burn acreage data going back more than a century.

2010-sustainability-report.pdf
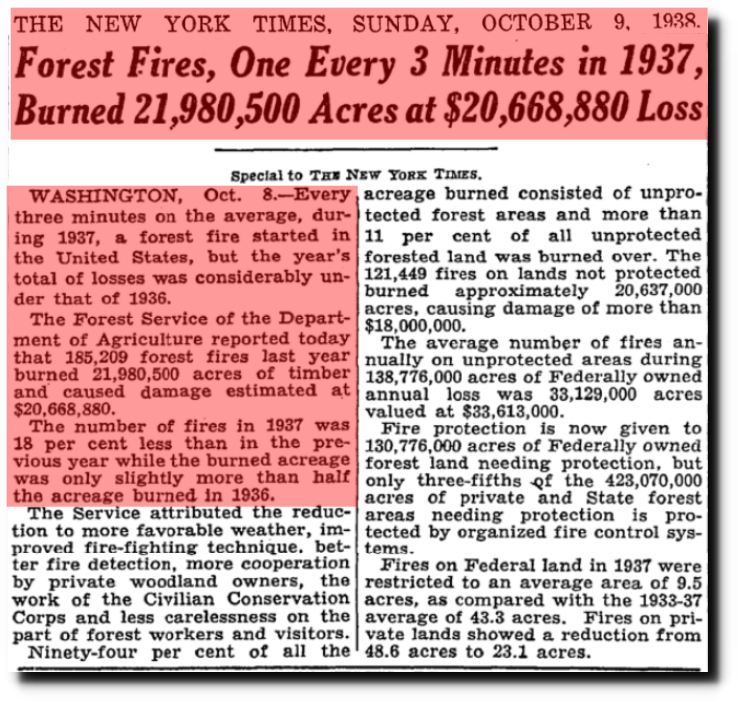
TimesMachine: October 9, 1938 – NYTimes.com
One week into Biden’s occupation of the White House, there was data going back to 1986.
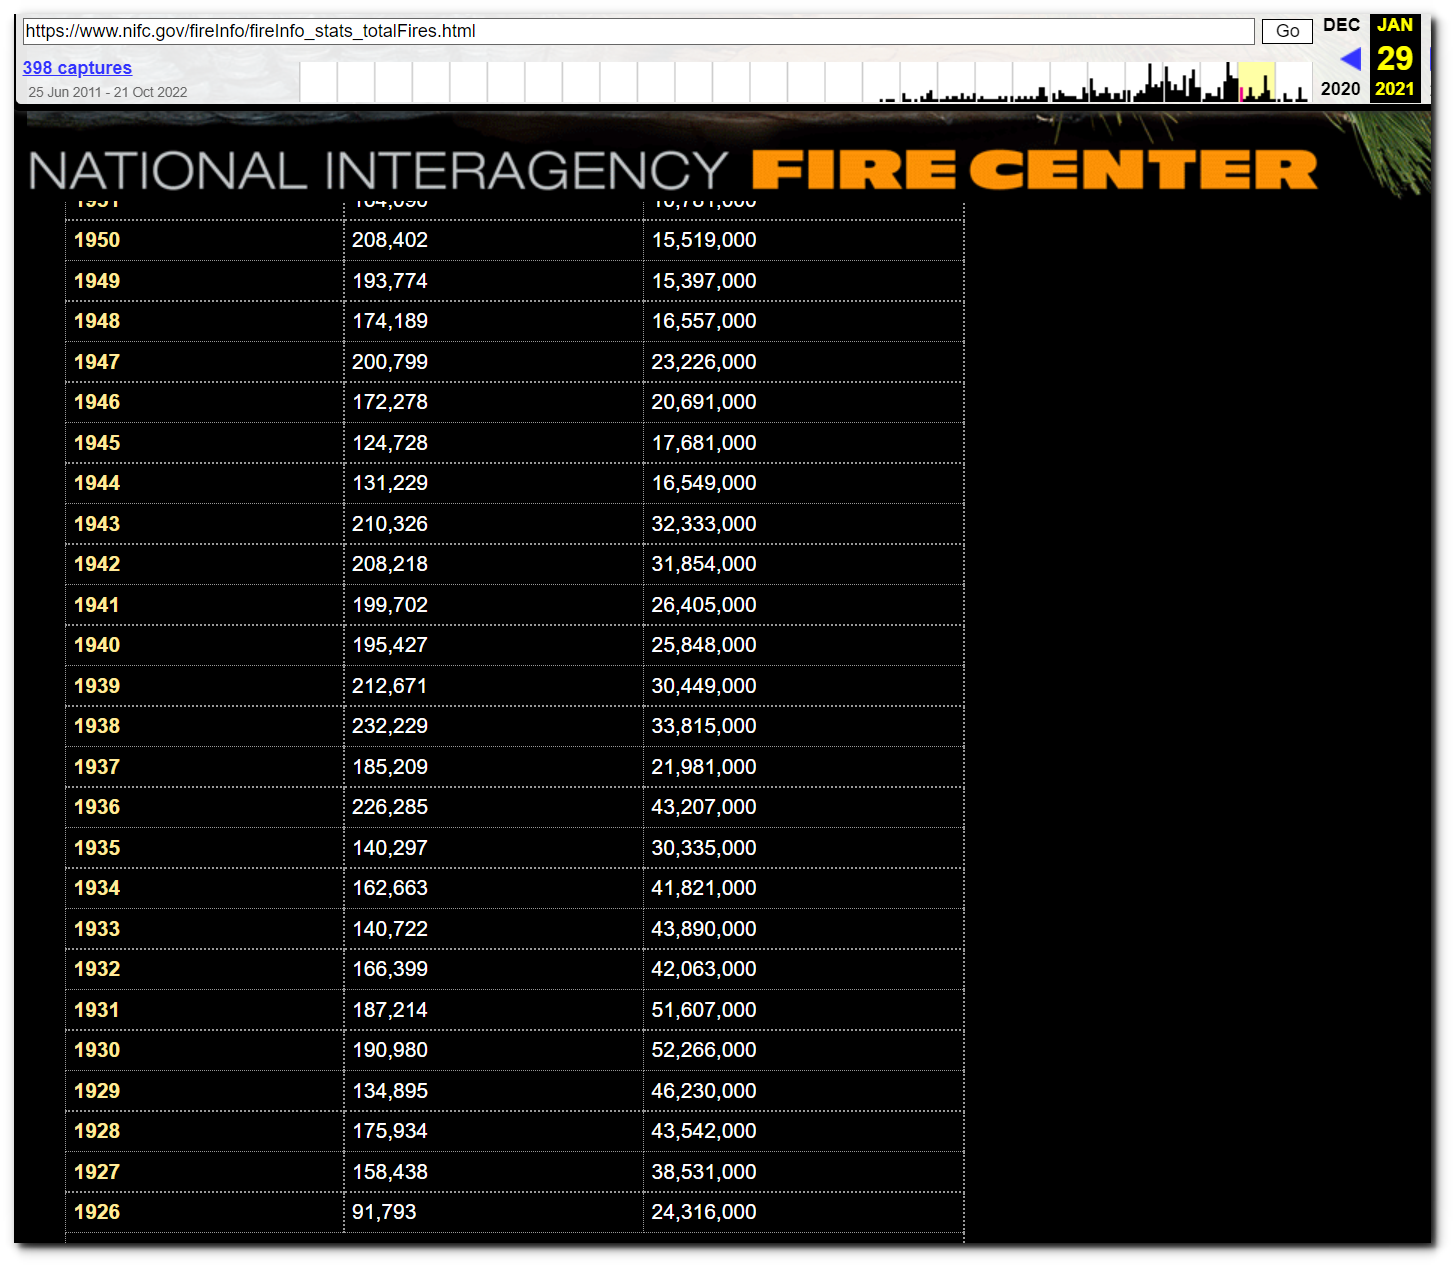
National Interagency Fire Center
All pre-1983 data was quickly deleted. 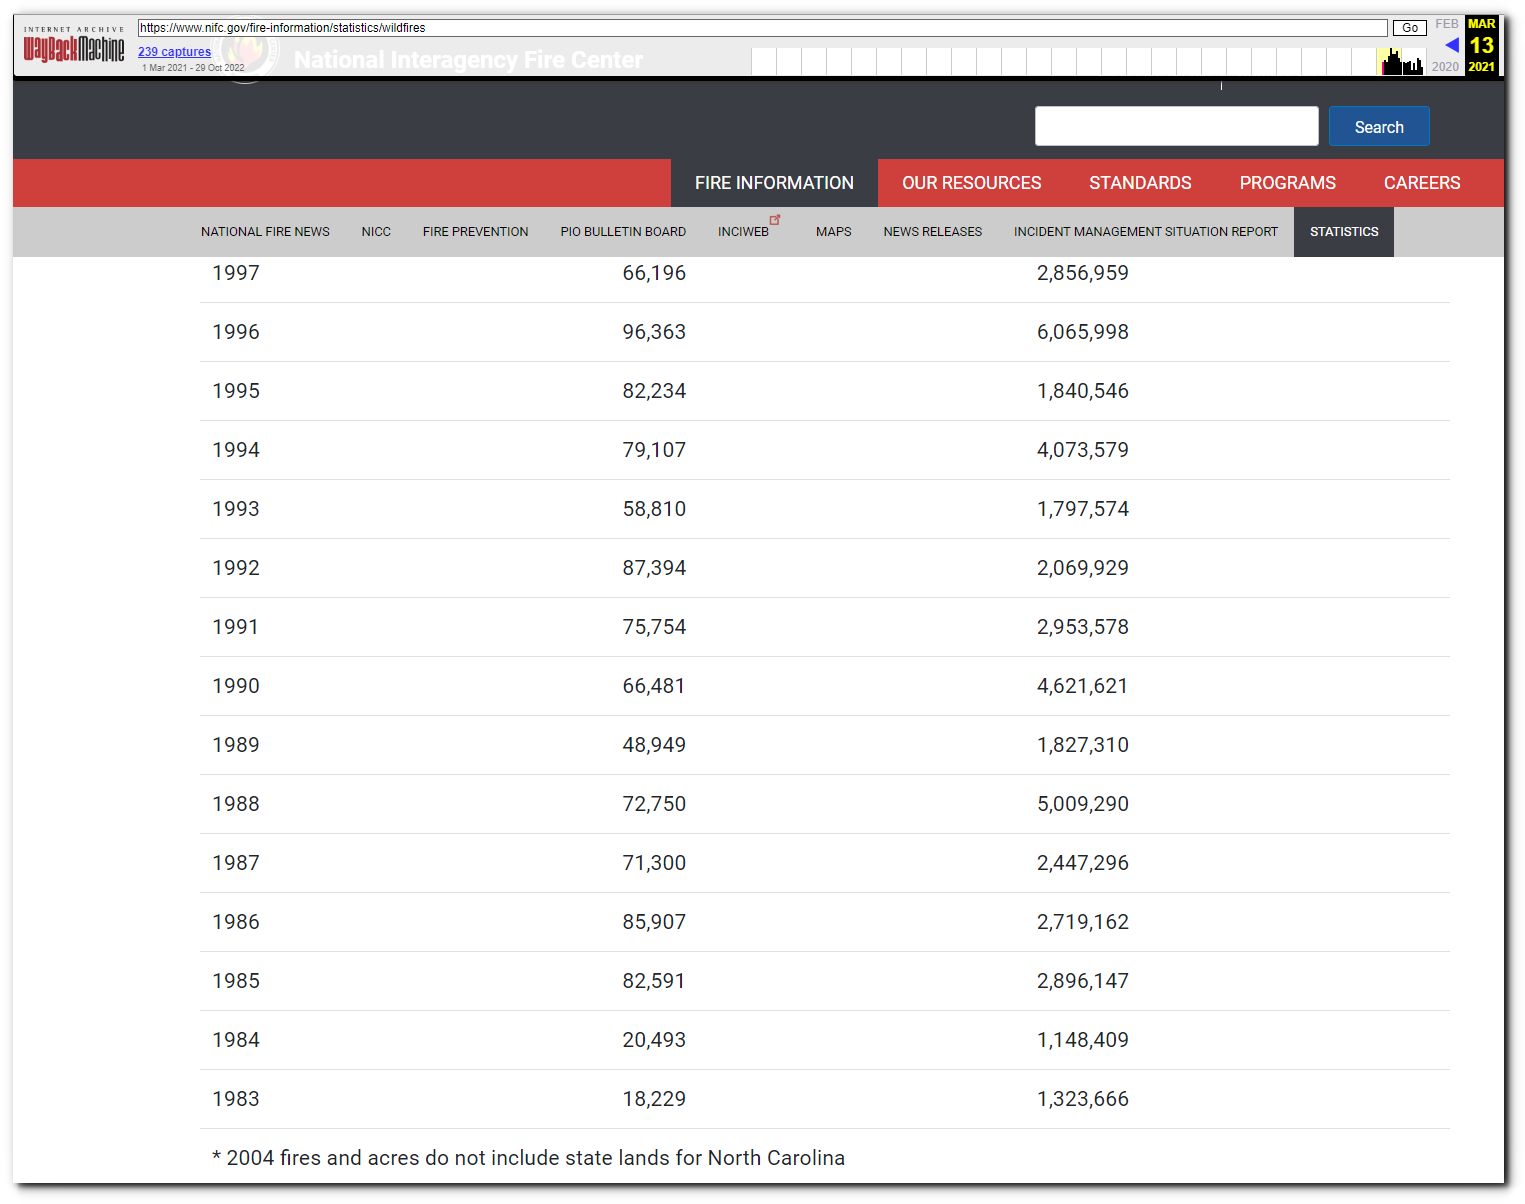
Wildfires and Acres | National Interagency Fire Center
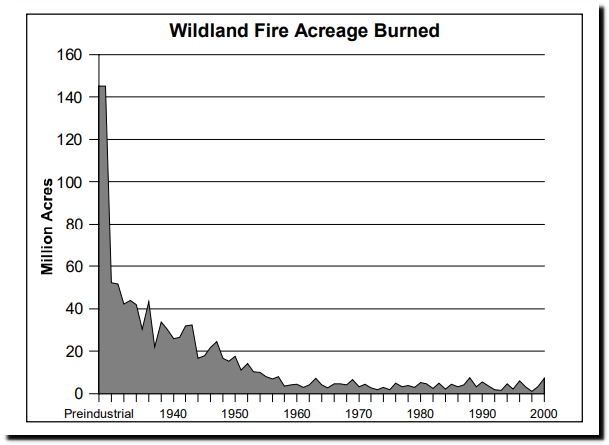
Looking at the entire data set, there is no correlation between CO2 and burn acreage.
As of November 1, 2020 this document was on the NIFC website, but it woo was quickly deleted by the Biden cabal.
“Historically, fire has been a frequent and major ecological factor in North America. In the conterminous United States during the preindustrial period (1500- 1800), an average of 145 million acres burned annually. Today only 14 million acres (federal and non-federal) are burned annually by wildland fire from all ignition sources”.
1995 FEDERAL WILDLAND FIRE MANA GE ME NT POLICY
FederalWildlandFireManagementPolicy_2001