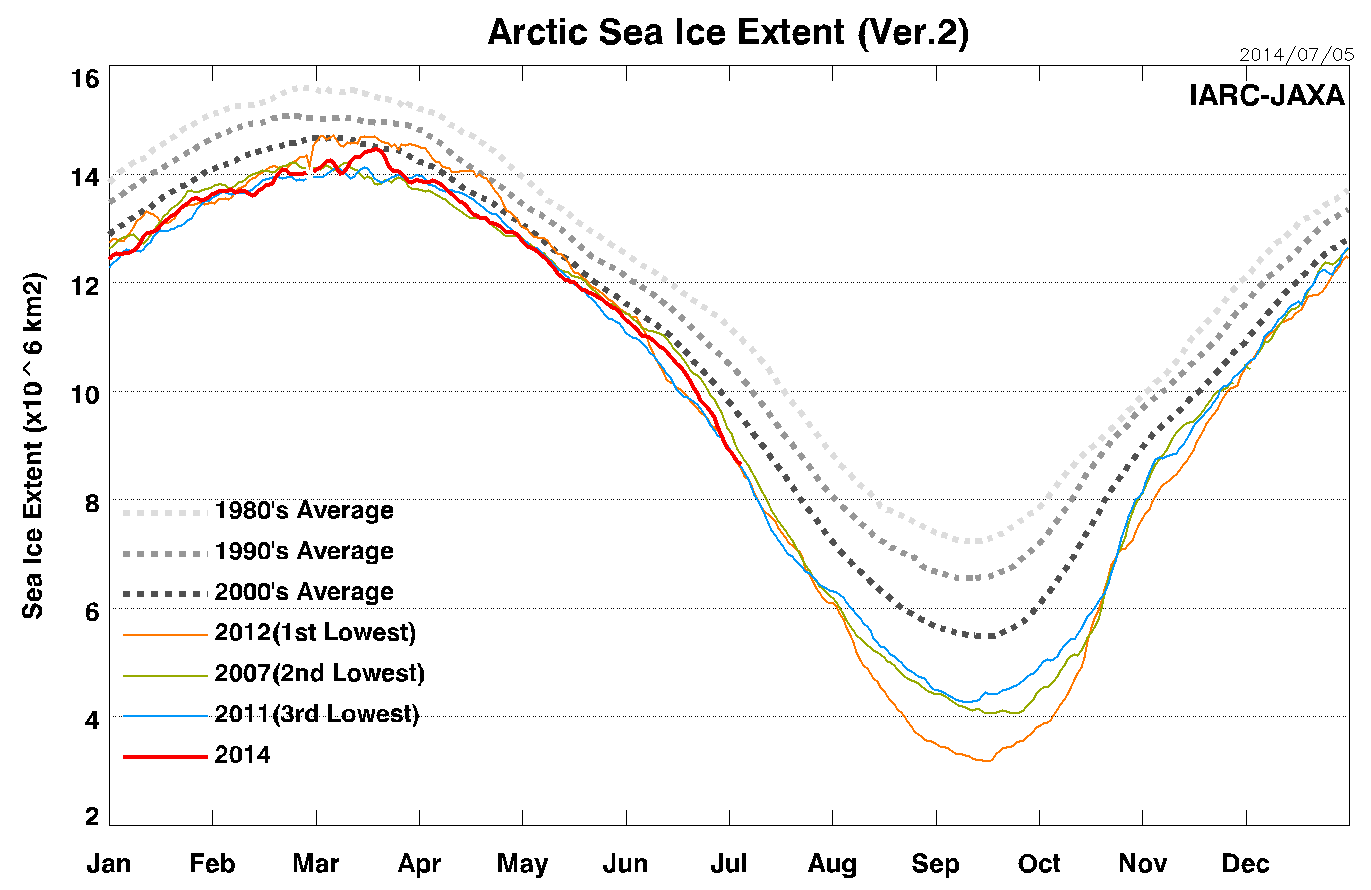
I am absolutely certain that three weeks from now, we will be able to look back and tell our children that … this was the moment when the summer 2014 melt of the Arctic began to slow (for a week or two.)
– Me July 6, 2014
Disrupting the Borg is expensive and time consuming!
Google Search
-
Recent Posts
- Analyzing The Western Water Crisis
- Gaslighting 1924
- “Why Do You Resist?”
- Climate Attribution Model
- Fact Checking NASA
- Fact Checking Grok
- Fact Checking The New York Times
- New Visitech Features
- Ice-Free Arctic By 2014
- Debt-Free US Treasury Forecast
- Analyzing Big City Crime (Part 2)
- Analyzing Big City Crime
- UK Migration Caused By Global Warming
- Climate Attribution In Greece
- “Brown: ’50 days to save world'”
- The Catastrophic Influence of Bovine Methane Emissions on Extraterrestrial Climate Patterns
- Posting On X
- Seventeen Years Of Fun
- The Importance Of Good Tools
- Temperature Shifts At Blue Hill, MA
- CO2²
- Time Of Observation Bias
- Climate Scamming For Profit
- Climate Scamming For Profit
- Back To The Future
Recent Comments
- Bob G on Analyzing The Western Water Crisis
- Bob G on Analyzing The Western Water Crisis
- Bob G on Analyzing The Western Water Crisis
- arn on Analyzing The Western Water Crisis
- Scott Allen on Analyzing The Western Water Crisis
- conrad ziefle on Analyzing The Western Water Crisis
- conrad ziefle on Analyzing The Western Water Crisis
- Bob G on Analyzing The Western Water Crisis
- Bob G on Analyzing The Western Water Crisis
- Bob G on Gaslighting 1924


The anomalies of “cryosphere today” for the late 70’s, 80’s and 90’s up to 1995 are very similar, with no evident trend downward.
JAXA analysis is notoriously warmist.
Independently of what the warmists say, we could be back to 2005-06 levels this year… all we need is a little lower level of solar radiations.
If the radiations stabilize at the levels of last month or below, I have no doubt that at some point of the 2nd semester (probably at the end of the year) the Arctic ice will be back to average or above.
Right now, I’d be very glad to see the final melt in September just repeating the good result of 2013.
Not that I disagree in any way but when you say “back to the average” what is the average and over what time. We do not have an average as I understand things,
I didn’t say any such thing.
I meant, the 1979-2008 mean value, as in the cryosphere graph,
http://arctic.atmos.uiuc.edu/cryosphere/IMAGES/seaice.anomaly.arctic.png
The ice should reach the mean at the end of the year.
Welllllllll, yes, except for the magic finger on the scale. My prediction is that even at levels exceeding the 70’s, official publications will pronounce them to be less.
35+% of the temps are fake, why should they stop there?
Where is Reggie? It’s heading for perfect kayak and canoe season.
In July 2012, Alarmists were up in arms about the Petermann glacier calving.
http://en.wikipedia.org/wiki/Petermann_Glacier
Today it is choked with sea ice and the glacier is growing again.
http://www.arctic.io/explorer/
Australia’s carbon taxscam is so powerful, it freezes Greenland as well as Antarctica.
When do you think they’ll get around to putting in a new dashed line for the 2010’s average?
I think they’ve already computed it, and didn’t like the results. It probably shows current values close to (or above) that “average” line.
“Future generations will wonder in bemused amazement that the early 21st century’s developed world went into hysterical panic over a globally averaged temperature increase of a few tenths of a degree, and, on the basis of gross exaggerations of highly uncertain computer projections combined into implausible chains of inference, proceeded to contemplate a roll-back of the industrial age.”
Dr. Richard Lindzen. Massachusetts Institute of Technology Professor of Atmospheric Science