Massive Decline In The Integrity Of NOAA

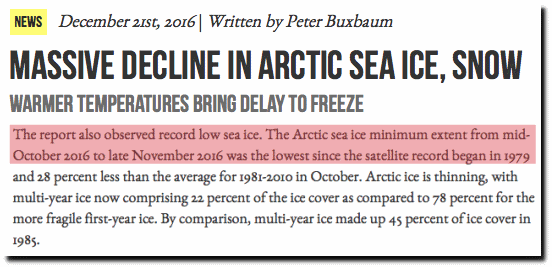
NOAA reports a massive decline Arctic sea ice and snow through late November, and that their satellite records for sea ice began in 1979.


Massive Decline in Arctic Sea Ice, Snow | Global Trade Magazine

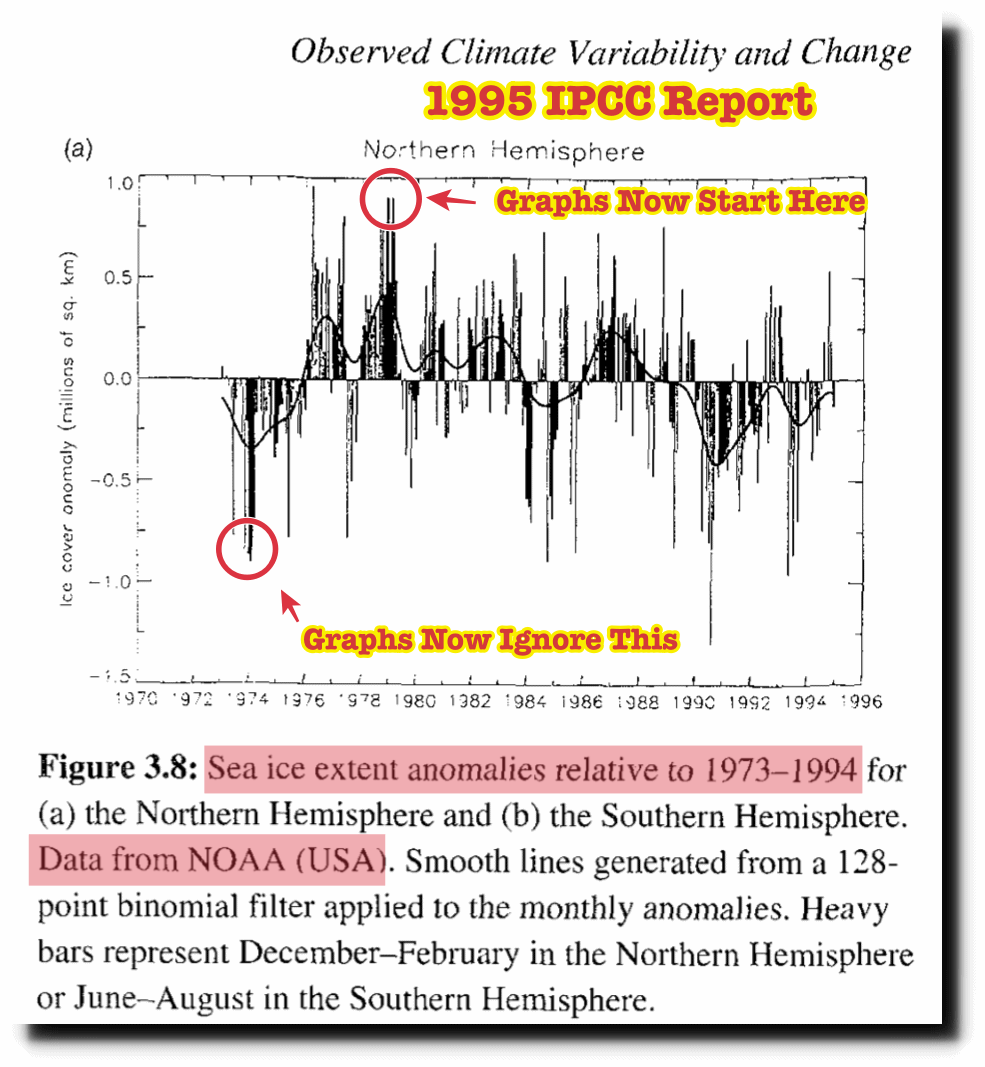
NOAA satellite records actually extend back much further than 1979, but NOAA hides them because 1979 was the peak and the earlier records wreck their scam. Ice extent in 1974 was nearly two million km² lower in 1974 than it was in 1979.

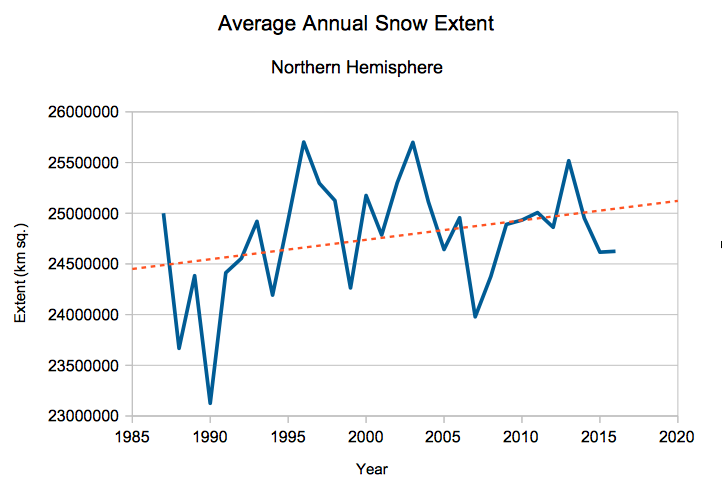
The massive decline in snow reported by NOAA is actually a massive increase. Snow extent  this autumn was the second highest on record.

Rutgers University Climate Lab :: Global Snow Lab

For the entire year, snow extent has increased substantially over the past 30 years.

?climate.rutgers.edu/snowcover/files/moncov.nhland.txt

Basically, everything you hear about climate from the government and press is fake news. It is intended to mislead, not inform.

Posted in Uncategorized | Leave a comment

Coldest Weather I Have Ever Seen

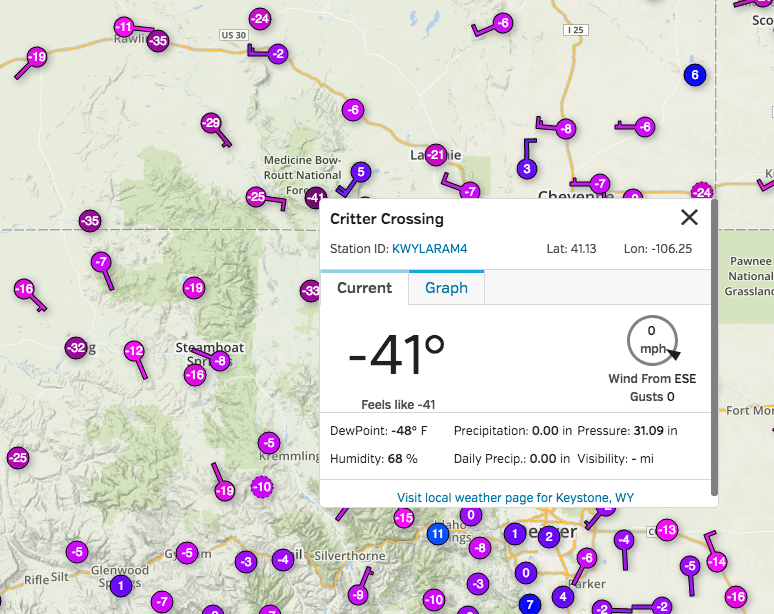
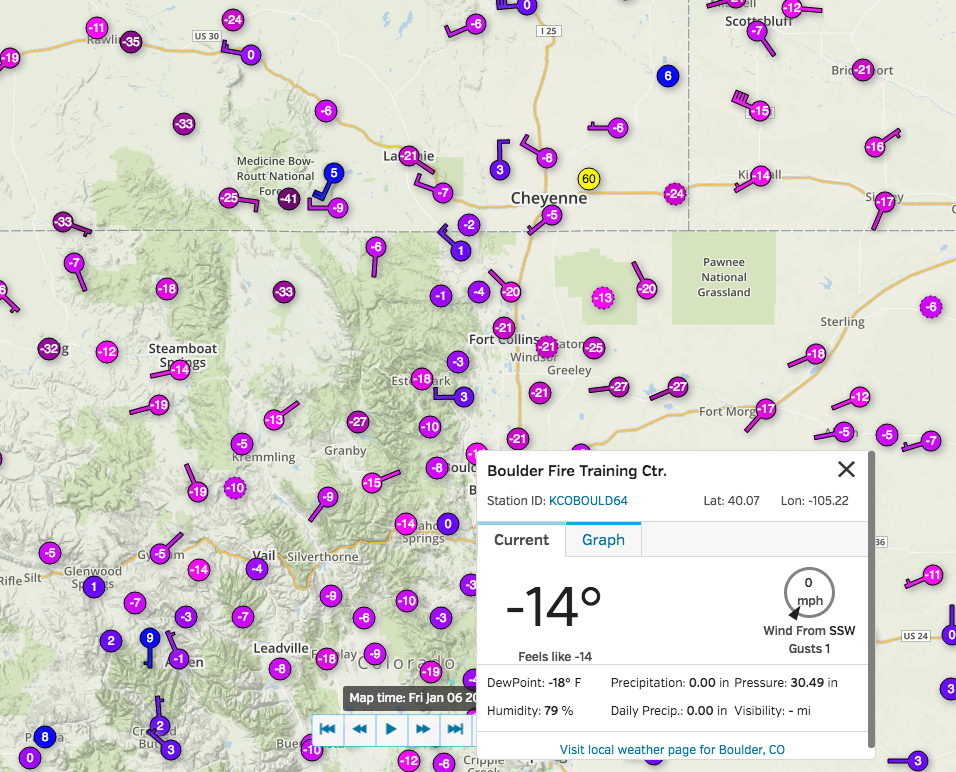
It is currently -14F in Boulder and -41F across the border in Wyoming. I have never seen temperatures this cold before.

Posted in Uncategorized | Leave a comment

Researching The Thing Of The Past

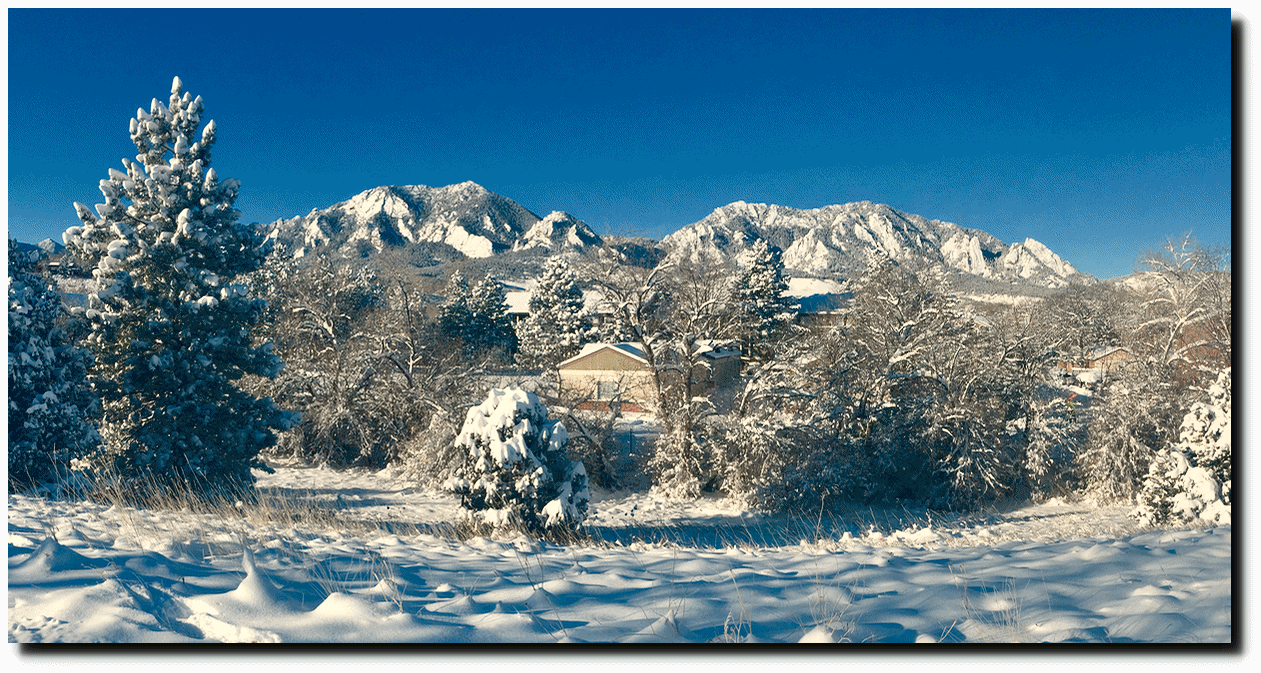
Our leading climate experts say that snowfalls ended 17 years ago.

Snowfalls are now just a thing of the past – Environment – The Independent

My research assistants and I investigated that theory this morning, and came to the conclusion that climate scientists are complete morons.

Posted in Uncategorized | Leave a comment

The Progressive Data Tampering Continues Unabated

You can’t make this stuff up. One layer of temperature fraud piled on another.

RSS lower troposphere temperature data shows that cooling over the last 10 months has been the fastest on record.
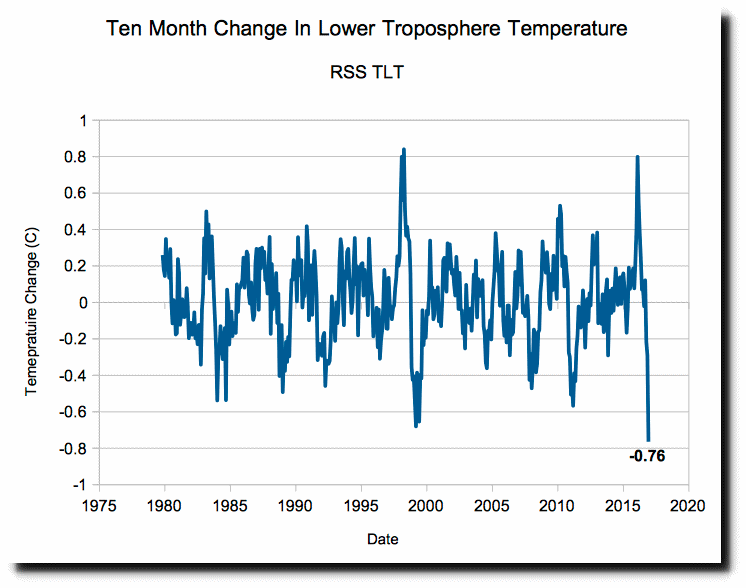
RSS_TS_channel_TLT_Global_Land_And_Sea_v03_3.txt

So Carl Mears of RSS rushed out a press release today saying 2016 was the hottest year, not to use lower troposphere temperatures, and instead imagine we live at 20,000+ feet.

?images.remss.com/papers/rsstech/Jan_5_2017_news_release.pdf

Meanwhile, yesterday, Zeke Hausfather told the press that there never was a hiatus. (The same hiatus which experts made dozens of excuses for over the past decade, and Michael Mann says is real.)

Today, Zeke says we should compare GISS surface temperatures to Carl Mears upper troposphere temperatures, and ignore all those air temperatures down near where we live.
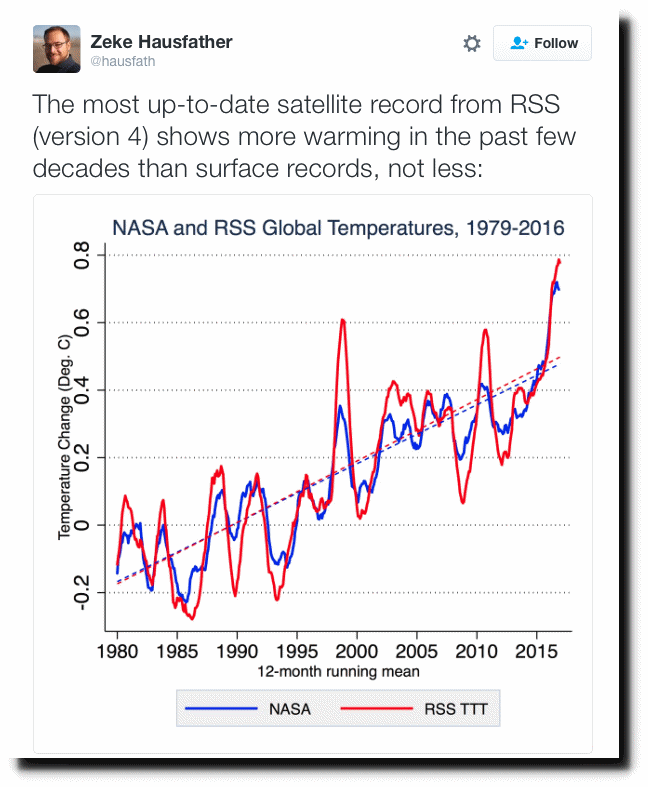
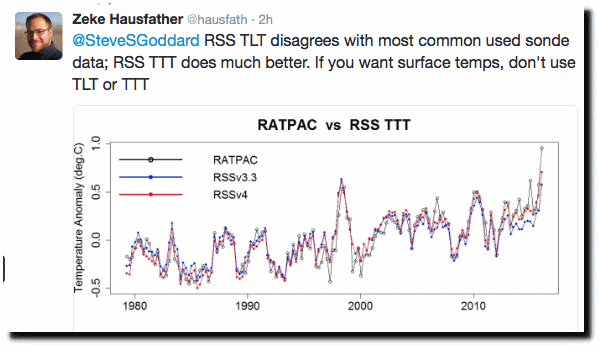
But here comes the fun part. Zeke then said to compare the upper troposphere temperatures with the “most commonly used sonde data (RATPAC)

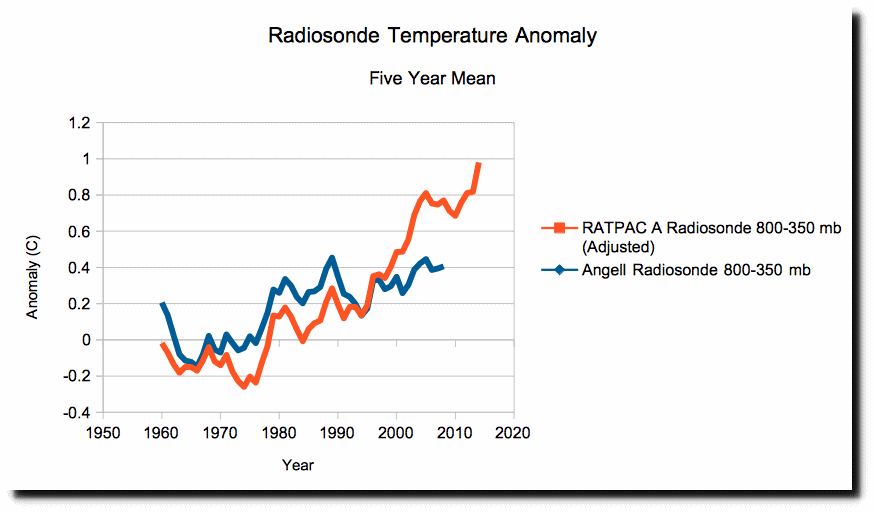
So why is Zeke using RATPAC data?  Because it is heavily adjusted. RATPAC adjustments quadrupled warming relative to the raw radiosonde data generated by Jim Angell at NOAA since 1958
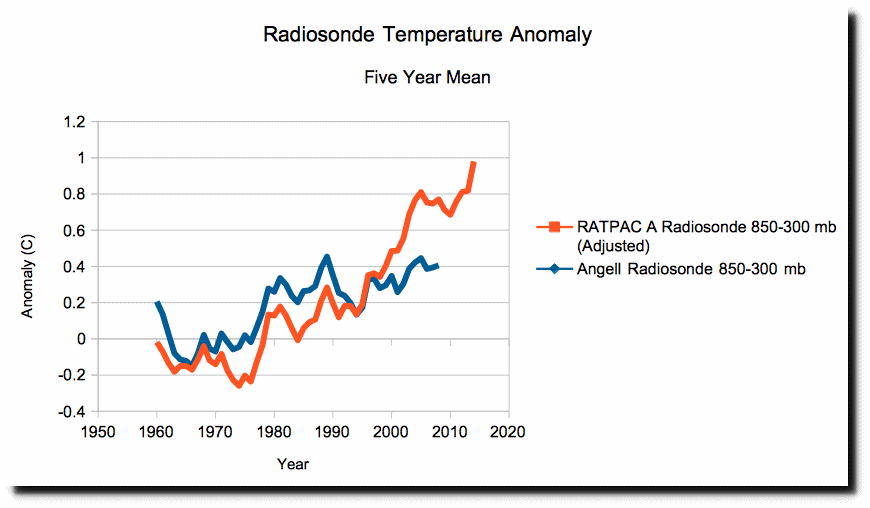
 

Angell     RATPAC

The hockey stick of adjustments to the radiosonde data mirrors all the fake adjustments done to surface temperature data sets by NASA and NOAA.

So how does this all tie together?  RSS lower troposphere data matches radiosonde data very closely, until they tamper with the radiosonde data. So they altered the radiosonde data and used the altered data as an excuse to ignore and eventually tamper with the lower troposphere data.
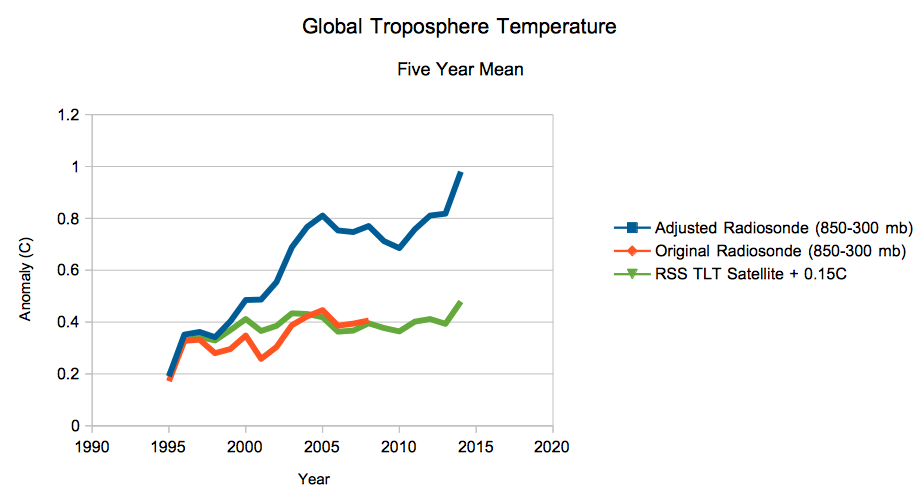
In the 1995 IPCC report, none of the data sets (surface, radiosonde, or satellite) showed any net warming from 1958 to 1995.

Essentially all of the warming since 1958 is due to data tampering. The game they play is to adjust one data set upwards, then use the adjusted data as an excuse to successively adjust all the other ones upwards to match, in a domino effect. This was aptly described in the Climategate E-mails as “hiding the decline.”

Posted in Uncategorized | Leave a comment

Earth Cooling At The Fastest Rate On Record

Global temperatures have plummeted this year at a record rate. Over the last ten months, temperatures have dropped more than three quarters of a degree, breaking the previous global cooling record set in 1999.

RSS_TS_channel_TLT_Global_Land_And_Sea_v03_3.txt

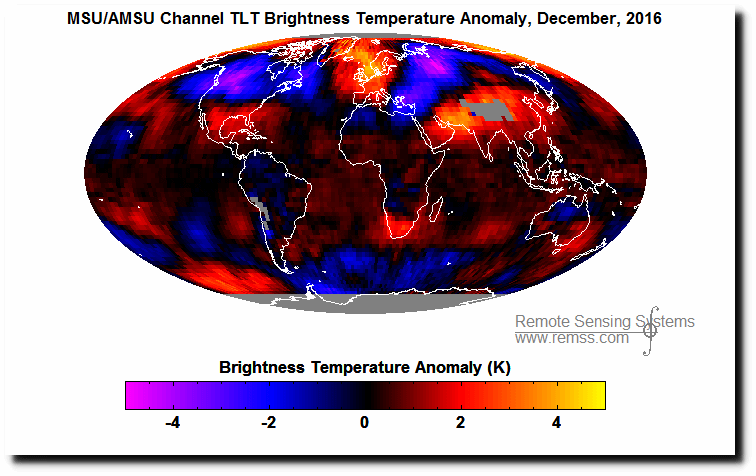
Much of the Arctic was extremely cold last month, not “super-hot” as claimed by the Washington Post.

ch_tlt_2016_12_anom_v03_3.png

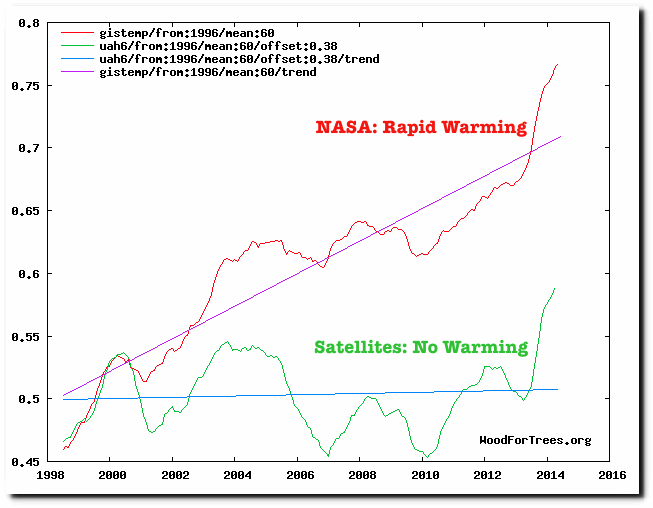
Satellites show that there has been little or no warming for 20 years.

Wood for Trees: Interactive Graphs

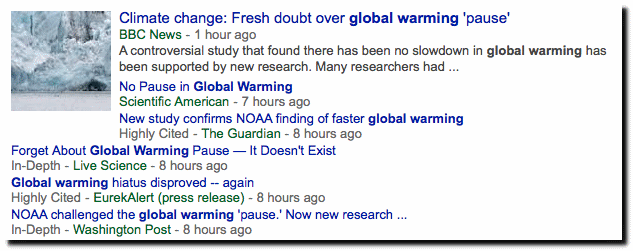
Meanwhile criminals working for government agencies and their cohorts in the press are doing their best to hide the news – screaming today that global warming is accelerating and there was no hiatus.

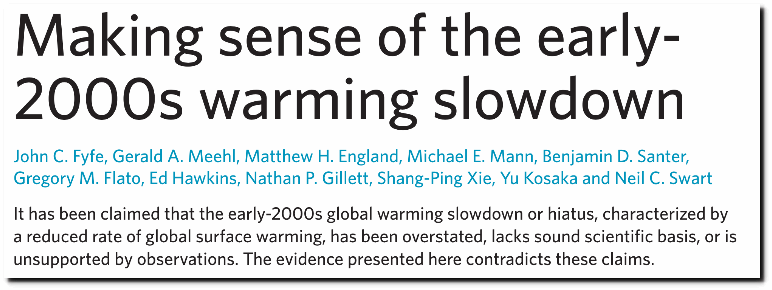
These claims from today’s fraudsters directly contradict their top fraudster Michael Mann, who says there was a hiatus.

Making sense of the early-2000s warming slowdown : Nature Climate Change

There is no settled science. There is no consensus. There is no climate science, period. Just a group of criminals who are terrified that their global warming scam is about to end. Climate scientists make Enron accountants look like saints.

“Oh, what a tangled web we weave…when first we practice to deceive.”

  • Sir Walter Scott
Posted in Uncategorized | Leave a comment

No Global Warming For 25 Years

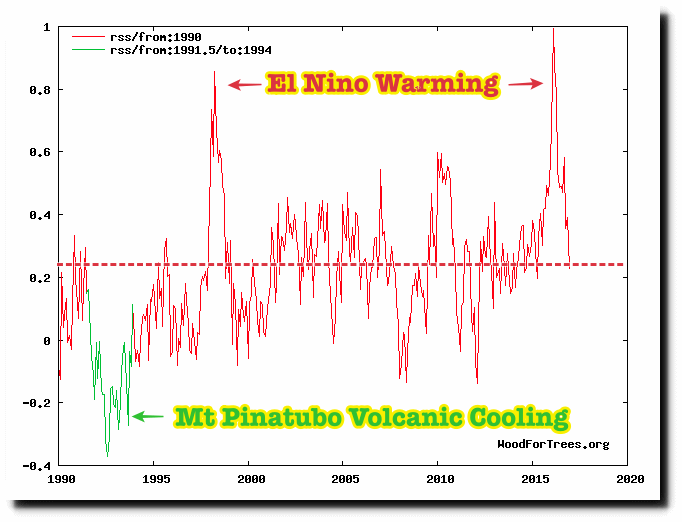
Earth is the same temperature as 25 years ago. All temperature variations since then are artifacts of El Nino and volcanic eruptions.

Wood for Trees: Interactive Graphs

Global warming is the biggest fraud in science history. The Earth is not warming.

Wood for Trees: Interactive Graphs

Posted in Uncategorized | Leave a comment

Dirty Snow Causing Decline In Spring/Summer Snow Cover

2016-11-15104723

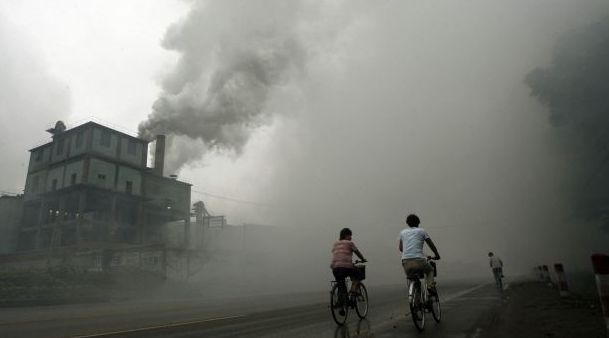
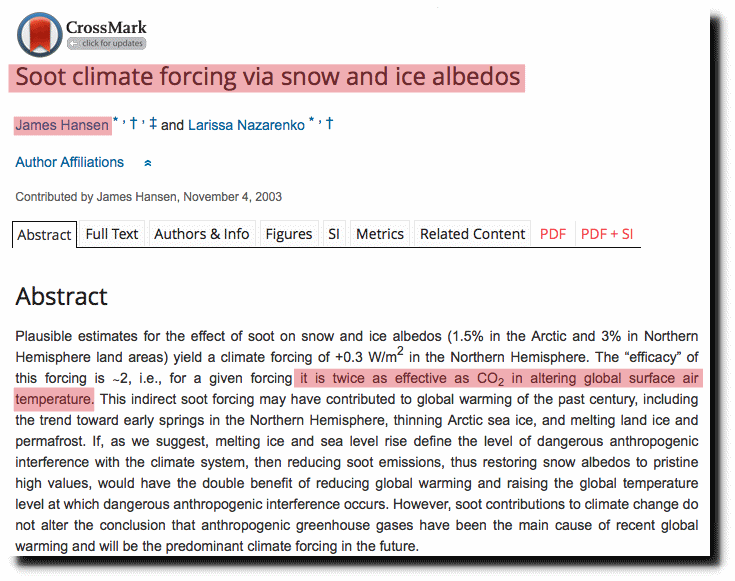
Autumn/Winter snow cover is rapidly expanding in the Northern Hemisphere, but Spring/Summer snow cover is down. The decline in Spring/Summer snow cover is caused by pollution from places like China. Dark particulates settle on the snow, causing melting. Scientists have known this for years, but blame CO2 because they get paid to do that.

for a given forcing (soot) is twice as effective as CO2 in altering global surface air temperature. This indirect soot forcing may have contributed to global warming of the past century, including the trend toward early springs in the Northern Hemisphere

  • James Hansen  NASA

Soot climate forcing via snow and ice albedos

Dirty snow may warm Arctic as much as greenhouse gases

Tamino blames CO2 for this, because he understands nothing about science.

Posted in Uncategorized | Leave a comment

Democrats Announce Plan To Destroy Their Own Party

After whining incessantly for years about the evils of obstruction, Senator Chuck Schumer of New York has just announced his plan to obstruct the will of the American people for the next two years.

With 24 Democratic Senate seats up for re-election in 2018, Senator Schumer’s plan should finish off the Democratic Party once and for all.

Posted in Uncategorized | Leave a comment

Northern Hemisphere Temperature Fraud From Gavin Schmidt

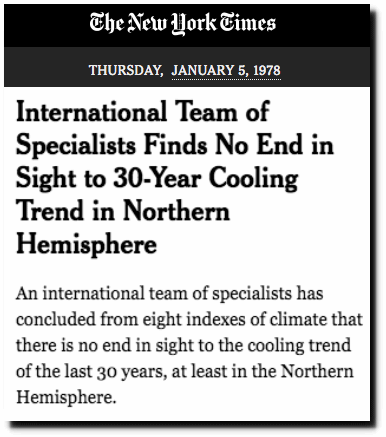
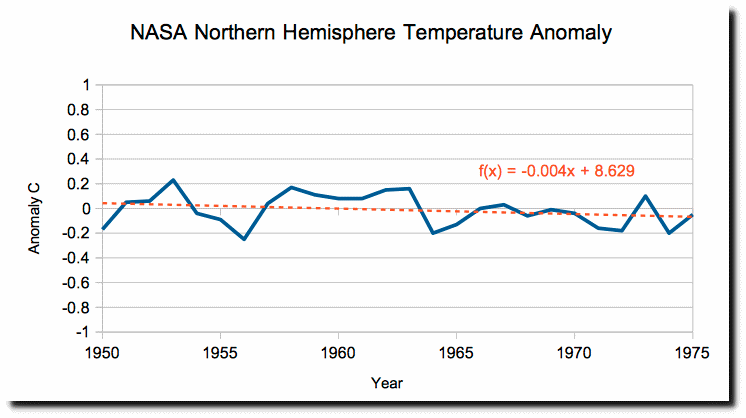
Thirty-nine years ago today, experts reported a northern hemisphere cooling trend of 0.1C to 0.2C per decade from 1950 to 1975.

The report, prepared by German, Japanese and American specialists, appears in the Dec. 15 issue of Nature, the British journal. The findings indicate that from 1950 to 1975 the cooling, per decade, of most climate indexes in the Northern Hemisphere was from 0.1 to 0.2 degrees Celsius, roughly 0.2 to 0.4 degrees Fahrenheit.

International Team of Specialists Finds No End in Sight to 30?Year Cooling Trend in Northern Hemisphere – The New York Times

NASA used to show this cooling trend, but has now made it almost entirely disappear.

Hemispheric_Temperature_Change/graph.csv

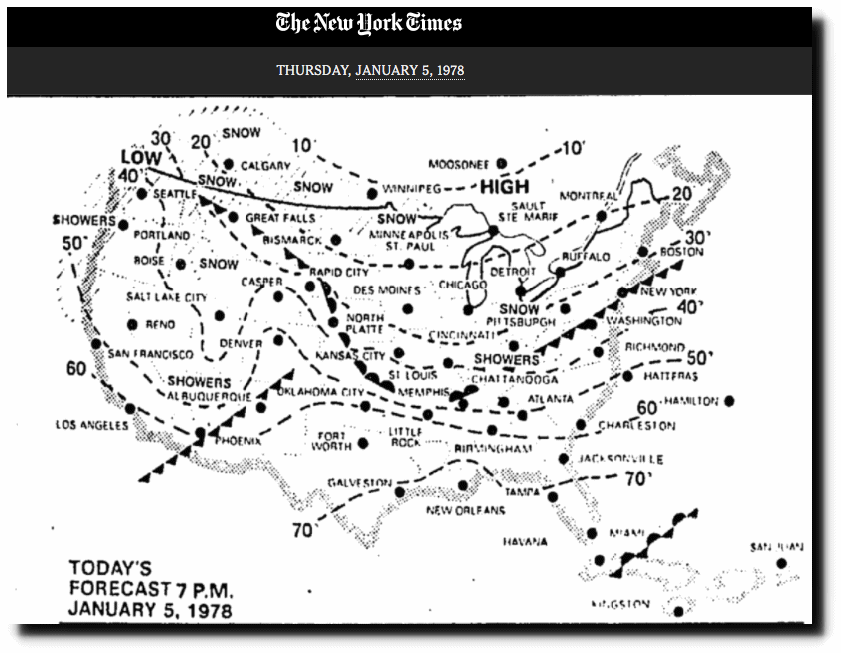
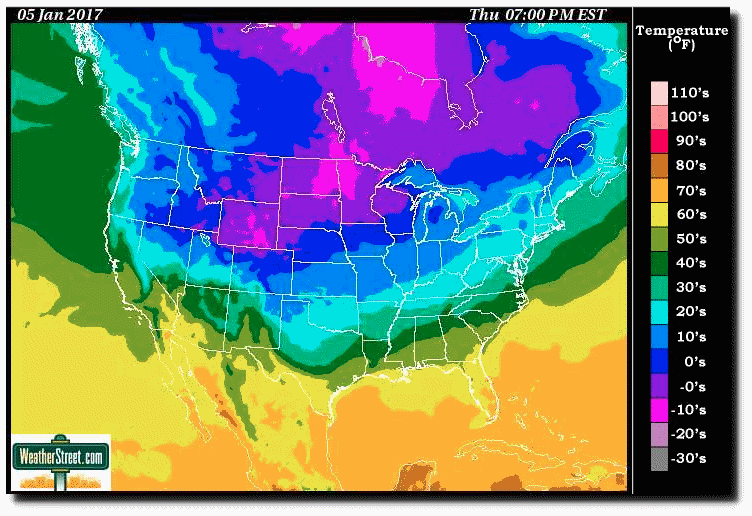
The winter of 1978 was the coldest on record in the US, yet this date in 1978 was much warmer than today’s temperatures.

Posted in Uncategorized | Leave a comment

95% Confidence That NASA Temperature Records Are Fraudulent

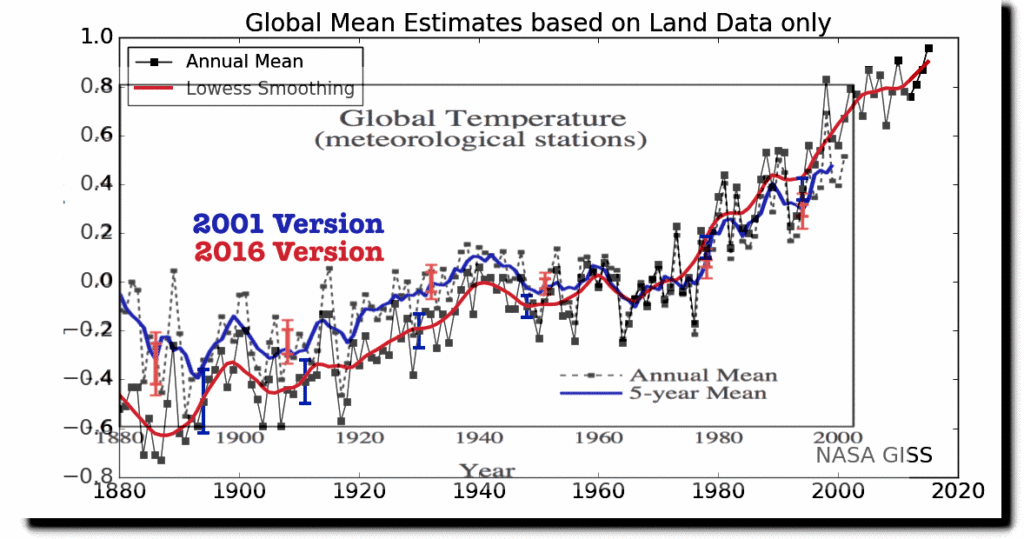
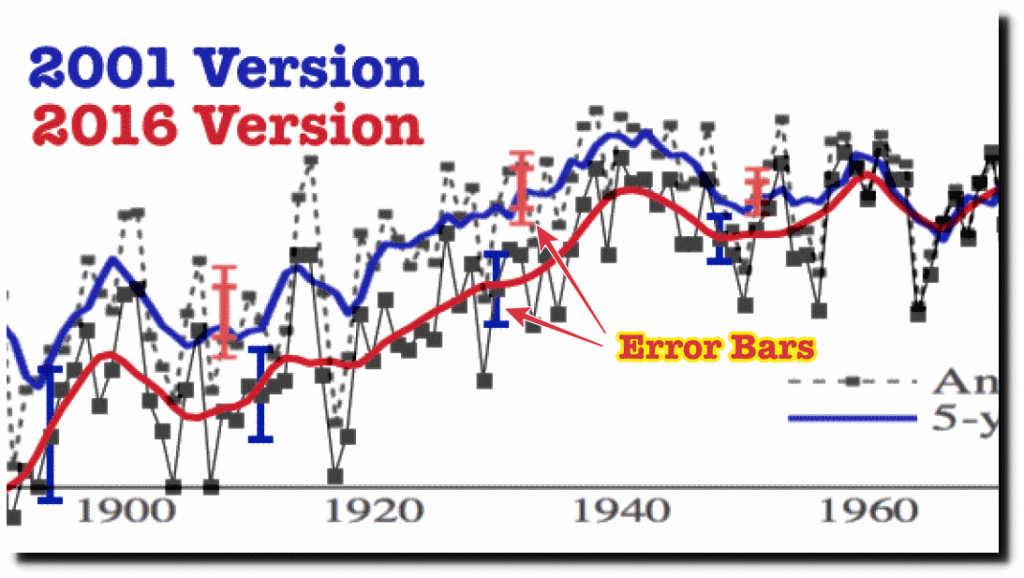
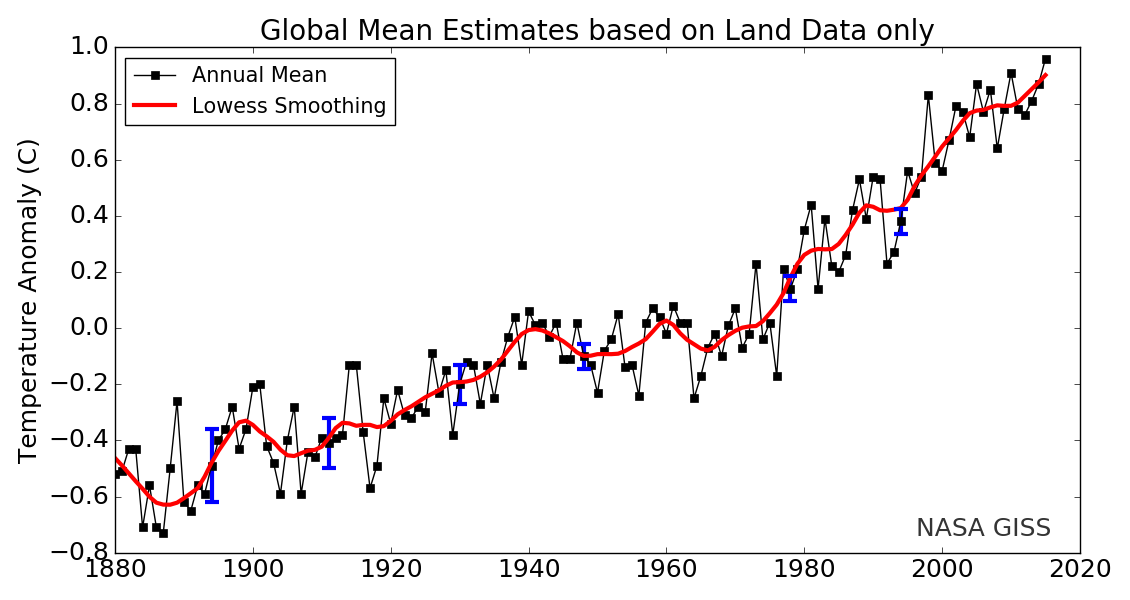
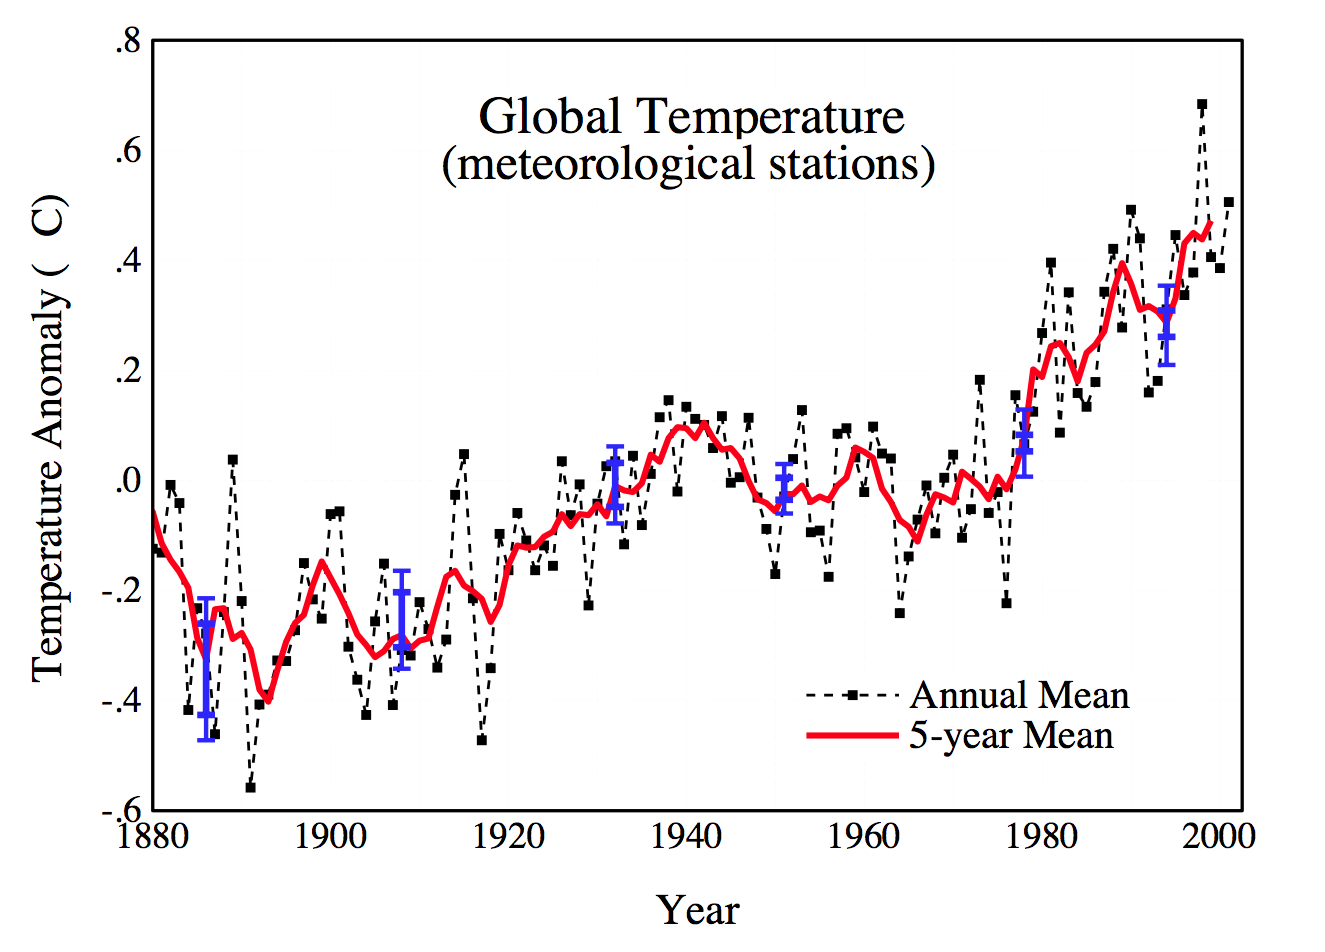
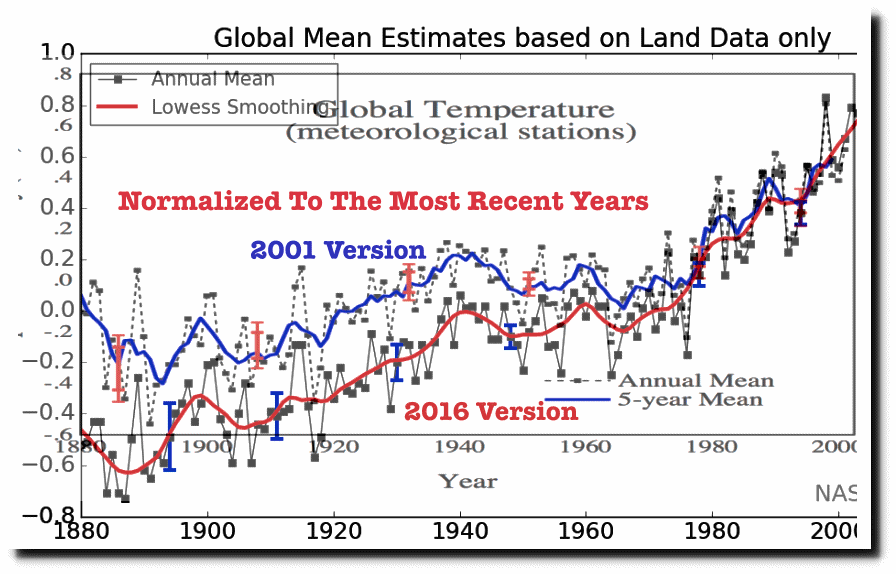
In 2001, NASA graphs showed 0.5C warming from 1880 to 1998. Now they show 1.1C warming during that same period. The image below overlays the two NASA graphs, with the colors shifted in the 2001 version for clarity.

Gavin Schmidt has more than doubled warming by altering the data. Even worse, Gavin has altered the data far outside his own 95% confidence bounds. The 2001 confidence bounds are shown as the red vertical bars, and the 2016 confidence bounds are shown as the blue vertical bars.  This is a smoking gun that Gavin’s data is fake, and his confidence intervals are meaningless.

2001 version                 2016 version

2016 version

2001 version

But Gavin’s fraud is worse than it seems. He uses an optical illusion to minimize the appearance of tampering. By adjusting pre-197o temperatures down, and post-1970 temperatures up, the magnitude of the tampering is harder to see. In order to better visualize the fraud, I normalized the graphs to the five year mean of the most recent common years.

Global warming is the biggest scam in science history.

Posted in Uncategorized | Leave a comment