Be Careful With Absolute Temperatures

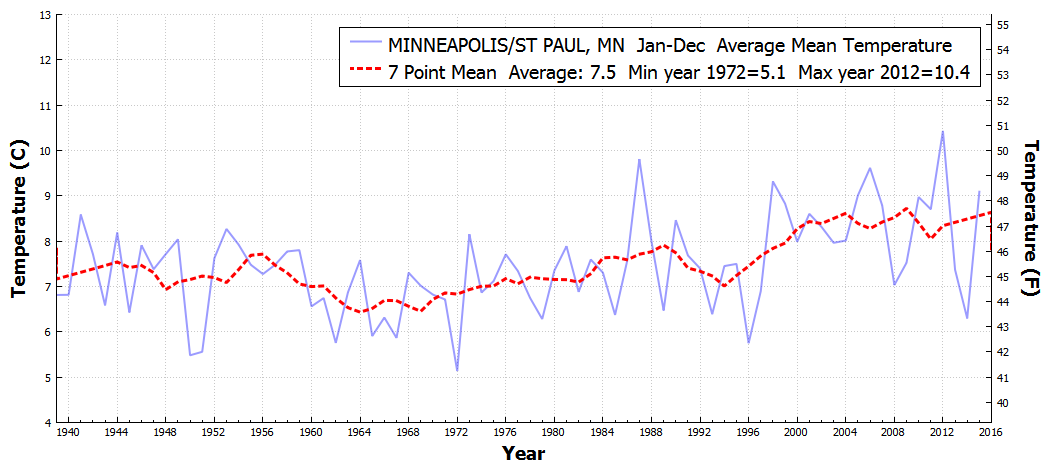
If you plot full year temperatures, 2016 looks cold – because there are no temperatures for summer averaged in. Summer 2016 hasn’t happened yet.

STPAUL_MN_AverageMeanTemperature_Jan_Dec_1940_2016

There are two solutions to this.

  1. Don’t plot the current year.

STPAUL_MN_AverageMeanTemperature_Jan_Dec_1940_2015

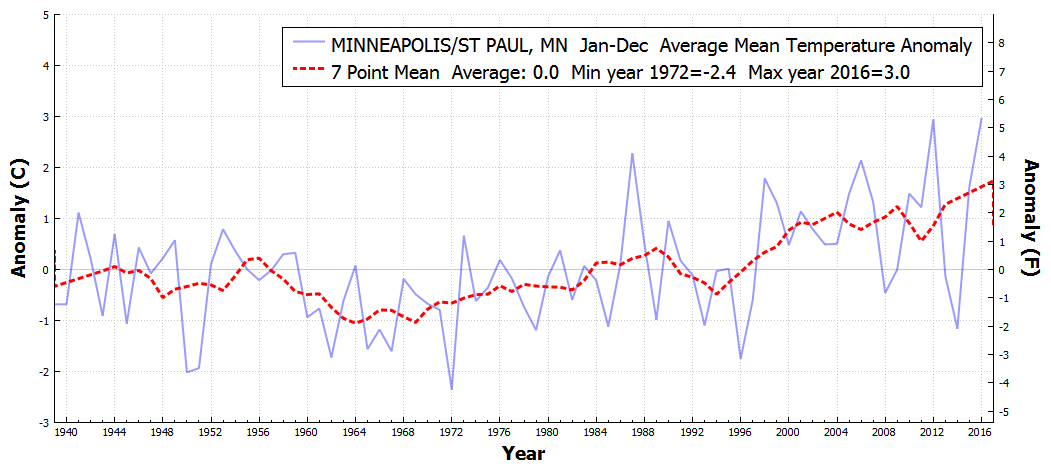
2. You can use anomalies instead of absolute temperatures. This is deceptive though because it isn’t representative of the full year either.

STPAUL_MN_AverageMeanTemperatureAnomaly_Jan_Dec_1940_2016

About Tony Heller

Just having fun
This entry was posted in Uncategorized. Bookmark the permalink.

Leave a Reply

Your email address will not be published. Required fields are marked *