Disrupting the Borg is expensive and time consuming!
Google Search
-
Recent Posts
- Is Antarctica Melting?
- High Speed Analysis And Visualization
- El Nino To The Rescue?
- Fake News Update
- Growth Of Antarctic Sea Ice
- 65 Years Of Progress!
- El Nino To The Rescue?
- Worst March Drought On Record
- ChartGL Process Control Demo
- The Biggest Money Laundering Scam
- Drought In The Headwaters Of Lake Powell
- Unrealistic Expectations Of Water Availability
- Did Bill Gates Do This?
- Worst March Drought On Record In The US
- The Real Hockey Stick Graph
- Analyzing The Western Water Crisis
- Gaslighting 1924
- “Why Do You Resist?”
- Climate Attribution Model
- Fact Checking NASA
- Fact Checking Grok
- Fact Checking The New York Times
- New Visitech Features
- Ice-Free Arctic By 2014
- Debt-Free US Treasury Forecast
Recent Comments
- Bob G on Is Antarctica Melting?
- Peter Carroll on Is Antarctica Melting?
- Bob G on Is Antarctica Melting?
- conrad ziefle on Is Antarctica Melting?
- Gordon Vigurs on Is Antarctica Melting?
- Bob G on Is Antarctica Melting?
- conrad ziefle on High Speed Analysis And Visualization
- Bob G on 65 Years Of Progress!
Top December News
California progressives call for complete ban on Japanese entering the country.
Exxon warns of 12 degrees warming if you purchase their products.
It is hug a terrorist week in the UK
Progressives are very angry that Trump wants to keep this out of the country.
If you see something, don’t say something. You will get sued.
Posted in Uncategorized
19 Comments
Repeated Acts Of Data Terror By NASA
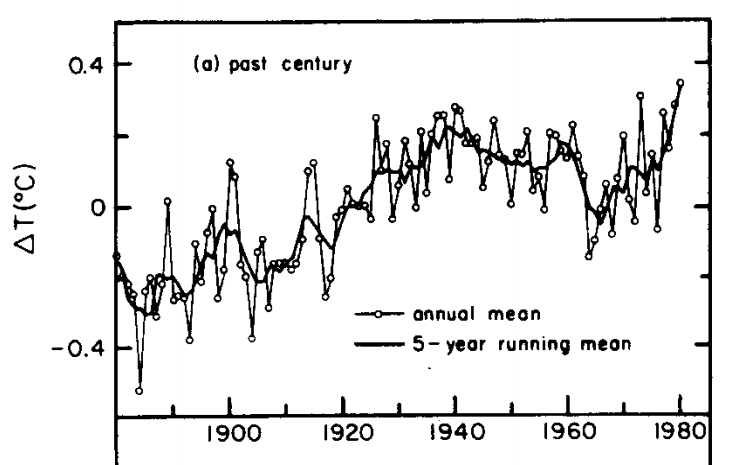
NASA temperature data tampering is not a one time venture. It occurs repeatedly and has completely corrupted the temperature record. In 1981, NASA showed 0.4 C warming from 1880 to 1980
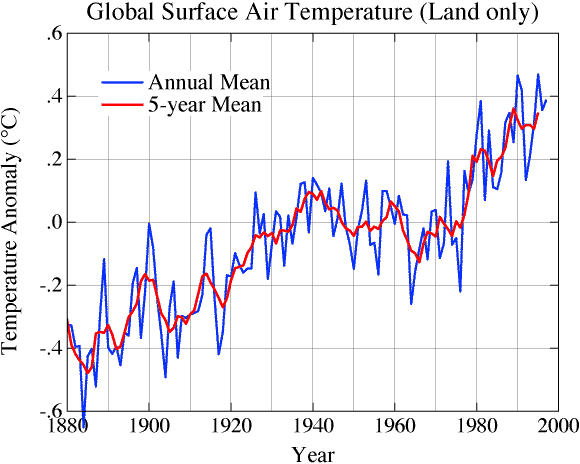
By 1997, they had bumped it up to 0.6C warming from 1880 to 1980
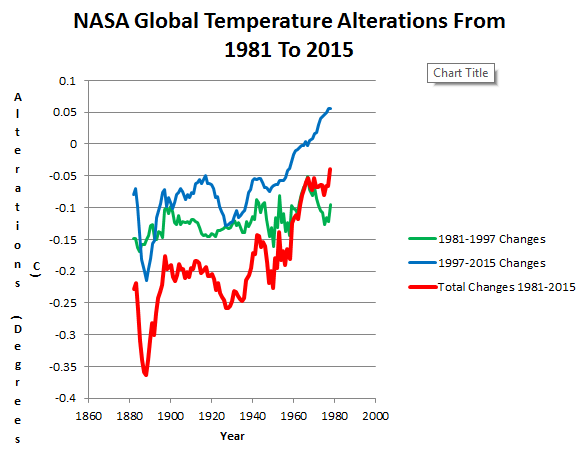
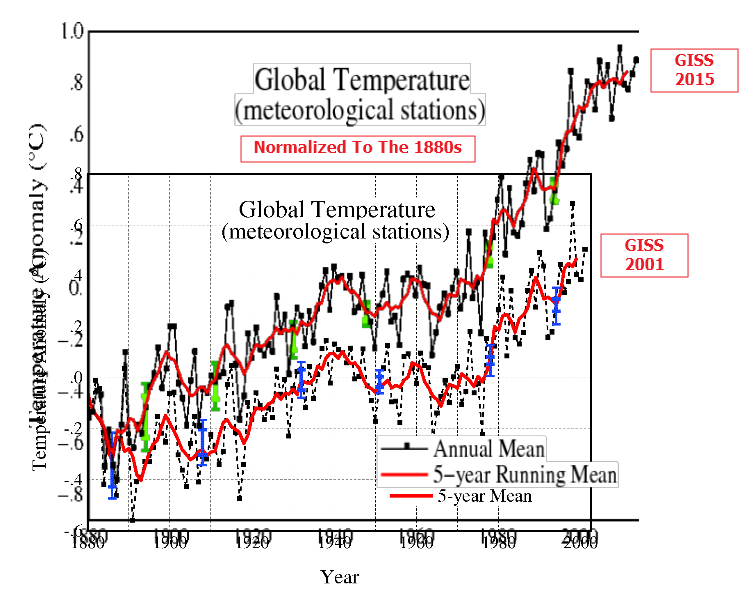
And now they show 0.8C warming from 1880 to 1980. They have doubled global warming by tampering with the data set.
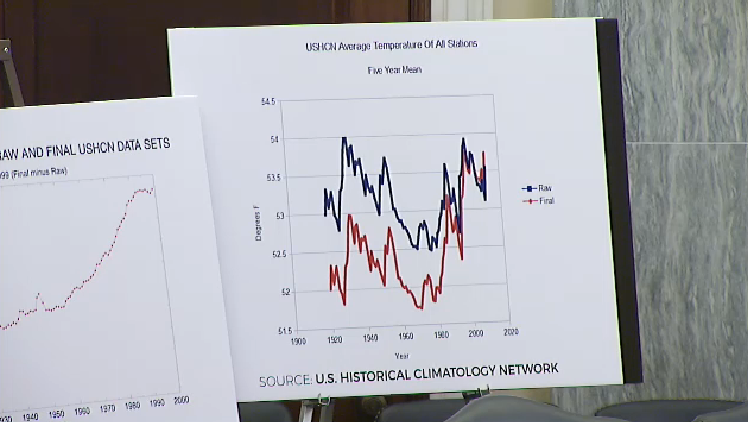
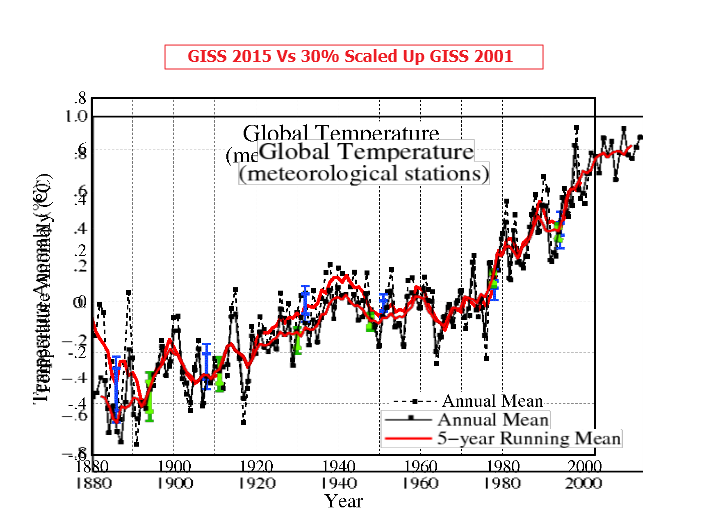
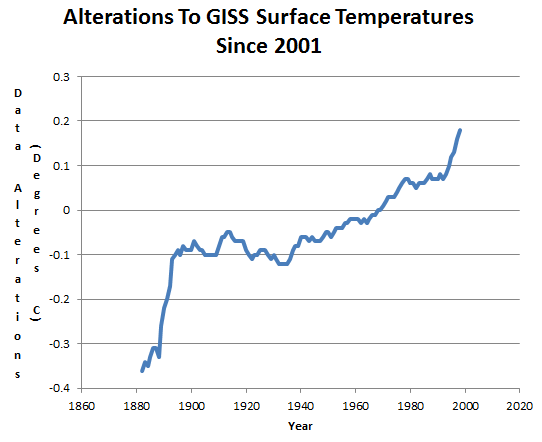
The next graph overlays all three at identical scales, and shows how they keep cooling the past, to create the appearance of a steep warming trend – needed to make the fraudulent hockey stick. Note how the data has been altered more than an order of magnitude further than the current top error bars, shown in green. A smoking gun of fraud.
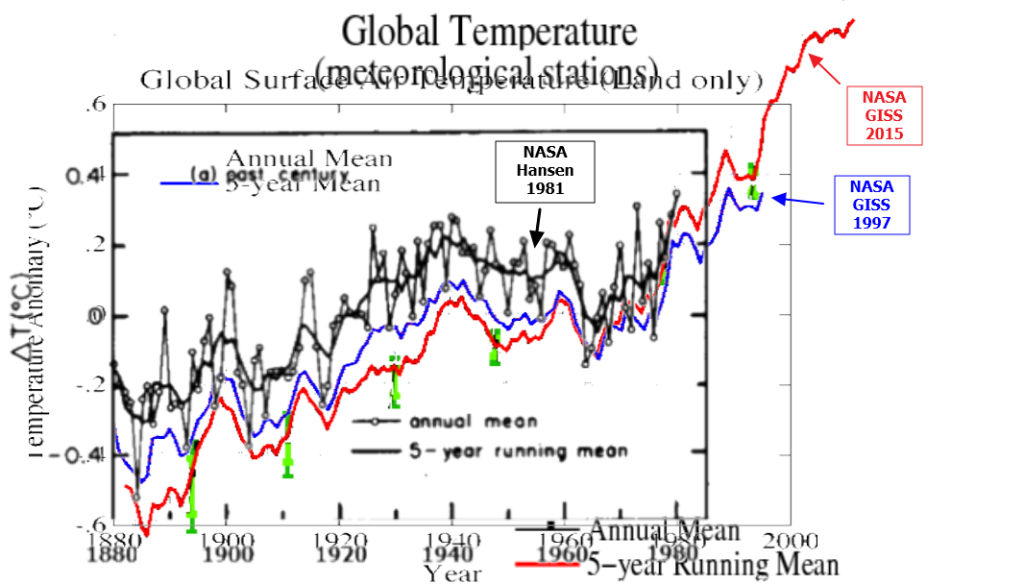
This graph shows the successive stages of data tampering
1981 version digitized from graph at top
1997 version : GLB.Ts.txt
2015 version : Fig.A.txt
NASA scientists have a strong conflict of interest in that they expect to see warming, and they the more alarm they create, the more money they obtain. This is why climate scientists have no business touching the temperature data. They have no training in signal processing and they have shown repeatedly that they will alter data to suit their needs.
If the facts don’t fit the theory, change the facts.
- Albert Einstein
With four parameters I can fit an elephant, and with five I can make him wiggle his trunk.
- John von Neumann
There’s no sense in being precise when you don’t even know what you’re talking about.
- John von Neumann
Posted in Uncategorized
75 Comments
More Guns Means Fewer Gun Murders
Gun violence in the United States by state – Wikipedia, the free encyclopedia
Gun murder rates in states where people are heavily armed are much lower than the low gun ownership states.
The ten lowest gun ownership states average 3.9 gun murders per 10,000 people. The ten highest gun ownership states average about half that at 2.0 murders per 10,000 people.
The evidence is unequivocal that criminals are deterred by guns.
Posted in Uncategorized
24 Comments
More Guns – Less Murders
Guns are the “national pastime” of Colorado. AR-15’s, Mini-14’s and AK-47’s everywhere. Gun shows every weekend.
Our murder rates are plummeting.
Posted in Uncategorized
19 Comments
Climate Change Driven Terrorism In 1941
Experts now understand that the multiple suicide bombing attacks on December 7, 1941 were the direct result of carbon pollution.
Posted in Uncategorized
9 Comments
A Closer Look At GISS Temperature Fraud
NASA has massively altered their global temperature data over the past 15 years, to double global warming.
The next graph shows the two at the same scale, normalized to the 1880’s. This graph is the best way to view the change since 2001 in claimed global warming.
The data tampering algorithm they are using is largely just a linear scaling. If the 2001 version is scaled up linearly by 30% along the Y-axis, we get a fairly good match from 1890-2000.
The next graph shows that the data has been tampered with by almost 0.6C over the past 15 years.
After altering the data by 0.6C, the criminals at GISS claimed a global temperature record by 0.01C
Posted in Uncategorized
54 Comments
Barack Obama Fighting Terrorism
Barack Obama is keeping us safe – by protecting America from climate change induced terrorism.
He believes that the way to fight terrorism is by getting approval from the EU before we eat or adjust out thermostat.
“We can’t drive our SUVs and eat as much as we want and keep our homes on 72 degrees at all times … and then just expect that other countries are going to say OK,” Obama said.
“That’s not leadership. That’s not going to happen,” he added.
Climate change must have been a big problem in 1862, when 22,000 men fell in one day at Antietam.
Tens of millions fell from 1914-1918. Climate change must have been awful.
This is what he is up against in the battle against CO2 warming. Darlington, WI had more 100 degrees days in 1936, than it has in all of the years since combined.
During July, 1936 – Darlington had 13 consecutive days over 100 degrees.
He also believes that the way to stop terrorism is to “make electricity prices skyrocket.”
https://www.youtube.com/watch?v=HlTxGHn4sH4
Posted in Uncategorized
59 Comments


