
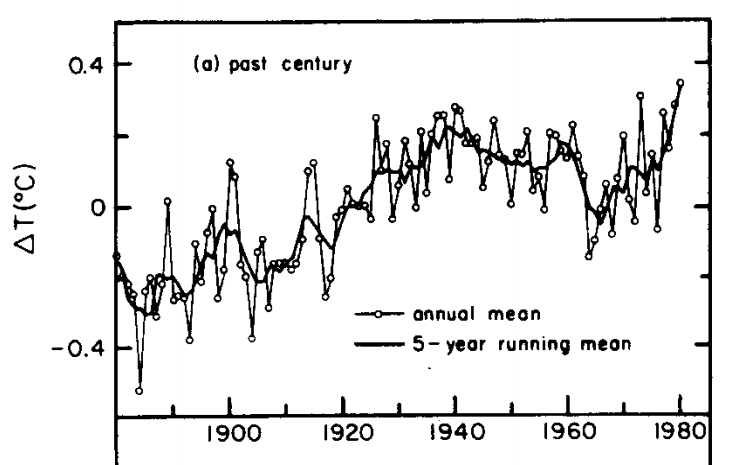
NASA temperature data tampering is not a one time venture. It occurs repeatedly and has completely corrupted the temperature record. In 1981, NASA showed 0.4 C warming from 1880 to 1980
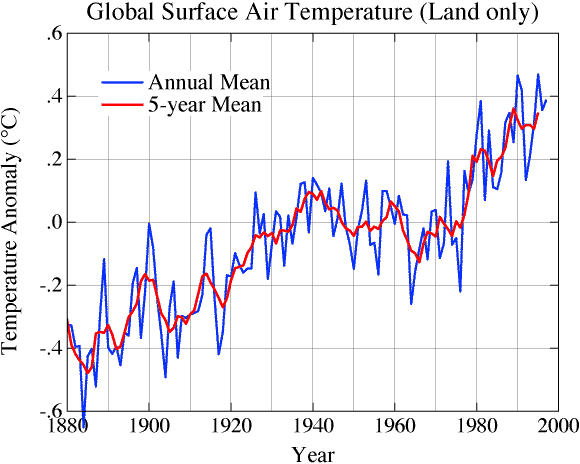
By 1997, they had bumped it up to 0.6C warming from 1880 to 1980
And now they show 0.8C warming from 1880 to 1980. They have doubled global warming by tampering with the data set.

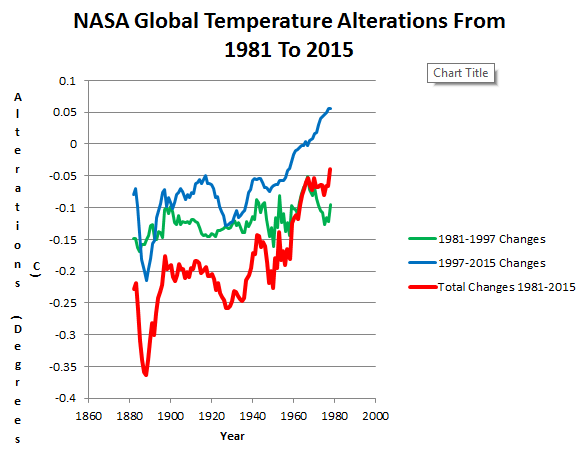
The next graph overlays all three at identical scales, and shows how they keep cooling the past, to create the appearance of a steep warming trend – needed to make the fraudulent hockey stick. Note how the data has been altered more than an order of magnitude further than the current top error bars, shown in green. A smoking gun of fraud.

This graph shows the successive stages of data tampering
1981 version digitized from graph at top
1997 version : GLB.Ts.txt
2015 version : Fig.A.txt
NASA scientists have a strong conflict of interest in that they expect to see warming, and they the more alarm they create, the more money they obtain. This is why climate scientists have no business touching the temperature data. They have no training in signal processing and they have shown repeatedly that they will alter data to suit their needs.
If the facts don’t fit the theory, change the facts.
- Albert Einstein
With four parameters I can fit an elephant, and with five I can make him wiggle his trunk.
- John von Neumann
There’s no sense in being precise when you don’t even know what you’re talking about.
- John von Neumann

But where’s the proof of fraudulent tampering? Did anyone even study it, or does overlaying figures count as a “rigorous study” in certain circles?
I’m placing your IQ at about 40.
You have a point. Why isn’t anybody double and triple checking these adjustments? There should be independent verification of this data.
A lot is riding on this. We need to get this right.
Hey mpcraig! “There should be independent verification of this data.”
Hear, hear! Sceptics have been asking for this for years and years. If it is not reproducible and justifiable, it is not science. Dealing with the CAGW officials is like dealing with a professional magician. The magician does a magic trick but won’t let anyone examine his props. The sceptics say, “it looks impossible. I think there is a trick to it.” Meanwhile the magicians claim, “if you can tell us how we did it, then it must be real magic!”
That sort of thinking is fine for entertainment — but it for darn sure is not how science works.
Typo: “if you can tell us how we did it” –> “if you can NOT tell us how we did it”
I am incredulous cfgjd to your response.
Repeating myself from an earlier blog. what has happened can be said another way.
—and noting there were changes intermediate to those given above.
First, they homogenize the raw data, the methodology is in my opinion dubious, but that analysis can be given another time.
But then they are saying at a later data, aw shucks we made a mistake,and having the same information as before they change it some more, Then later— oh by golly we did it again, we need to change it some more. Also, as I stated there were more intermediate steps, then each with same data already in their possession they change their change, and then change their change again.
In effect they are saying, guess what, we screwed up and then we screwed up again, and again, and again.
The temperature raw data is what it is.. They already have the same historical data each time, there is nothing new to make a change. But then, somehow they keep changing their change.
What you have wrong in your questioning,, is the fact that the raw data is the standard, and the onus is upon them to verify their continual manipulation of the data.
How can they have screwed up so many times?.
This whole thing comes back to the laws freedom of information which get abused. In the entire realm of climate science. ( and in politics) Note Michael Mann et al and the hockey stick. It is a challenge to get information to do correct science.
Yes, “homogenization” is the most corrupting step, spreading UHI across thousands of kM.
Then all other discrete station “corrections” all lead in the same direction, a cooler past. You’d think if they are correcting for error, then the sign of the adjustment would be more varied.
Didn’t one of the organizations warehousing the temperature data erase the original data and kept only the adjusted data to save storage? Highly suspicious behavior given that we’re being ask to make trillion dollar decisions based on this data.
Bob Williams: “Didn’t one of the organizations warehousing the temperature data erase the original data and kept only the adjusted data to save storage?”
Yes, the University of East Anglia (AKA “University of Easy Access”) Climate Research Unit, the specific individual being Professor Phil Jones, also famous for his admission that he was unable to use Excel spreadsheets, amongst other un-professor-like conduct..
Like darryl above, reposting to your same, lame comments.
CFG – Do try to keep up. Just because you ignore it, doesn’t mean it did not happen.
What they say.
Climate Etc. – Understanding adjustments to temperature data
by Zeke Hausfather All of these changes introduce (non-random) systemic biases into the network. For example, MMTS sensors tend to read maximum daily temperatures about 0.5 C colder than LiG thermometers at the same location.
http://judithcurry.com/2014/07/07/understanding-adjustments-to-temperature-data/
What He measured
Interviewed was meteorologist Klaus Hager. He was active in meteorology for 44 years and now has been a lecturer at the University of Augsburg almost 10 years. He is considered an expert in weather instrumentation and measurement.
One reason for the perceived warming, Hager says, is traced back to a change in measurement instrumentation. He says glass thermometers were was replaced by much more sensitive electronic instruments in 1995. Hager tells the SZ
” For eight years I conducted parallel measurements at Lechfeld. The result was that compared to the glass thermometers, the electronic thermometers showed on average a temperature that was 0.9°C warmer. Thus we are comparing – even though we are measuring the temperature here – apples and oranges. No one is told that.” Hager confirms to the AZ that the higher temperatures are indeed an artifact of the new instruments.
http://notrickszone.com/2015/01/12/university-of-augsburg-44-year-veteran-meteorologist-calls-climate-protection-ridiculous-a-deception/
Adjustment + 0.5 °C less reality -0.9°C = 1.4 °C too high. Published and everything.
And Tony, is that 40 IQ before or after adjustments?
Hey Tony! “Note how the data has been altered more than an order of magnitude further than the current top error bars, shown in green.”
Great post, Tony! This alteration beyond (waaaaaay beyond!) the error bars should be an absolute alarm bell to anyone who may still believe the official charts. And yet….I expect that some yahoo will chime in any minute with “but this is not peer reviewed!” or “that is not proof!”, or perhaps, “that is not even evidence!”
I am reminded of a quote from Schiller: “Against stupidity the gods themselves contend in vain.”
Ha! cfgjd commented while I was writing! Correct again… 🙂
Study the issue properly and publish it somewhere, even in some 3rd-rate journal is better than this crap. Or is it not worth studying?
You really are totally ignorant and uninformed, aren’t you?
You would rather make utterly unjustified assumptions and spray your insults and abuse around than actually do a bit of research into the matter.
The absolute definition of a troll, in fact.
SHOO!
The 3rd rate journals are all full of climate science crap, that’s all that’s allowed.
This blog and others like it get far more viewings that most journals.
And if you had any capability yourself, you could peer-review it yourself.
Torturing the data until it confesses. Databoarding.
Tampered data has caused loss of Arctic sea ice volume, global melting of mountain glaciers, mass-loss from polar ice sheets and global sea level rise. What??
No, the interglacial has caused loss of Arctic sea ice volume, global melting of mountain glaciers, mass-loss from polar ice sheets and global sea level rise. That’s what.
Got any proof of that, i.e. rigorous studies?
You are joking, right?
cfgjd, you may have just failed the Turing Test.
Would the lack of a huge ice sheet over Manhatten be enough for you?
Just a quick hypothetical for you cfgjd: we can all agree that we are in an interglacial and that ice sheets have retreated, sea level has risen and polar ice caps are smaller now than during the last glacial period. we might disagree as to the reason that it is continuing but no-one can deny that it is a continuation of a 10,000 year trend (with wiggles up and down)
At what point did the retreating ice and rising seas go from a good thing to a bad thing?
Jason-
“cfgjd, you may have just failed the Turing Test.”
Comment of the month.
Hey Ted! Actually, I laughed when I wrote it! 🙂
“loss of Arctic sea ice volume, global melting of mountain glaciers, mass-loss from polar ice sheets and global sea level rise.”
All of which have happened before, long before the industrial revolution. Can you prove, rigorously and peer-reviewed, that any of those things are new and unprecedented?
Arctic sea ice is almost exactly where it should be for the phase of the AMO.
In this chart, the NH sea ice is inverted and superimposed on the AMO.
http://s19.postimg.org/4crolmgmr/amo_vs_NHice.jpg
Mountain Glaciers have come and gone cyclically. So much so that the find artefacts and trees under currently retreating glaciers. Did you know that Swiss glaciers can be shown to be affected by the AMO as well?
http://oi51.tinypic.com/24yptu0.jpg
Global sea ice hasn’t moved more than a bit up or down for as long as we have decent records.
So every conjecture you make is totally incorrect, because you are a brain-washed idiot.
I guess that implies that there was huge data tampering during the first 3/4 of the Holocene, when summer Arctic sea ice levels were often zero.
And when trees grew under glaciers, to be revealed by the very slight warming since 1970
In science things need to be studied rigorously, published under peer-review and then hopefully replicated or corroborated by other studies. Climate-skeptics do not do this. LOL
So says the natural climate change denier.
Well, cfgjd denies vigorously, publishes his denials here for everyone to review and has Martin Smith coming to his side also denying vigorously. I He meets the standard of climate science.
Peer review means nothing if the peers are lying. 97% of homeopaths say they can cure cancer with water, and all the homeopathy journals agree with peer reviewed papers by homeopathy experts.
Peer review in climate science is just the fox guarding the hen house.
Yeah practically all, or at least 90%+ pf scientists are lying. And the terrestrial and satellite datasets are all fakes. It’s a hyooge conspiracy! Right.
They aren’t scientists. They are climate scientists pretending to be scientists. Check their academic transcripts and you will see they never studied hard core science. They are mostly STS majors who got bogus PhD’s in climastrology.
Yes. Until they publish their methods, allowing anyone with the means to reproduce their work, then the scientific method requires them to be treated as liars. Science is not based in assertion, education, or reputation. It’s based in reproducible observations. If a two year old child shows us how to drop an apple UP, in a way that can be consistently reproduced, he’ll have utterly demolished the work of possibly the greatest mind in history. It would not be Newton’s word against that of a two year old. It would be experimental data invalidating a hypothesis.
What we do here *IS* peer review. And we’d like to do it as accurately as possible. If you can link us to the methods used to obtain the temperature adjustments, we’d be happy to perform the detailed analysis you keep asking for. The only reason we haven’t done it yet is that the data I keep requesting does not appear to be publicly available. If it is, please point us in the right direction.
Your ignorance of what peer review is in climate science is showing through still
Just like your ignorance of everything else is there for everyone to see.
You and Martin both do great harm to the AGW cause, because it is very obvious to any outsider reading the blog, that neither of you is capable of producing anything except empty rhetoric.
Please go and learn something so that you can at least produce something of substance, and not just moronic childish drivel.
“Climate Science” is just a tiny slice of all Earth Sciences. Do you guys honestly believe all Earth Sciences are corrupt too? That would be some conspiracy, look at the list of topics:
https://en.wikipedia.org/wiki/Earth_science#Partial_list_of_the_major_earth_science_topics
Again, a totally nonsense posting from the cfool.
You present nothing, because you have nothing.
Steven: Remember back in November, when it was cold where you were and you castigated NOAA for predicting a warm December in the US?
http://www.esrl.noaa.gov/psd/map/images/fnl/sfctmpmer_01a.fnl.anim.html
massive cold blast forecast. you need to find something useful to do with yourself.
http://wxmaps.org/pix/temp1.html
Hey Marty, you are a font of knowledge, it looks like cfgjd has gone to bed so I’ll as you the same question as I did above:
Just a quick hypothetical for you cfgjd: we can all agree that we are in an interglacial and that ice sheets have retreated, sea level has risen and polar ice caps are smaller now than during the last glacial period. we might disagree as to the reason that it is continuing but no-one can deny that it is a continuation of a 10,000 year trend (with wiggles up and down)
At what point did the retreating ice and rising seas go from a good thing to a bad thing?
When the rate increased by a few orders of magnitude. IOW, over the last few decades.
So, the rate of retreating ice and rising seas has increased a few orders of magnitude over the past couple of decades?
You are nothing but a clown.
No, because clowns are funny
No, Glacier, the rate of warming. The rate of warming. Natural warming in an interglacial takes thousands of years. We have seen about 4 or 5 thousand years of warming in a little over 100 years. It means there is hundreds of years of melting ice ahead of us no matter what we do.
BS. The rate of warming is well within natural parameters.
Great, can you point to it on this chart of sea level rise.
https://www.google.com/url?sa=i&rct=j&q=&esrc=s&source=images&cd=&cad=rja&uact=8&ved=0ahUKEwian7LX3szJAhVH8GMKHWQJA4oQjRwIBw&url=https%3A%2F%2Fcommons.wikimedia.org%2Fwiki%2FFile%3AHolocene_Sea_Level.png&psig=AFQjCNFBWbqbMLmH9w4M-i2jnWhNLHXpKQ&ust=1449680457157923
15,000 years ago, half of north America was under an average of a mile of ice. At least on the mainland, 99% of that ice was gone within a few thousand years. Let’s say 10,000, to be conservative. A “few orders of magnitude” would be at minimum 2, so we can chop 2 zeros off that number. That gives us 100 years, for all the ice left on earth (considerably less volume than melted at the end of the last glaciation) to disappear. Can you point us to the studies claiming that outcome?
Alternately, let’s just talk about temperature change. I believe GISS recently claimed that we just passed the 1C mark in anthropogenic warming. That’s over the last 100 years. Let’s say, again very conservatively, that half of that 1C was in this century. That’s a third of a degree per decade. A “few orders of magnitude” would bring that to .0033 degrees per decade. Can you point us to the study showing that no decade before the 20th century ever saw a temperature change of .0033C?
I’m really trying to work with you here. If you can prove change rates increasing by multiple orders of magnitude, you’re entirely right. The world will end, quickly, if we don’t fix something. But such claims are so far beyond even the most apocalyptic warnings in any published papers, I have trouble accepting that you’re arguing in good faith.
If you are wondering the slope on the last 20,000 years is about 6mm/year. Several orders of magnitude would be at least 18+ mm/year. Is this what you are claiming sea level rise is currently?
All of you are missing the point. Clearly, none of you has the word hysteresis in your vocabulary. The rate of global warming really is unnatural, and it means we have a lot of melting already baked into the system.
😆
Hysteresis: the time-based dependence of a system’s output on present and past inputs. The dependence arises because the history affects the value of an internal state. To predict its future outputs, either its internal state or its history must be known.
What does that have to do with the claim that recent warming is unprecedented, which it is not.
http://www.debate.org/photos/albums/1/2/1423/35583-1423-x9xs7-a.jpg
“We have seen about 4 or 5 thousand years of warming in a little over 100 years.”
From Hansen’s graph
http://naturalscience.com/ns/articles/01-16/hansenFigure2.jpg
I’m seeing roughly 10 degrees, in about 5,000 years.
Can you point us to a study showing that temperatures have risen 10C in the past 100 years?
http://www.hyzercreek.com/GISPplusGRIP.jpg
That’s a perfectly normal rate of warming.
From Miriam-Webster:
Definition of hysteresis
Popularity: Top 40% of words
plural hys·ter·e·sesplay \-?s?z\
1
: a retardation of an effect when the forces acting upon a body are changed (as if from viscosity or internal friction); especially : a lagging in the values of resulting magnetization in a magnetic material (as iron) due to a changing magnetizing force
From Martin:
“When the rate increased by a few orders of magnitude. IOW, over the last few decades.”
You’re referring to changes you claim have already been measured. Hysteresis refers to changes that are expected, but have yet to be measured, or changes that can not be measured until significantly after the cause. Your claim is utterly unrelated to hysteresis.
Please link us to a study showing rate changes in any climatic process totaling multiple orders of magnitude greater than those inferred or measured from the time before industrialization.
The rate of global warming is currently ZERO !!
What is unnatural about that.?
The unnatural part was the disappearance of the “inconvenient” 1940ish peak from the raw data of many places around the world… That is the main cause for any so-called global warming in the GISS data.. and yes, its totally man-made, fabricated, FRAUD.
And you have been shown many times that Arctic sea ice is driven mainly by the AMO.
But then.. you ALWAYS ignore REAL DATA because it scares you because you might actually have to learn something.
You are again proving yourself to a moronic, ignorant LIAR who is unable to process any information contrary to you brain-washed cult religion.
Actually, Andy, Martin’s numbers do work if the rate of change is exactly zero. A 2 order of magnitude increase from zero is zero. He probably thought he was exaggerating. But if you’re right, we have to admit that Martin was too.
Ok Ted, Martin accidentally got something right…. on a technicality.
That technically being that ZERO warming , multiplied by anything, is still ZERO warming.
See Martin? We’re all fair minded here. We’re willing to admit when you’re right. Zero equals zero. Good job.
Since you’re on a roll, maybe now you can tell us which studies have shown 10C of warming in the past 100 years.
“We have seen about 4 or 5 thousand years of warming in a little over 100 years.”
Poor Martin the goreboy, even if he uses the much adjusted GISS fabrication, he cannot substantiate his moronic claims.
First of all, your original comment said nothing about the rate of warming. It was about retreating ice and rising sea levels, neither of which have increased their rates by orders of magnitude. You are off by orders of magnitude.
You are also wrong about the rate of temperature increases, which has not increased by orders of magnitude. Not even close.
I was wrong and Morgan was right. You are not a clown because you are not funny. Just sadly incorrect. I suspect you are doing on purpose because no one can be as stupid as you pretend to be.
“It means there’s hundreds of years warming ahead of us….” You have absolutely no proof of that. That’s just speculation. With the climate astrologer’s track record of predictions, it’s interesting that you’re so sure of this one.
Last time I checked the warmest period in this interglacial was already passed thousands of years ago and all that was left was a slow cooling (due to Milankovich cycles) + some internal variability.
Now, what caused the recent rather rapid warming? Skeptics can only handwave about “cycles” as their pet-theory “it was the Sun!” seems dead and buried.
Sorry, but your rhetoric is just wrong.
http://www.debate.org/photos/albums/1/2/1423/35583-1423-x9xs7-a.jpg
May seem dead to you, but not to rational people. The Sun is coming off of a strong period (high sunspot counts) during the (esp. latter half of) 20th C. Now we have a pause and likely soon some significant cooling as the Sun heads into a new grand minimum.
Even this current cycle has had very high TSI
In order, from high to low, http://lasp.colorado.edu/lisird/tss/sorce_tsi_24hr.csv
2015, 1361.4512
2014, 1361.3966
2013, 1361.3587
2012, 1361.2413
2011, 1361.0752
2003, 1361.0262
2004, 1360.9192
2010, 1360.8027
2005, 1360.7518
2006, 1360.6735
2007, 1360.5710
2009, 1360.5565
2008, 1360.5382
TSI was also higher for most of October and November, compared to September,
http://lasp.colorado.edu/data/sorce/total_solar_irradiance_plots/images/tim_level3_tsi_24hour_3month_640x480.png
(from Bob Webber at WUWT.) A very interesting post actually, find at 9:07 on…
http://wattsupwiththat.com/2015/12/08/senate-hearing-today-john-christy-judy-curry-will-happer-and-mark-steyn/
TSI is only one aspect though. Sunspots have been sparse, with a few spotless runs this summer and fall, and Solar Wind is often at the low end as compared to early 2000’s. Also, hasn’t the UV been low as well? I am no expert, but it seems to me the strength of the Solar wind has an effect on global temps. Just been watching it for about ten years now.
You mean the SLIGHT warming out of the COLDEST period of the last 10,000 years..
Get your words correct for once.
We are still very much at the COLD end of the current interglacial.
Most of so-called warming from 1940 onward was due to unjustified changes in the original data. Those are changes that remain TOTALLY UNJUSTIFIED.
cfgjd-
I sincerely don’t understand the point you’re trying to make with this comment. Are you saying that, once an interglacial maximum temperature is established, temperatures must be locked in to a monotonous, completely unbroken cooling?
Hey, I thought your religion’s belief was that right now is the warmest period EVA!!
How did the polar bears survive if it was warmer before?
The new electronic thermometers caused the rapid recent warming. They appear to be about 1degree C higher than the old glass thermometers.
The new electronic thermometers are reading about 1 degree C higher than the old glass thermometers. This would account for the ‘recent rapid warming’ would it not and then you add in the homogenizations and voila, we have run-a-way warming and we are all going to die…just when we are all going to die hasn’t produced a peer reviewed paper for us peons yet!
WOW.. Has anyone seen this over on Roy’s site ?
From what I can gather, Patrick Moore has reported Greenpeace to the FBI under the RICO and ware-fraud acts.
http://www.drroyspencer.com/2015/12/greenpeace-founder-reports-it-to-the-fbi-under-rico-and-wire-fraud-statutes/#comments
typo.. again should be wire-fraud..
Interesting!
Steve,
I’m doing some research into this. I’ve read over some of the homogeneity paper article here:
ftp://ftp.ncdc.noaa.gov/pub/data/ushcn/v2/monthly/menne-williams2009.pdf
I am curious if they are they using a straight arithmetic average vs a geometric average (or weighted average) for the “neighbors”? They seem to take the top X by correlation rather than location and then do a straight average of that. Also the paper makes no reference to altitude.
Secondly, why wouldn’t a equipment or location change just be considered a new series rather than a continuation of an old series?
Finally, they applying this iteratively or all at once. f([a]) = [b] vs f(a1) = a2 ; f(a2) = a3 …?
Thanks,