
The world’s top climate scientists boldly proclaimed that global warming will bring milder winters and decreased heavy snowstorms
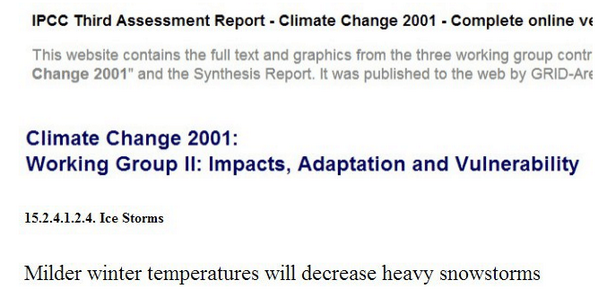

Now they claim they predicted the exact opposite

The world’s top climate scientists boldly proclaimed that global warming will bring milder winters and decreased heavy snowstorms
Now they claim they predicted the exact opposite
NCDC shows 2012 as the most extreme year in US history, when in fact it was one of the least extreme years in US history.
The graph below is the NCDC graph, showing 2012 as the most extreme year, and 1936 as one of the least extreme years.
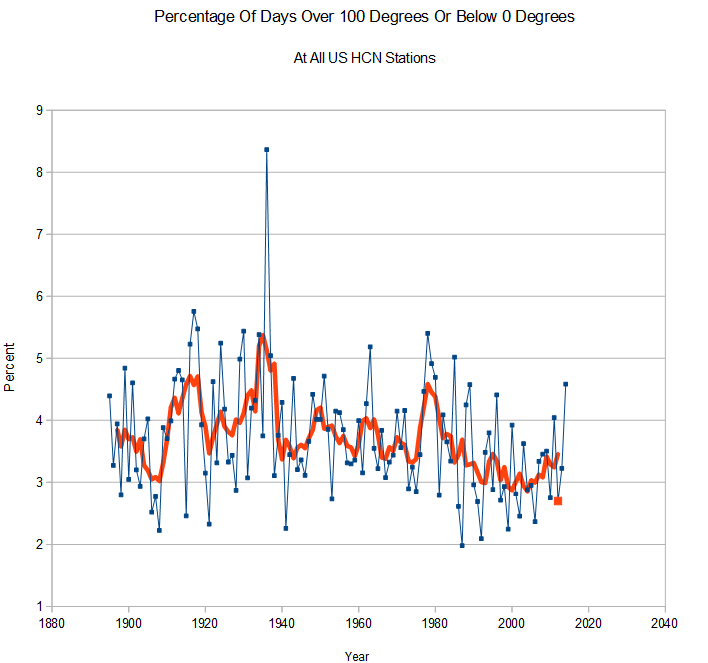
The next graph shows the actual percentage of days over 100 degrees or below 0 degrees F. The real graph is basically inverted from the NCDC graph, with 1936 as by far the most extreme year, and 2012 as one of the least extreme years. Extreme temperatures have been on a steady decline for 80 years.
 The level of fraud at NCDC seems to know no limits, with the climate extremes index as the crown jewel of their fake climate data.
Note how the sun stays at the same elevation above the horizon. About two dozen people told me today that they are Arctic experts and this is not possible.
[youtube=http://www.youtube.com/watch?v=FZpRDtz0Szs]
Check out this world class clown. He wrote a hit piece against Jim Inhofe over climate, then when I asked him a climate question, he said he doesn’t know anything about climate
Humid climates often have have lower summer maximum temperatures than dry climates.
This is because of evaporative cooling from plants, bodies of water and soils, vegetation shading the ground, rainfall, and haze in the atmosphere which blocks incoming sunlight. Phoenix normally has its hottest afternoons in June, before the monsoon moisture comes in July.
In the 15th century, people were afraid of falling off the edge of the Earth
In the 21st century, Democrats are afraid that a metal pipe will destroy the Earth.
That is why they call them “progressives.”
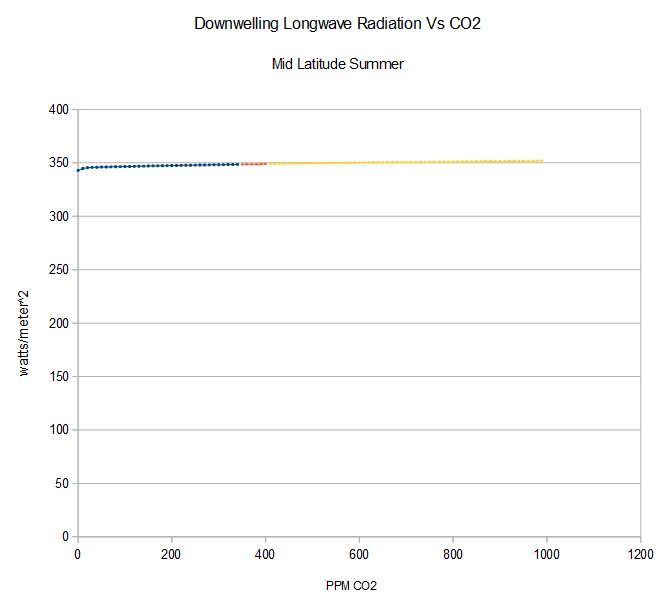
The graph below shows the increase in downwelling longwave radiation as CO2 increases. The red section shows the increase from 350 PPM to 400 PPM CO2.
As you can see, increased CO2 does almost nothing to the radiative balance of the atmosphere near the surface, and Hansen’s claims of increased heatwaves due to CO2 have zero basis in science. The greenhouse effect at the surface is dominated by water vapor, not CO2.
This graph was generated using RRTM – the model which Trenberth uses.
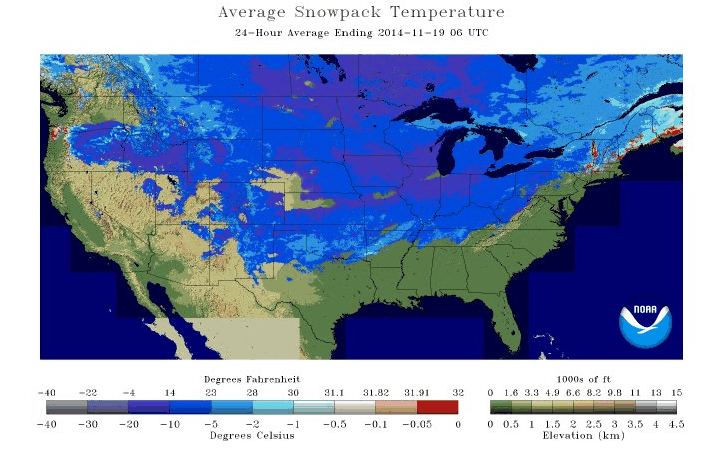
The US is cold right now, largely due to very dry air. Note that dew points are below 0C across almost the entire country. This has two effects – it reduces the greenhouse effect, and reduces the amount of heat being generated from condensation.
Now compare vs. Saudi Arabia, which has much higher humidity with dew points in the 10-20 C range.
And Australia which has dew points in the 10-30C range.
Middle East Weather Map – Current Dew Points of the Middle East – Find Local Weather
Also note that reduced temperature further reduces the amount of longwave radiation being generated by greenhouse gases in the atmosphere.
The graph below shows how the greenhouse effect varies with humidity during the mid-latitude summer. As you can see, there is a huge increase in downwelling longwave radiation going from no water vapor to 1% water vapor (10,000 PPM.) A little bit of humidity goes a long way towards keeping the surface warm.
One of the reasons why Antarctica is so cold is that there is very little water vapor in the interior of the continent, so little heat reaches the surface from the atmosphere. Likewise, Mars is very cold despite a large amount of CO2 in its atmosphere, due to the low atmospheric pressure and lack of water vapor.

Also note that you can’t actually go above 40,000 PPM because the air becomes saturated.


