


Disrupting the Borg is expensive and time consuming!
Google Search
-
Recent Posts
- Earth, Wind And Fire
- On The Road Again
- Vandalism At The Reflecting Pool
- Fifty Years Ago Today
- Truth Or Consequences
- US Climate Trend Maps
- Declining Spring Snow Cover In Northern New Mexico
- You Can’t Fool Mother Nature
- Cattle And The Climate
- One Atomic Bomb Per Hour
- New Video : Analyzing Oil And Gas
- Is Antarctica Melting?
- High Speed Analysis And Visualization
- El Nino To The Rescue?
- Fake News Update
- Growth Of Antarctic Sea Ice
- 65 Years Of Progress!
- El Nino To The Rescue?
- Worst March Drought On Record
- ChartGL Process Control Demo
- The Biggest Money Laundering Scam
- Drought In The Headwaters Of Lake Powell
- Unrealistic Expectations Of Water Availability
- Did Bill Gates Do This?
- Worst March Drought On Record In The US
Recent Comments
- GW on Earth, Wind And Fire
- Bob G on On The Road Again
- Luigi on On The Road Again
- arn on On The Road Again
- Bob G on On The Road Again
- Gordon Vigurs on On The Road Again
- Bob G on On The Road Again
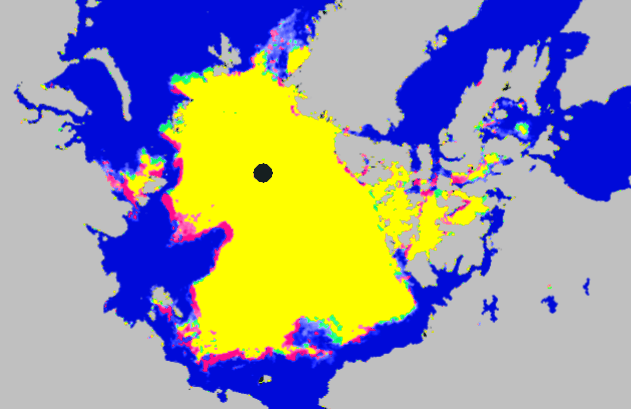
Changes In Arctic Ice Over The Past Week
Red shows ice extent loss since August 7, green shows gain. High pressure has been creating winds which are compacting the ice in the Chukchi, East Siberian and Laptev Seas, and will continue to do so for at least a few more days.

Posted in Uncategorized
6 Comments
National Wildlife Federation Great Lakes Warning!
Global Warming and the Great Lakes
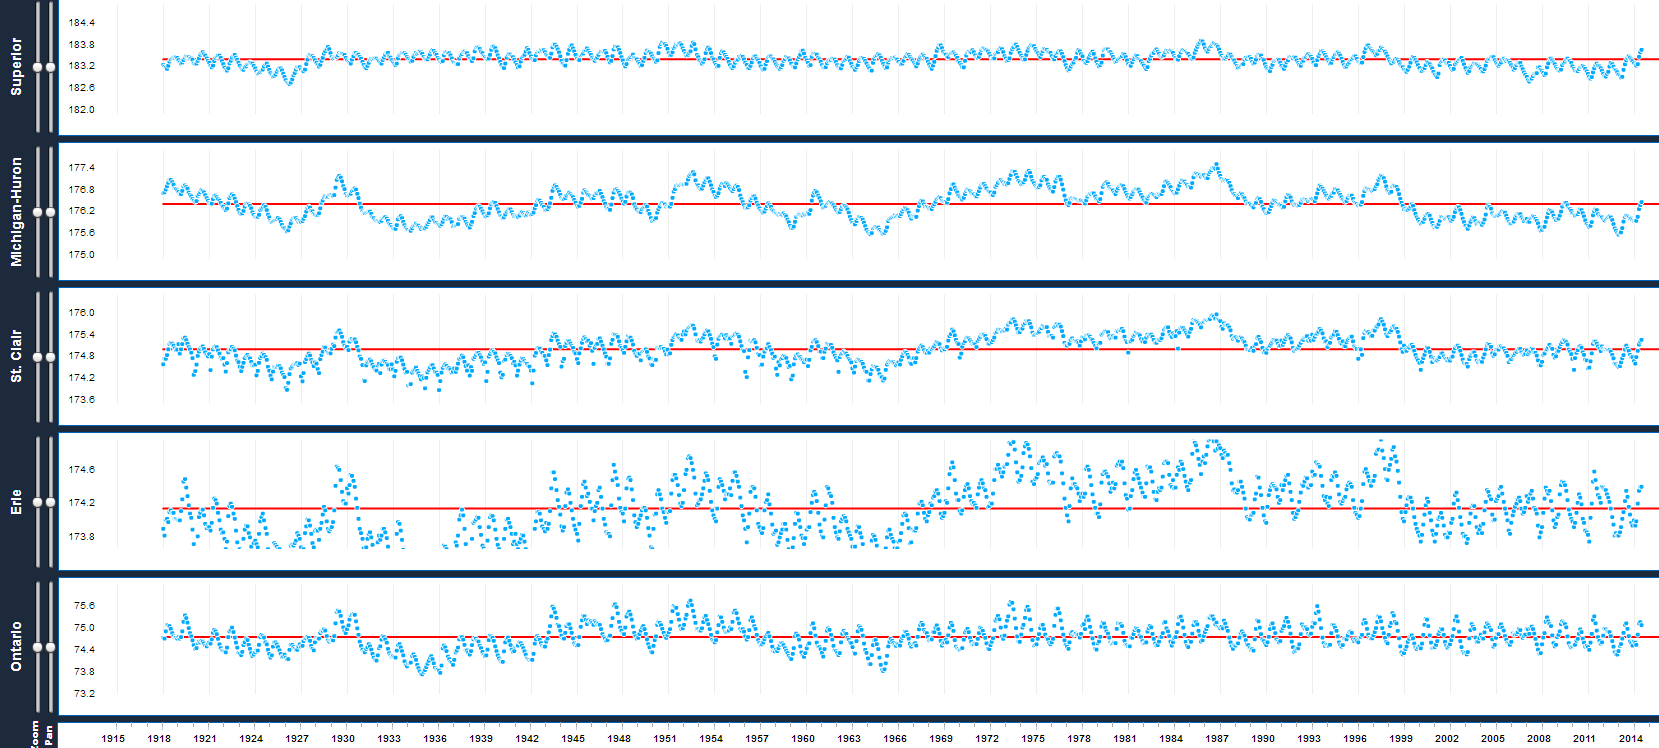
Already, Lake Superior has increased water temperatures and an earlier onset of summer stratification by about two weeks in just the past 30 years. Within another 30 years Lake Superior may be mostly ice-free in a typical winter.
Lake Erie water levels, already below average, could drop 4-5 feet by the end of this century
Global Warming and the Great Lakes – National Wildlife Federation
Lake Superior obliterated all records for ice this year, and the water level in all of the Great Lakes is above normal.
Posted in Uncategorized
27 Comments
Andrew Feedman Says Same Weather As 1925 Is Unprecedented Global Warming
‘Unprecedented’ Flooding Event in Detroit Fits Global Warming Pattern
Detroit received 4.57 inches of rain in just a few hours on Monday, breaking its record for that date and coming in second place for the all-time wettest calendar day, behind a 4.74 inch deluge in July of 1925. The heavy rain — which included more than an inch of rain falling in just 24 minutes — led to some of the most widespread flash flooding on record in the Motor City.
‘Unprecedented’ Flooding Event in Detroit Fits Global Warming Pattern
Minor street flooding from a rainfall event beaten during one of Hansen’s coldest years on record – proves global warming.
With 10,000 rain gauges and a 100 year record, you would expect to have 100 of them set their all-time record ever year.
Freedman appears to have completely lost it.
Posted in Uncategorized
23 Comments
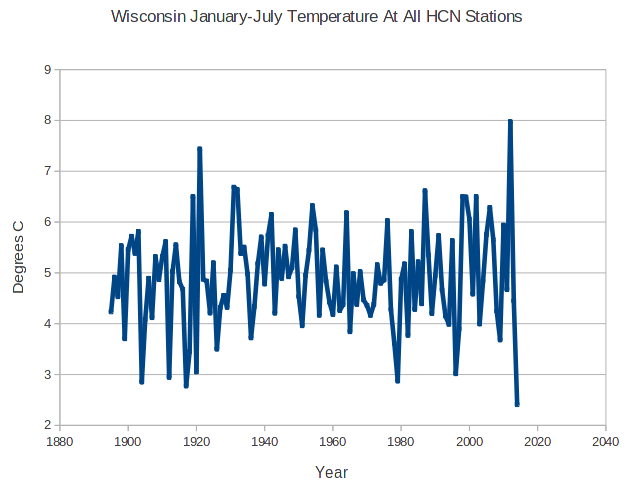
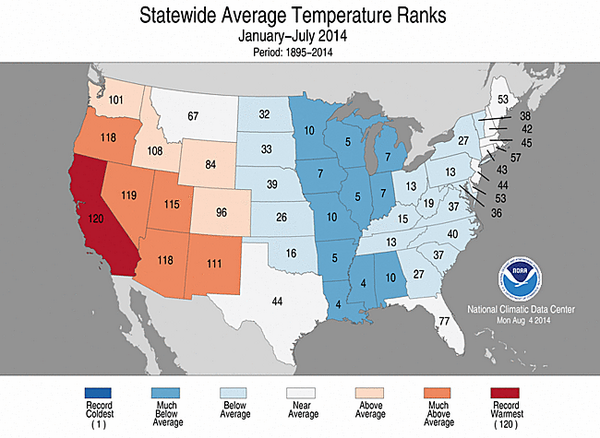
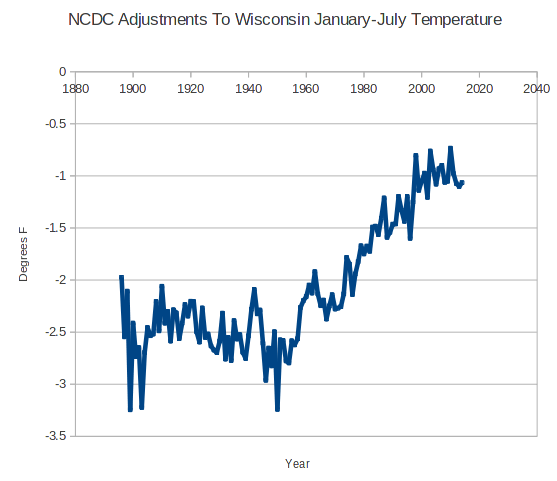
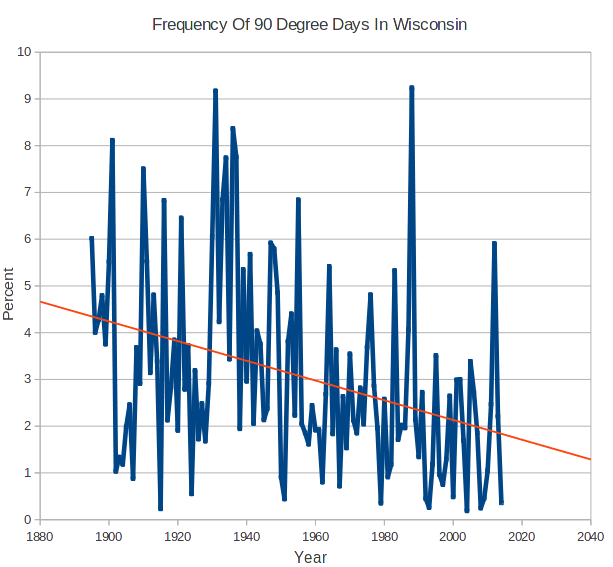
NOAA Cheating The People Of Wisconsin Out Of Their History
Wisconsin had their coldest January-July on record by a wide margin, but the fraudsters experts at NCDC pushed them to the #5 spot.
Note that NCDC ranked them at #5 for the period
NCDC accomplished this using a spectacular hockey stick of adjustments to cool the past.
The frequency of 90 degree days in Wisconsin has dropped by two-thirds over the past 120 years
Posted in Uncategorized
23 Comments
More Detail On The Arctic Catastrophe
Over the past two years there has been a large increase in 1.5+ meter thick ice in the Arctic, and the thick ice has shifted nearly 1,000 miles to the west – making it safe from winter winds pushing it out into the Atlantic. Both of these facts spell complete disaster for Arctic death spiral alarmists.
Posted in Uncategorized
72 Comments
US Temperatures Being Adjusted Upwards At 3.6 Degrees Per Century
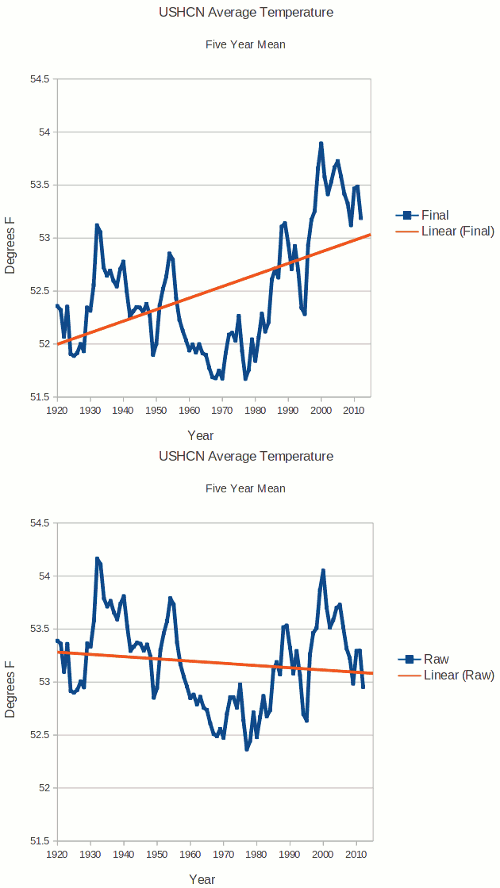
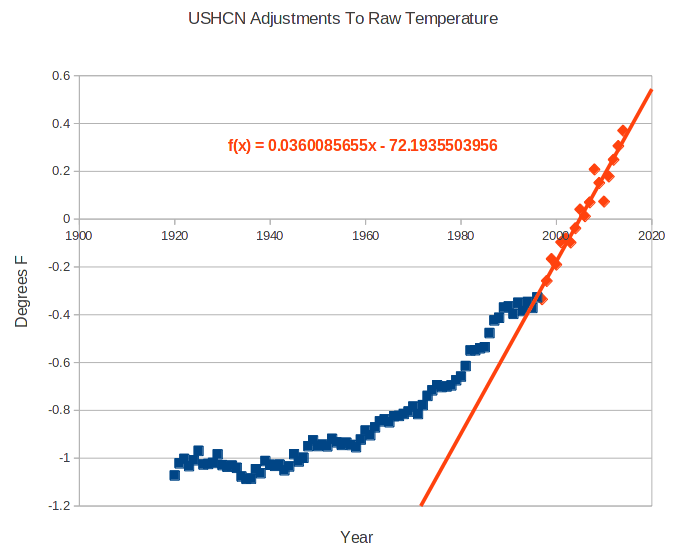
The US has been cooling for the past century. This doesn’t fit the global warming narrative, so NOAA is applying a spectacular hockey stick of adjustments to turn a cooling trend into a warming trend. Since 1997, they are trying to hide the decline in temperatures by adjusting measured temperatures upwards at a very impressive rate of 3.6 degrees per century.
Raw: ftp://ftp.ncdc.noaa.gov/pub/data/ushcn/v2.5/ushcn.tavg.latest.raw.tar.gz
Final: ftp://ftp.ncdc.noaa.gov/pub/data/ushcn/v2.5/ushcn.tavg.latest.FLs.52i.tar.gz
Posted in Uncategorized
19 Comments
75% Of The US Below Normal Temperature Over The Past 11 Months
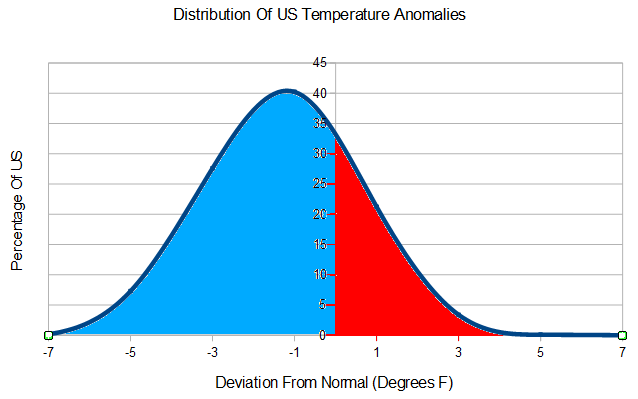
Temperatures have been below normal in 75% the US since October 1, 2013, with the average departure being -1.29 degrees.
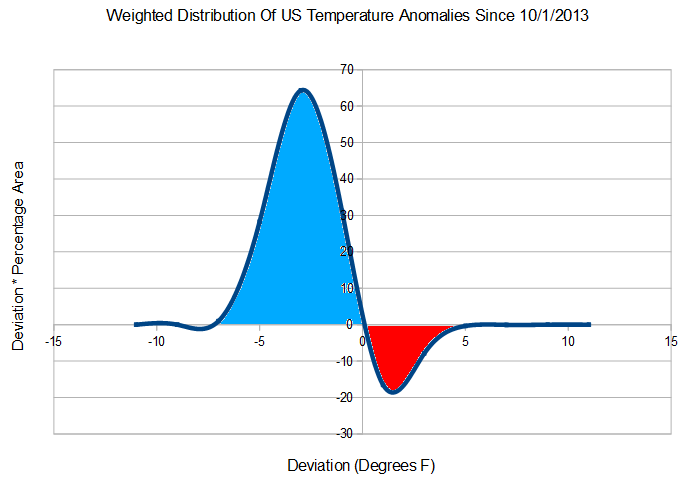
But it is worse than it seems. Most of the 25% percent above normal has been barely above normal, while the 75% below normal has been generally much below normal. The next graph shows percentage area weighted by the deviation.
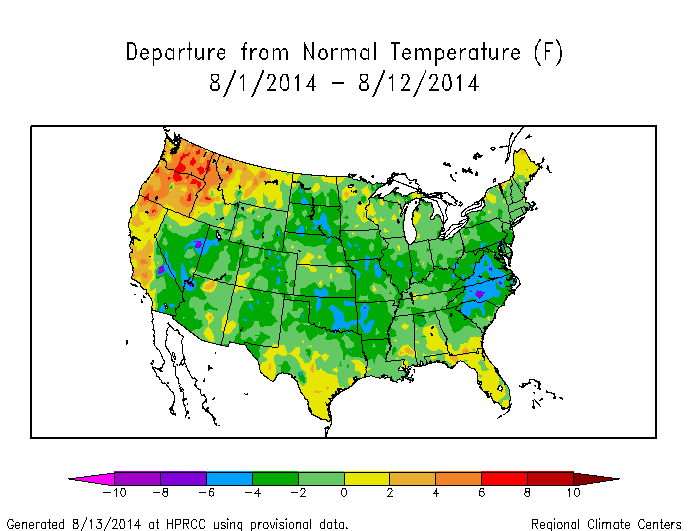
It isn’t warming up, either. 75% of the US has also been below normal temperature this month.
Posted in Uncategorized
15 Comments


