In 50 minutes, there will be hundreds of millions of people watching the US play Portugal – in a match which gives the US an opportunity to join the top flight of the soccer world.
And it would be great to see Dempsey show up Ronaldo.
In 50 minutes, there will be hundreds of millions of people watching the US play Portugal – in a match which gives the US an opportunity to join the top flight of the soccer world.
And it would be great to see Dempsey show up Ronaldo.
The rise in CO2 over the past century (100 ppm) is equivalent to packing an extra five people into the Porto Alegre stadium, where the US will play Portugal this evening.

NCDC never publishes graphs of measured US temperatures. Here is why.
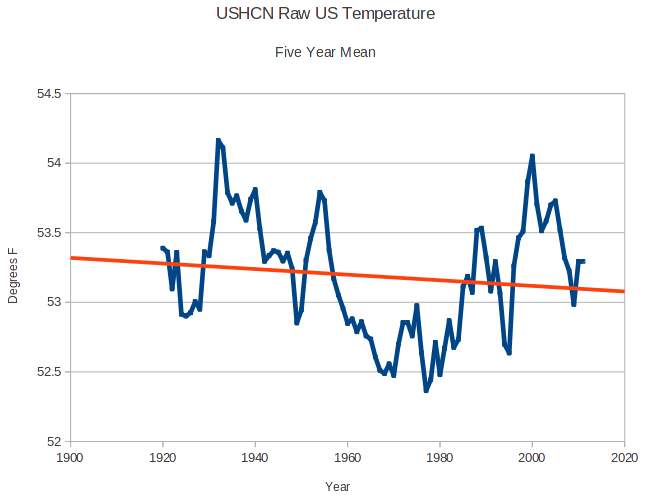
Data is located here :
ftp://ftp.ncdc.noaa.gov/pub/data/ushcn/v2.5/ushcn.tavg.latest.raw.tar.gz
I work as a consultant, and I get paid for delivering what the client wants.
Climate scientists work as consultants to the government, who pays their contracts. Either they deliver what the government wants, or their funding gets cut off.
It is not a conspiracy. Rather it is a simple business arrangement. Everyone who works in climate science understands it.
But their work certainly has nothing to do with either climate or science. They are propagandists on a $29 billion/year budget.
One of alarmists’ favorite lies is that “methane is 30 times worse than CO2”
This is complete BS. Methane’s absorption bands almost completely overlap with H2O, and methane concentrations in the atmosphere are very low. CH4 quickly oxidizes and disappears from the atmosphere, so there can never be a lot of methane in a warm atmosphere with a large concentration of O2.
Methane contributes almost nothing to Earth’s greenhouse effect.
The new EPA regulations make the US completely dependent on fracking moving forwards.
Next on their agenda is to shut down fracking, which unlike CO2 represents an actual environmental hazard.
Junk Science Week: IPCC commissioned models to see if global warming would reach dangerous levels this century. Consensus is ‘no’
Even if you pile crazy assumption upon crazy assumption, you cannot even manage to make climate change cause minor damage
The debate over climate change is horribly polarized. From the way it is conducted, you would think that only two positions are possible: that the whole thing is a hoax or that catastrophe is inevitable. In fact there is room for lots of intermediate positions, including the view I hold, which is that man-made climate change is real but not likely to do much harm, let alone prove to be the greatest crisis facing humankind this century
Antarctic sea ice area is at an all-time record high for the date, and is increasing since 1979 at a rate of 52,000 Manhattans per century.
The NSIDC web site has links to articles citing the threat to penguins from declining sea ice in Antarctica.
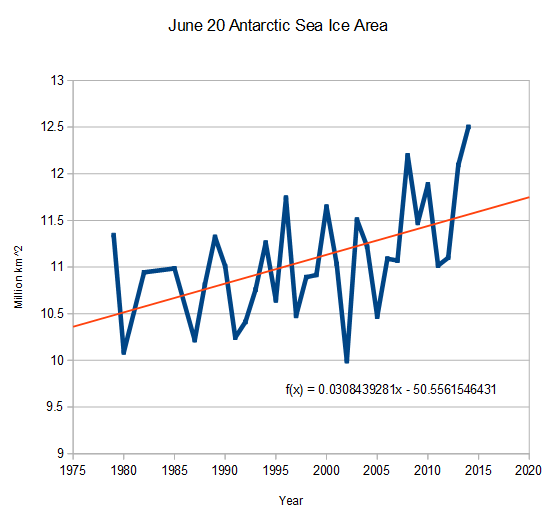 http://arctic.atmos.uiuc.edu/cryosphere/timeseries.south.anom.1979-2008
When future generations try to understand how the world got carried away around the end of the 20th century by the panic over global warming, few things will amaze them more than the part played in stoking up the scare by the fiddling of official temperature data. There was already much evidence of this seven years ago, when I was writing my history of the scare, The Real Global Warming Disaster. But now another damning example has been uncovered by Steven Goddard’s US blog Real Science, showing how shamelessly manipulated has been one of the world’s most influential climate records, the graph of US surface temperature records published by the National Oceanic and Atmospheric Administration (NOAA).
Goddard shows how, in recent years, NOAA’s US Historical Climatology Network (USHCN) has been “adjusting” its record by replacing real temperatures with data “fabricated” by computer models. The effect of this has been to downgrade earlier temperatures and to exaggerate those from recent decades, to give the impression that the Earth has been warming up much more than is justified by the actual data. In several posts headed “Data tampering at USHCN/GISS”, Goddard compares the currently published temperature graphs with those based only on temperatures measured at the time. These show that the US has actually been cooling since the Thirties, the hottest decade on record; whereas the latest graph, nearly half of it based on “fabricated” data, shows it to have been warming at a rate equivalent to more than 3 degrees centigrade per century.
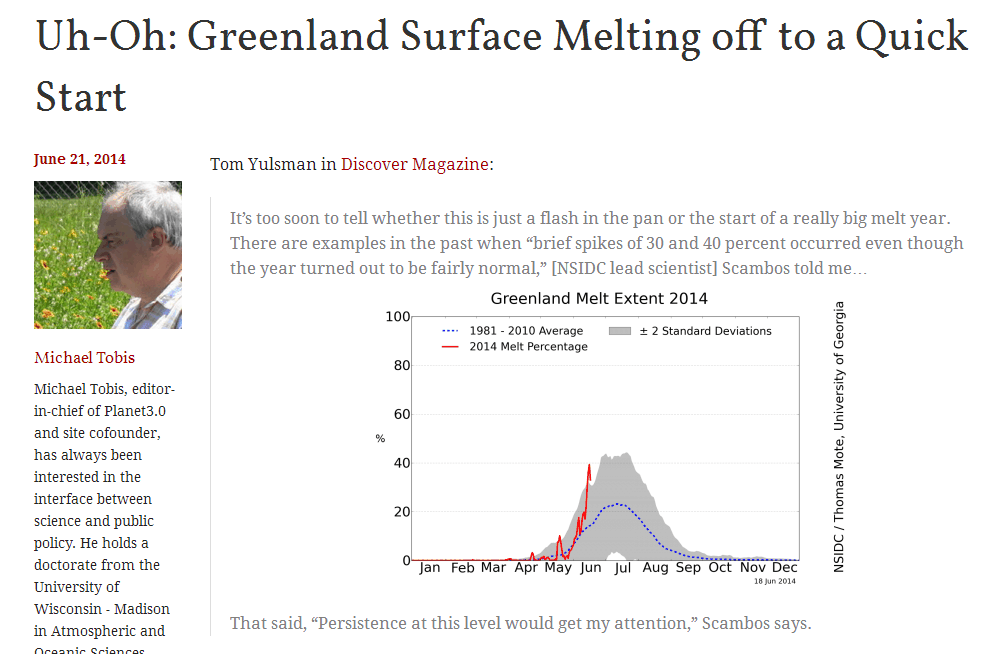
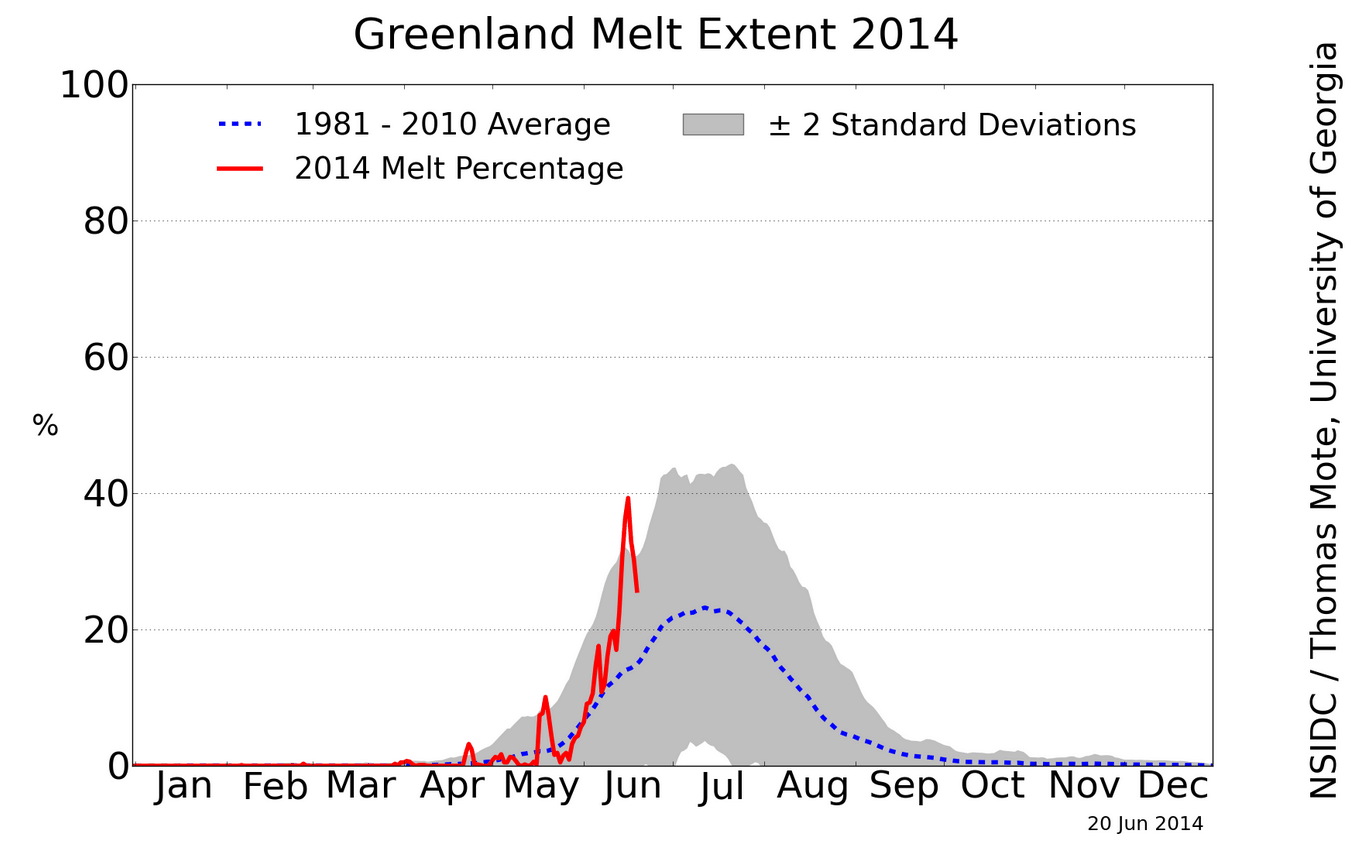
Yesterday, the team was hysterical about a tiny amount of surface melt across 40% of Greenland’s ice sheet.
Uh-Oh: Greenland Surface Melting off to a Quick Start | Planet3.0
Today, the spike is gone. Eighteen years of no global warming is just weather, but one relatively warm day in one location is climate.
Greenland Ice Sheet Today | Surface Melt Data presented by NSIDC