Motherlode Part IV

In 1999, Hansen was unhappy that the US didn’t show any warming.

Whither U.S. Climate?

By James Hansen, Reto Ruedy, Jay Glascoe and Makiko Sato — August 1999

What’s happening to our climate? Was the heat wave and drought in the Eastern United States in 1999 a sign of global warming?

Empirical evidence does not lend much support to the notion that climate is headed precipitately toward more extreme heat and drought. The drought of 1999 covered a smaller area than the 1988 drought, when the Mississippi almost dried up. And 1988 was a temporary inconvenience as compared with repeated droughts during the 1930s “Dust Bowl” that caused an exodus from the prairies, as chronicled in Steinbeck’s Grapes of Wrath.

How can the absence of clear climate change in the United States be reconciled with continued reports of record global temperature? Part of the “answer” is that U.S. climate has been following a different course than global climate, at least so far. Figure 1 compares the temperature history in the U.S. and the world for the past 120 years. The U.S. has warmed during the past century, but the warming hardly exceeds year-to-year variability. Indeed, in the U.S. the warmest decade was the 1930s and the warmest year was 1934. Global temperature, in contrast, had passed 1930s values by 1980 and the world has warmed at a remarkable rate over the last 25 years.
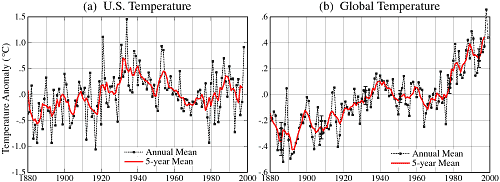
fig1x (1)

NASA GISS: Science Briefs: Whither U.S. Climate?

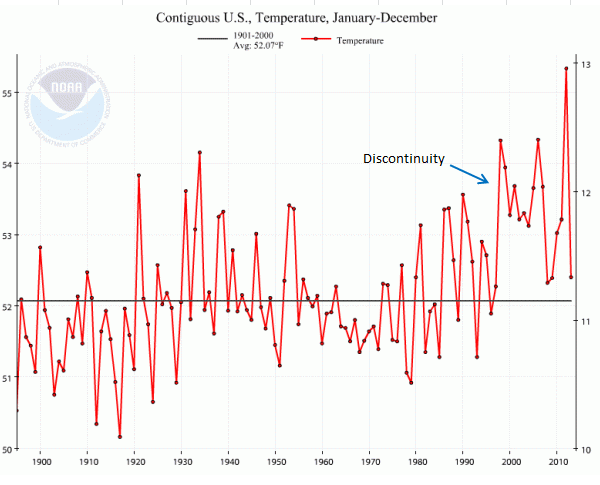
So they fixed it during the the next year.
ScreenHunter_64 Jan. 19 00.08

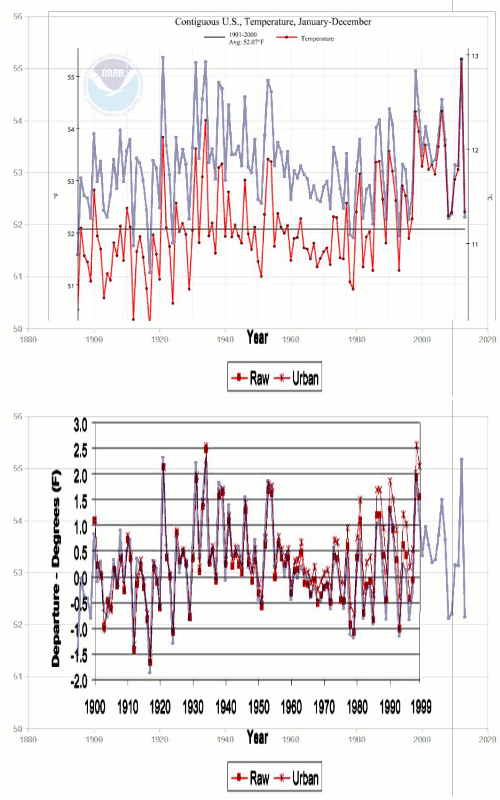
But they were quite clever how they did it. Going from USHCN V1 to  V2 they shifted all of the older temperatures downwards, as seen in this animation. This created a non-existent upwards spike, and brought US temperature trends in line with Hansen’s theory.
USHCNV1V2Error

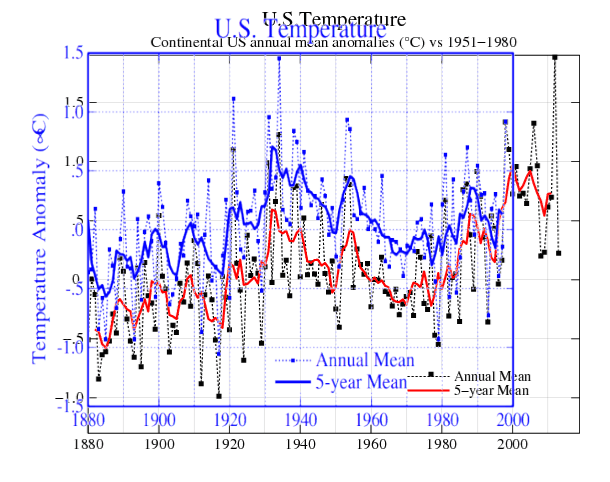
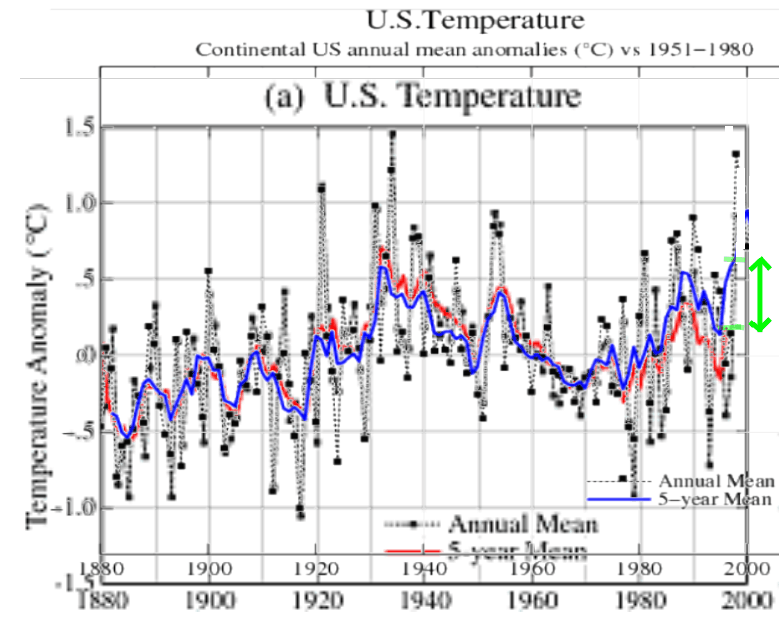
The green arrow below shows the 0.5C upwards shift in the five year mean anomaly line, made between the 1999 version (red) and the current version in blue.
ScreenHunter_289 Feb. 22 07.02

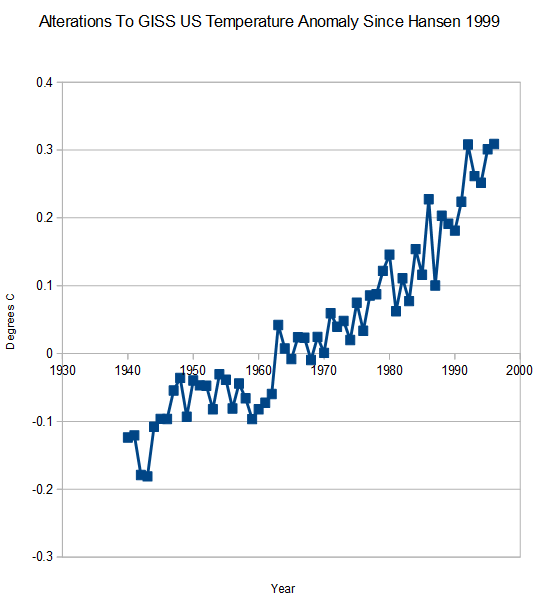
Closer analysis reveals that it is a hockey stick of exponential data tampering since 1940. Remember that they shifted the baseline temperatures downwards, so the absolute anomaly numbers don’t mean anything. What is important is the magnitude and shape of the curve.
ScreenHunter_292 Feb. 22 07.20

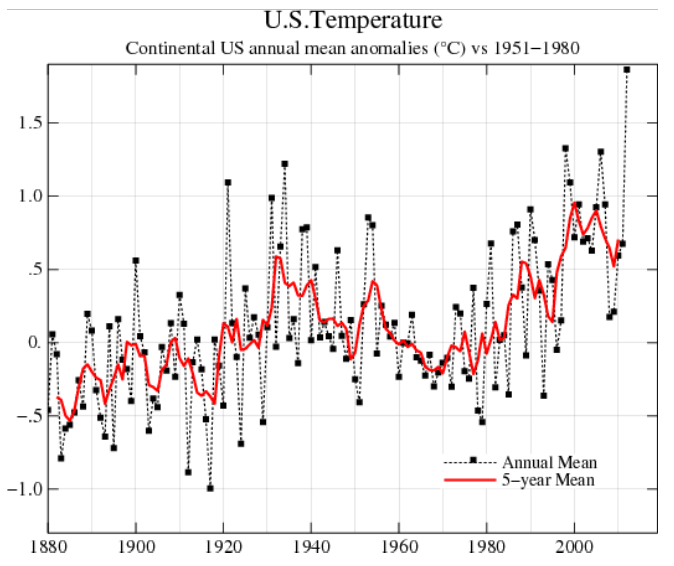
This data tampering brought the US in line with the rest of the world, and secured billions in global warming research funding. The current GISS US temperature graph has a nice hockey stick in it, courtesy of massive tampering by NOAA/NASA.
ScreenHunter_287 Feb. 22 06.54

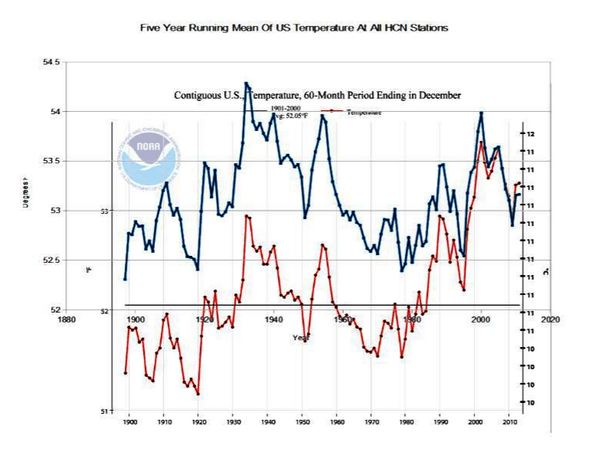
This next graph shows the raw data (blue) and the NCDC published data in red. It shows how they cool the past in their published graphs, and create the appearance of warming – which is not indicated by the thermometer data.
BgqD5wpCMAAjkG3

Posted in Uncategorized | 13 Comments

Always Working To Make The Simple Minded Happy

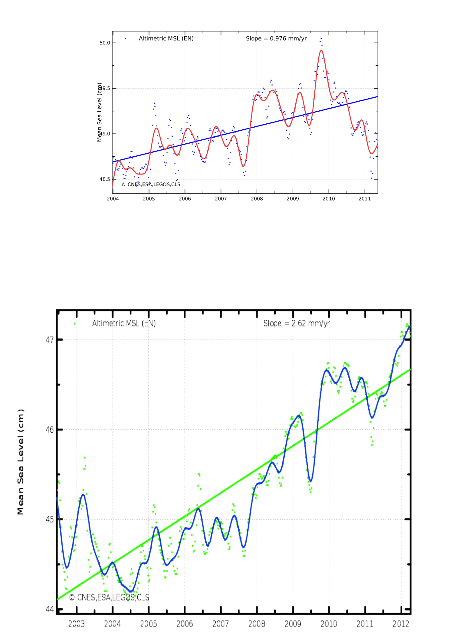
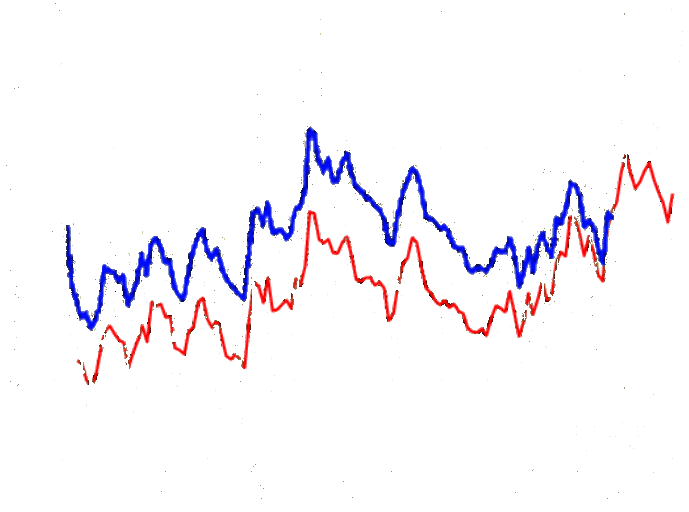
Some alarmist objected to this graph showing how Envisat has been tampered with

ScreenHunter_259 Feb. 21 07.36

He complained that I didn’t have the Y-axes numerically aligned. (Alarmists love meaningless absolute numbers.)

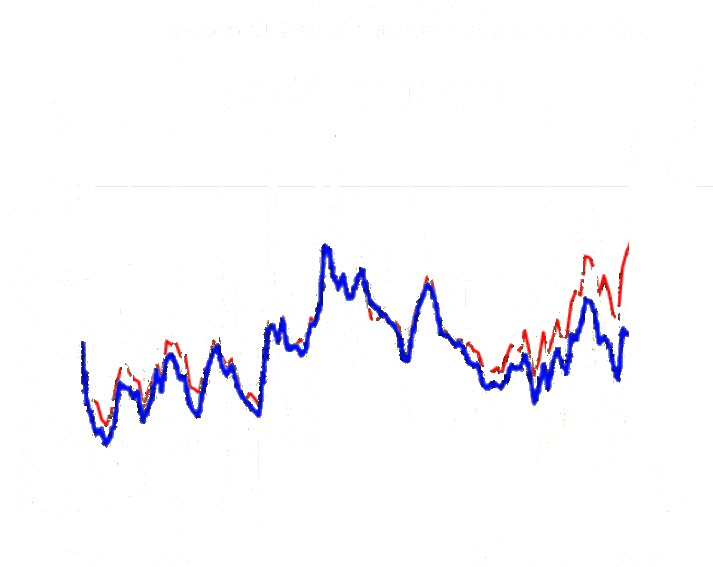
So I obliged him, and produced another version which aligns the meaningless absolute Y-axis numbers.

ScreenHunter_283 Feb. 22 06.21

Posted in Uncategorized | 3 Comments

A Beautiful Sight

I was at the gym tonight and looked up just as Mikaela Shiffrin started her slalom run. It was one of the most amazing athletic performances I have ever seen. She took an almost perfect line down the slope with only one mistake which  she recovered from immediately.

I used to do a lot of ski racing, and she would have won the men’s gold medal not too many years ago with a run like that.

Posted in Uncategorized | 4 Comments

My Summer Arctic Forecast

The western Arctic has the most thick ice it has had since this time in 2007.  This might lead a person to project that there will be minimal reduction in ice extent this summer.

But what happened in 2007? Very strong winds pushed the ice out of the Western Arctic.

So my prediction is “no prediction.”

Posted in Uncategorized | 13 Comments

Helping Out The Simple Minded Stalker, Brandon

I removed all of the black lines and numbers which confuse Brandon the stalker.

In the blue 1999 version of US temperatures, 1932 was much warmer than 1997. In the red 2014 version, 1997 is warmer than 1932. The total amount of tampering up to 1997 was 0.5C.

ScreenHunter_281 Feb. 21 21.56


Here is another way of looking at it, normalized to 1932. In this view, 1997  has been tampered upwards by 0.5C. No matter how you line them up, the total amount of tampering is always going to be 0.5C.

ScreenHunter_282 Feb. 21 22.08

Posted in Uncategorized | 3 Comments

Who Is This Stalker?

Some Internet stalker named Brandon is incapable of understanding how a graph like this shows the total magnitude of data tampering.

ScreenHunter_251 Feb. 06 11.02

By lining up the five year running means at the most recent common date (in this case 1997) the gap shows the total magnitude of the data tampering –  i.e. the sum of older cooling  + newer warming.

If there was no data tampering, there would be no gap.

If the total magnitude of the data tampering was 0.5 degrees, then there would be a gap of 0.5 degrees.

If the total magnitude of the data tampering (older cooling  + newer warming) was 1.0 degrees, then there would be a gap of 1.0 degrees.

This is very basic logic, but this stalker is going all over the Internet trashing me, because he is apparently too dense to understand very simple concepts

Posted in Uncategorized | 15 Comments

My Toto Moment

I just got back from a bike ride in the foothills. The wind was blowing so hard, that I had to get off the bike and walk – going down a steep hill. The bike was acting like a kite in the cross wind, and I would have been thrown off into the ditch.

ScreenHunter_274 Feb. 21 13.14

Posted in Uncategorized | 20 Comments

Latest Propaganda From The Criminal Left

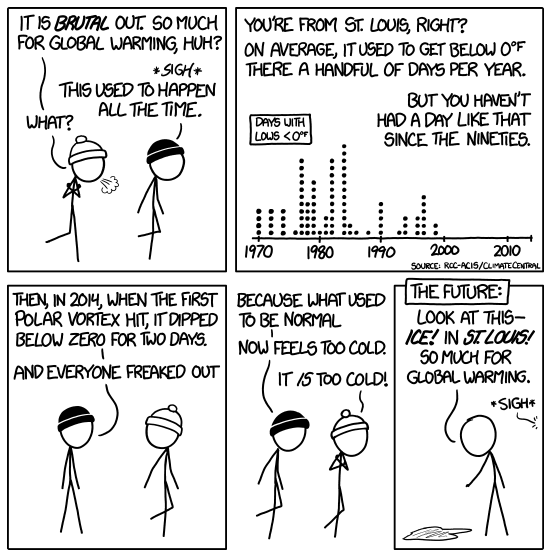
Media Matters tells their readers that time began during the 1970’s ice age scare.

ScreenHunter_271 Feb. 21 10.22

Right-Wing Globe Contains Less Than Two Percent Of The Earth | Blog | Media Matters for America

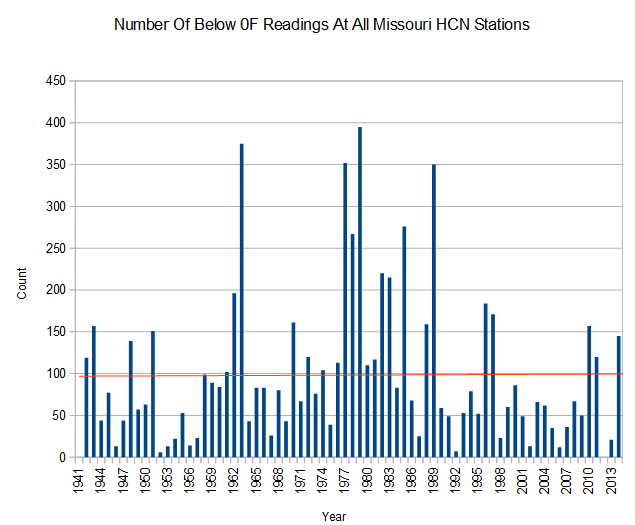
There is no long term trend in zero degree weather in Missouri. As always, Media Matters is working to make their readers stupid left wing criminals, like themselves.

ScreenHunter_269 Feb. 21 10.15

Posted in Uncategorized | 36 Comments

The Dirty Little Negative Feedback

Low Arctic ice extent in September is a negative feedback, not a positive one.

There is very little sunlight and the sun is at a low angle, so low September ice area has little impact on the SW radiative balance. But open water below with dry polar air above, allows lots of LW radiation to escape into space – cooling the planet.

Posted in Uncategorized | 13 Comments

Looking Forward To The Next Polar Vortex

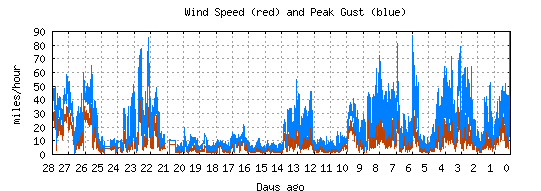
Hopefully the cold air will get here soon and change the weather pattern. The jet stream has been sitting right over us for a month, and it has been a constant hurricane – except for the week of record cold at the start of the month.

ScreenHunter_264 Feb. 21 08.28

NCAR Mesa Lab Weather (english, monthly)

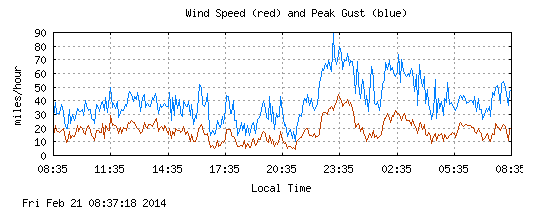
90 MPH winds last night.

ScreenHunter_265 Feb. 21 08.34

Posted in Uncategorized | 5 Comments