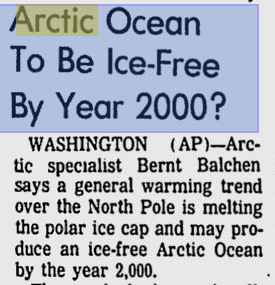
Overwhelming Evidence Of Data Tampering At NASA

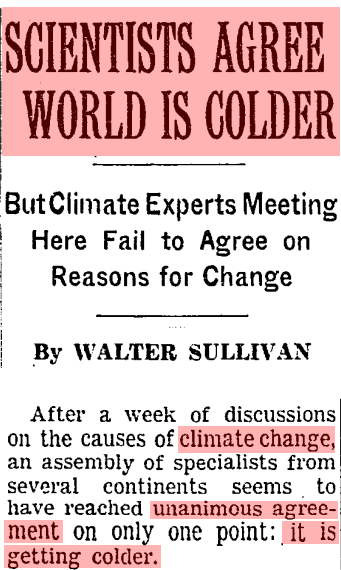
In 1961, there was 100% consensus that the Earth was cooling

ScreenHunter_343 Feb. 23 06.21

ScreenHunter_344 Feb. 23 06.21

SCIENTISTS AGREE WORLD IS COLDER – But Climate Experts Meeting Here Fail to Agree on Reasons for Change – View Article – NYTimes.com

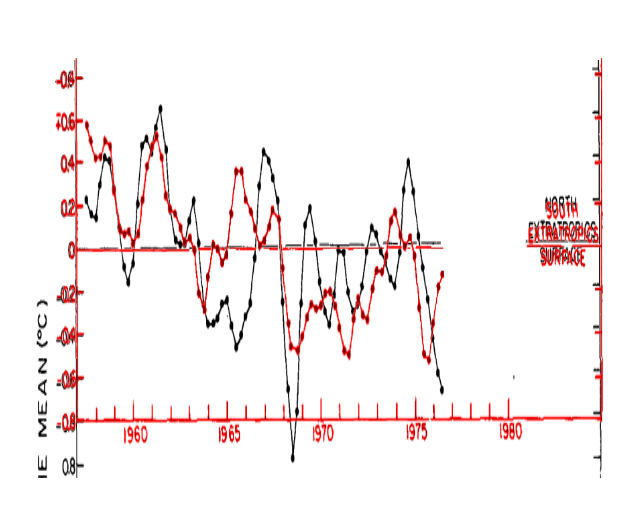
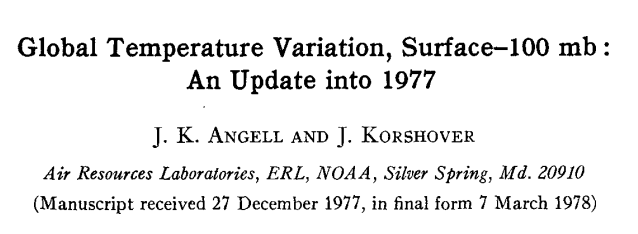
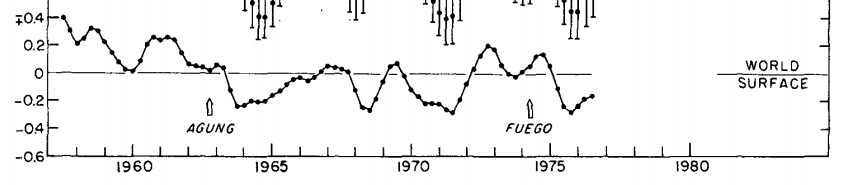
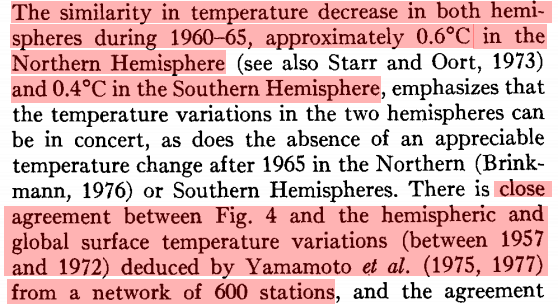
In 1978, NOAA published this graph of global temperatures, showing 0.4C cooling from 1958-1960 and 0.6C cooling from 1958-1976
ScreenHunter_348 Feb. 23 06.51

ScreenHunter_333 Feb. 22 23.08

This cooling agreed with other studies done at the time.

ScreenHunter_350 Feb. 23 06.55

journals.ametsoc.org/doi/pdf/10.1175/1520-0493(1978)106<0755%3AGTVSMA>2.0.CO%3B2
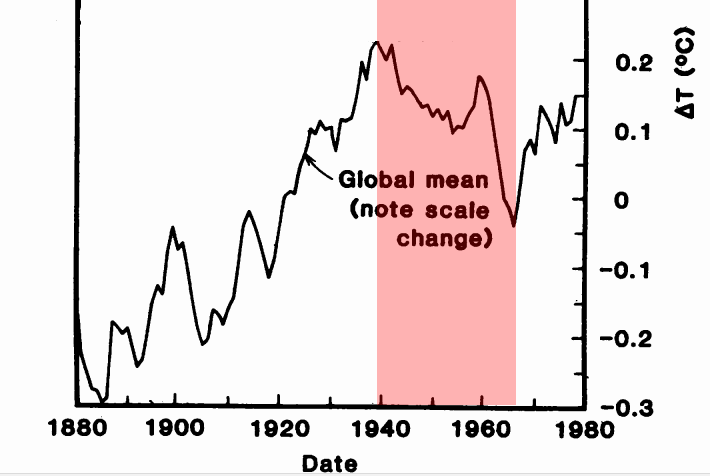
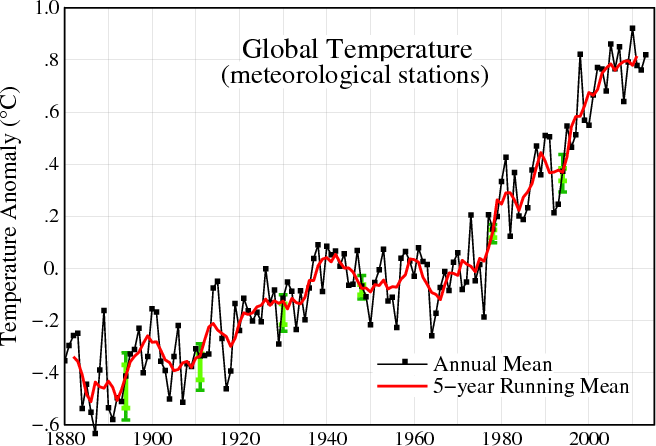
But NASA’s current global temperature graph doesn’t show any cooling around 1960
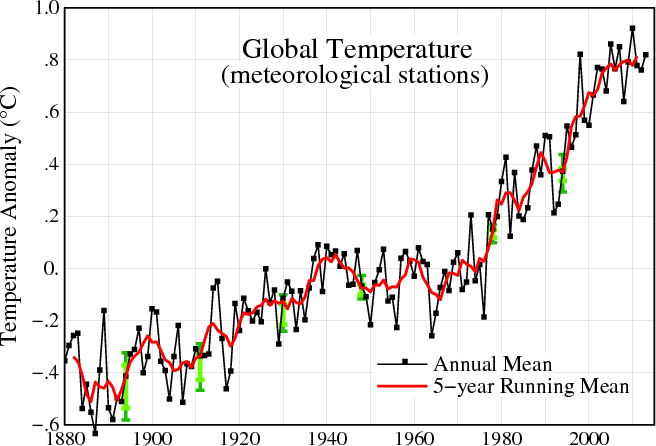
Fig.A (13)

Fig.A.gif (656×446)

The next graph overlays NOAA 1978 in red on the same section of NASA. You can see that NASA has deleted the unanimously agreed upon late 1950’s warmth and much of the 1970’s cold.
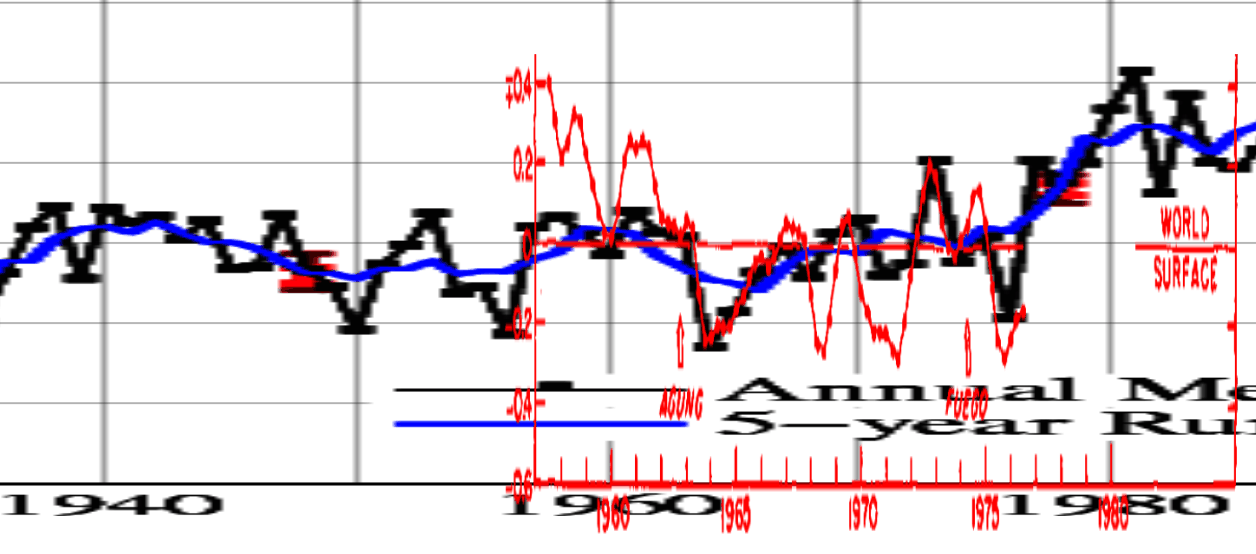
ScreenHunter_342 Feb. 23 06.19

As late as 1981, NASA’s James Hansen knew about this cooling
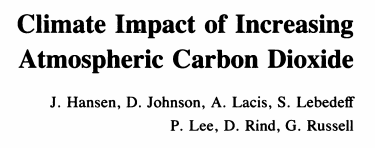
ScreenHunter_347 Feb. 23 06.49ScreenHunter_346 Feb. 23 06.49

pubs.giss.nasa.gov/docs/1981/1981_Hansen_etal_1.pdf

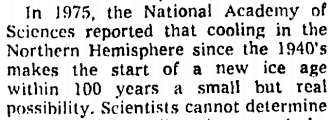
The National Academy Of Sciences knew about this cooling

ScreenHunter_352 Feb. 23 07.01

https://ia801806.us.archive.org/7/items/understandingcli00unit/understandingcli00unit.pdf
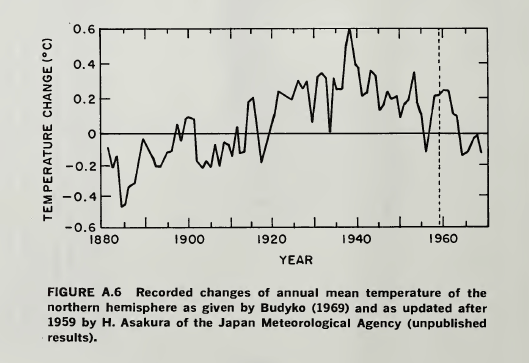
BdmQ8nVCYAAVfJ1

ScreenHunter_351 Feb. 23 06.59

War of the Weathers – View Article – NYTimes.com

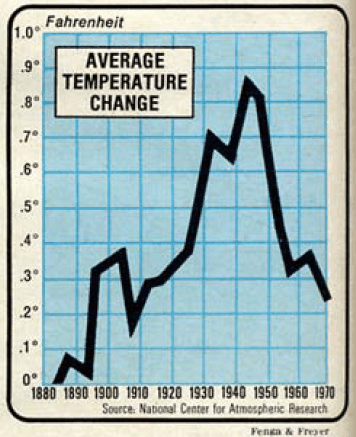
NCAR knew about this cooling

ScreenHunter_353 Feb. 23 07.03

denisdutton.com/newsweek_coolingworld.pdf

At some point after 1981, NASA’s James Hansen made the inconvenient cooling disappear. We need to figure out how he and the rest of the team did it.

From: Tom Wigley <[email protected]>
To: Phil Jones <[email protected]>
Subject: 1940s
Date: Sun, 27 Sep 2009 23:25:38 -0600
Cc: Ben Santer <[email protected]>

It would be good to remove at least part of the 1940s blip, but we are still left with “why the blip”.

di2.nu/foia/1254108338.txt

Posted in Uncategorized | 7 Comments

Motherlode Part V

In 1978, NOAA showed about 0.6C global cooling from the mid-1950’s to 1970

ScreenHunter_333 Feb. 22 23.08

journals.ametsoc.org/doi/pdf/10.1175/1520-0493(1978)106<0755%3AGTVSMA>2.0.CO%3B2

GISS has since deleted almost all of that cooling.

Fig.A (13)

Fig.A.gif (656×446)

The next graph overlays the 1978 NOAA in red, on top of GISS in blue. GISS has completely erased the huge 1940’s spike, just as Climategate scientists said they wanted to do.

ScreenHunter_340 Feb. 23 03.38

Posted in Uncategorized | 7 Comments

Unarmed Civilians Being Murdered By Their Own Government

Progressives hope to do the same to Americans

[youtube=http://www.youtube.com/watch?v=GHq-4a0sIAo]

h/t to Dave G

Posted in Uncategorized | 13 Comments

The Plot Thickens

In 1978, NOAA showed that both hemispheres cooled sharply from the 1950’s through 1970ScreenHunter_327 Feb. 22 19.30

journals.ametsoc.org/doi/pdf/10.1175/1520-0493(1978)106<0755%3AGTVSMA>2.0.CO%3B2

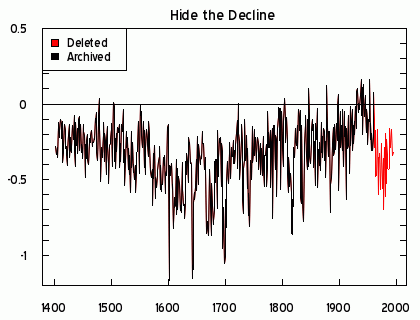
They have since erased this cooling in both hemispheres.  They had to get rid of it, because it agreed with Briffa’s trees – making it impossible to hide the decline.

briffa_recon-1-1

Posted in Uncategorized | 4 Comments

Another Piece Of The Global Cooling History Destruction Puzzle

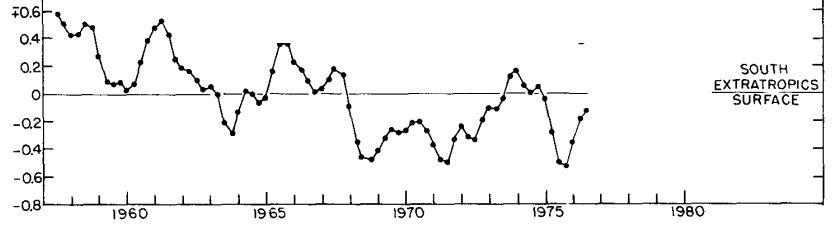
In 1978, NOAA published this graph showing nearly a full degree cooling in the southern latitudes between 1955 and 1970.

ScreenHunter_316 Feb. 22 14.06

journals.ametsoc.org/doi/pdf/10.1175/1520-0493(1978)106<0755%3AGTVSMA>2.0.CO%3B2

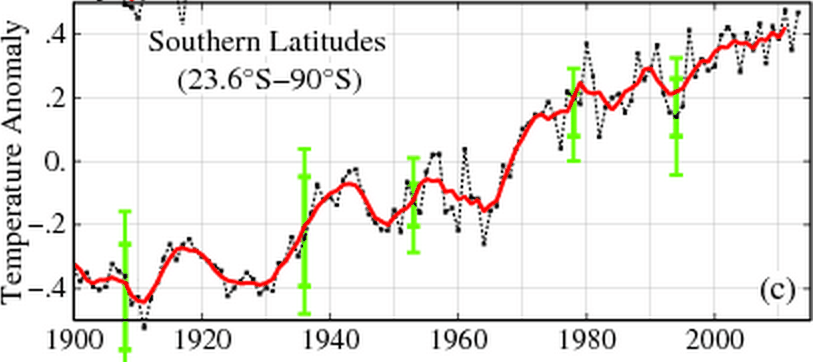
GISS has erased 90% of this cooling.

ScreenHunter_318 Feb. 22 14.09

 Fig.B.gif (407×678)

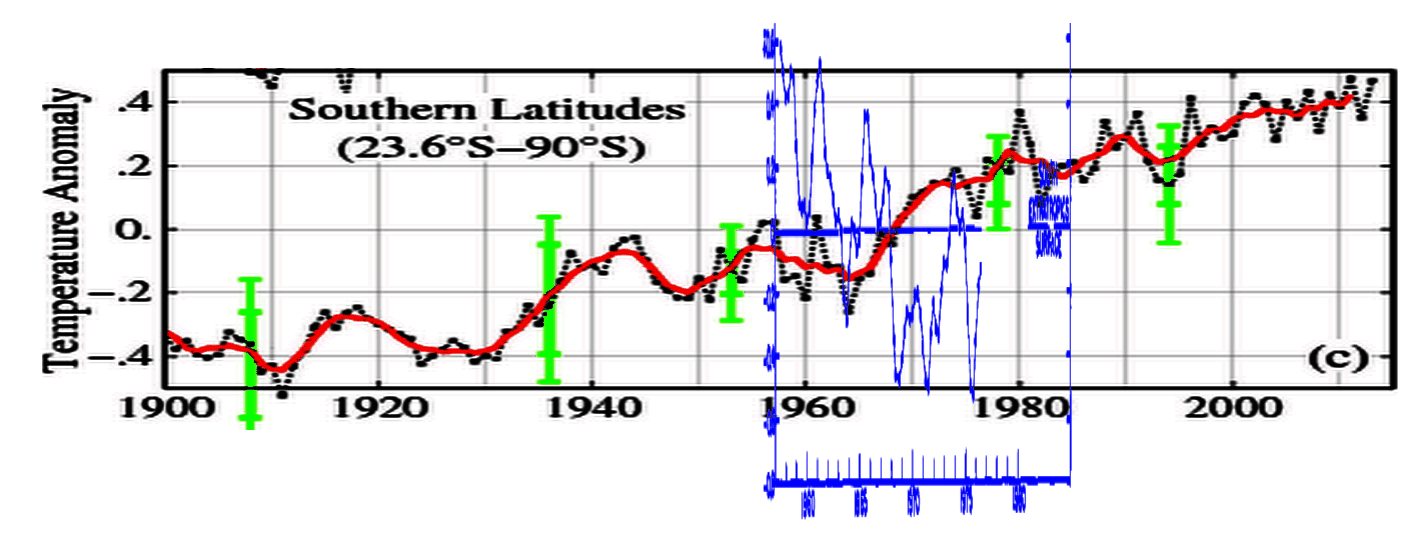
The next graph overlays the 1978 NOAA data in blue on the current GISS data. They bear no resemblance.

ScreenHunter_320 Feb. 22 14.17

Much of the excuse for getting rid of northern hemisphere cooling was because they didn’t see it in the southern hemisphere. Apparently that was because they got rid of the southern hemisphere cooling first.

Then -after they got rid of the northern hemisphere cooling, the IPCC was able to throw out Briffa’s trees and create the hockey stick.

h/t to Alec aka Daffy Duck for the NOAA graph

Posted in Uncategorized | 6 Comments

Tampering Competition

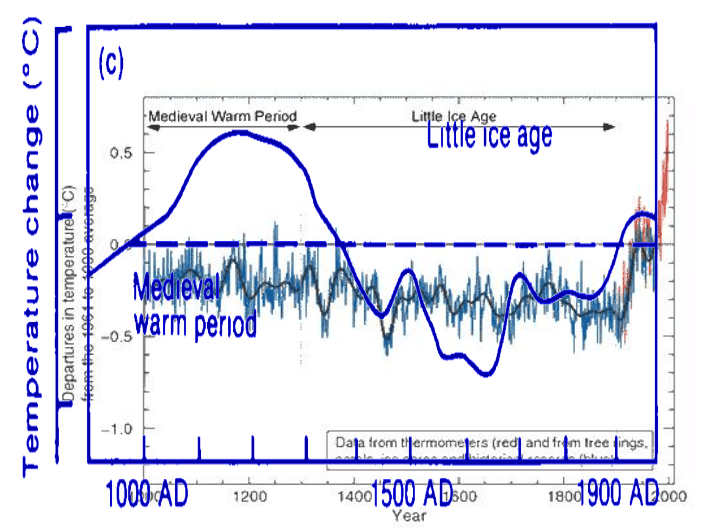
Not wanting to be outdone by NASA and NOAA, the rest of the hockey team erased the MWP and the LIA, between the 1990 IPCC report (blue) and the 2001 IPCC report.

ScreenHunter_313 Feb. 22 13.06

It appears that the year 2000 was a banner year for data tampering

Posted in Uncategorized | 5 Comments

Understanding The 1979 Arctic Ice Cherry Pick

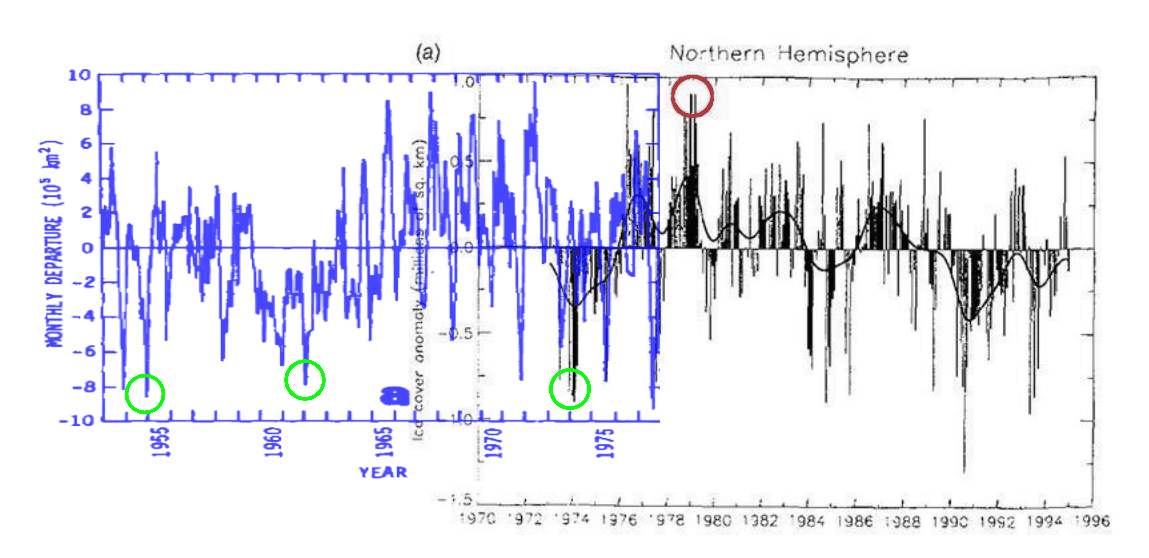
Climate fraudsters like to claim that Earth began in 1979, the year of peak Arctic sea ice. The graph below shows why. If they started their graph in 1954, there would be almost no downwards trend to the present.ScreenHunter_306 Feb. 22 10.26

journals.ametsoc.org/doi/pdf/10.1175/1520-0485(1979)009<0580%3AAAOASI>2.0.CO%3B2

ScreenHunter_307 Feb. 22 10.35

Posted in Uncategorized | 8 Comments

Arctic Ice Area Similar To Early 1960’s And 1970’s

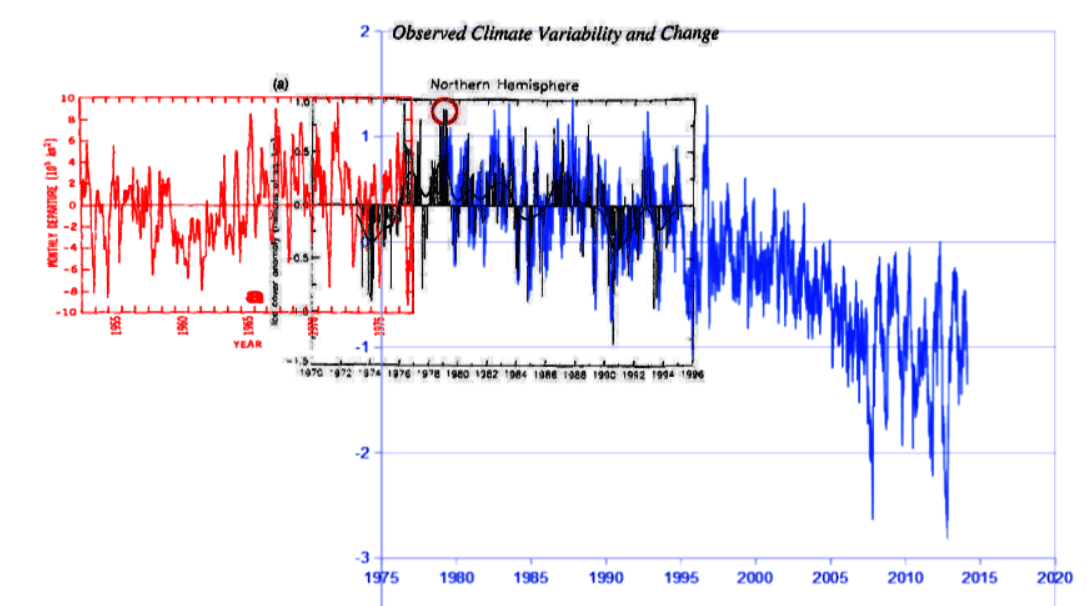
The graph below is a composite of a 1979 paper in the Journal of Physical Oceanography (red) the second IPCC report (black) and University of Illinois Arctic sea ice data. Current anomalies are a little lower than the early 1960’s and early 1970’s.

ScreenHunter_305 Feb. 22 10.20

journals.ametsoc.org/doi/pdf/10.1175/1520-0485(1979)009<0580%3AAAOASI>2.0.CO%3B2

arctic.atmos.uiuc.edu/cryosphere/timeseries.anom.1979-2008

h/t to Alec aka Daffy Duck

http://news.google.com/newspapers

Posted in Uncategorized | 21 Comments

The Relationship Between The Cart And The Horse

Most people are intelligent enough to understand that the horse pulls the cart, but not climate scientists.

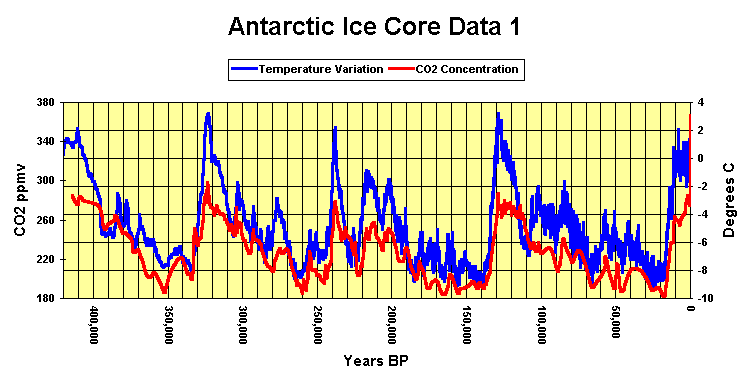
As ocean temperature rises, CO2 solubility decreases – pushing more CO2 into the atmosphere. Thus we see CO2  trailing temperature in ice cores.

IceCores1

IceCores1.gif (750×380)

An entire religion has developed around a backwards view of this relationship. Al Gore’s buddy Laurie David went so far as to reverse the relationship, in her book intended to pollute children’s minds with cult religious BS.

Posted in Uncategorized | 10 Comments

Happy News For Alarmists – Not

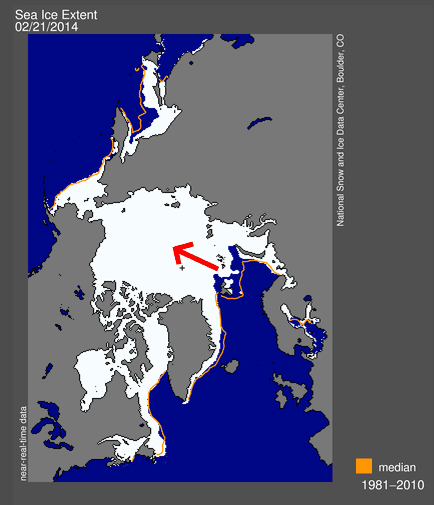
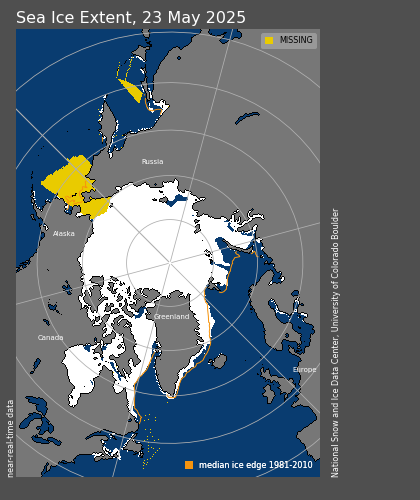
Our moron friends are excited about a small area of missing ice in the Barents Sea, which Jennifer Francis of Rutgers claims controls the global climate. You can think of her as the Hank Johnson of climate science.

The problem is that the gap is there because winds are pushing the ice towards Alaska, where it is piling up and thickening – and will be harder to melt during the summer.

ScreenHunter_293 Feb. 22 07.56


N_daily_extent.png (420×500)

Posted in Uncategorized | 6 Comments