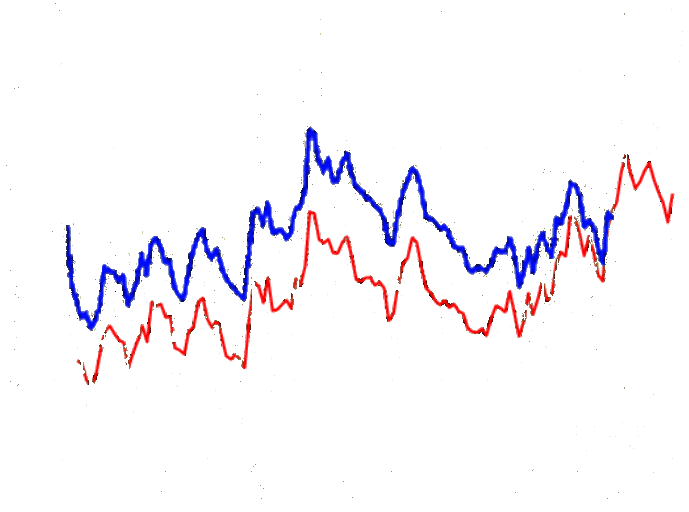
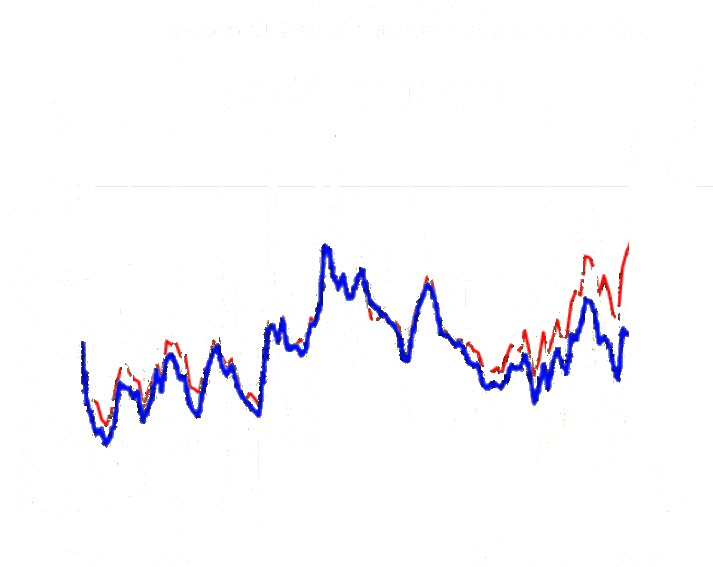
Some Internet stalker named Brandon is incapable of understanding how a graph like this shows the total magnitude of data tampering.
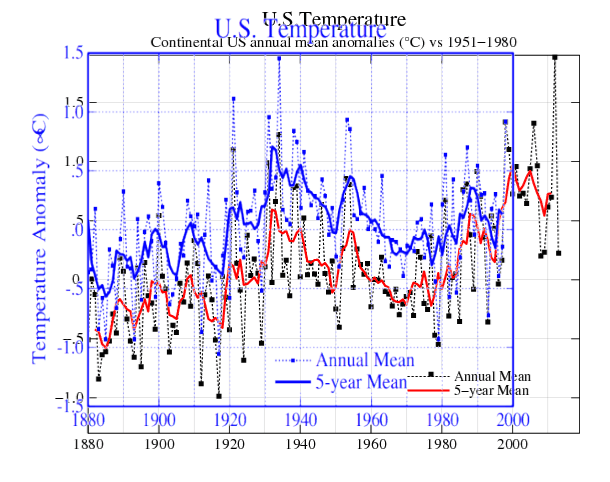
By lining up the five year running means at the most recent common date (in this case 1997) the gap shows the total magnitude of the data tampering – i.e. the sum of older cooling + newer warming.
If there was no data tampering, there would be no gap.
If the total magnitude of the data tampering was 0.5 degrees, then there would be a gap of 0.5 degrees.
If the total magnitude of the data tampering (older cooling + newer warming) was 1.0 degrees, then there would be a gap of 1.0 degrees.
This is very basic logic, but this stalker is going all over the Internet trashing me, because he is apparently too dense to understand very simple concepts