
Every summer since the year 2000 has had below normal temperatures north of 80N.
http://ocean.dmi.dk/arctic/meant80n.uk.php
People forecasting an ice-free Arctic have no idea what they are talking about.
Every summer since the year 2000 has had below normal temperatures north of 80N.
http://ocean.dmi.dk/arctic/meant80n.uk.php
People forecasting an ice-free Arctic have no idea what they are talking about.
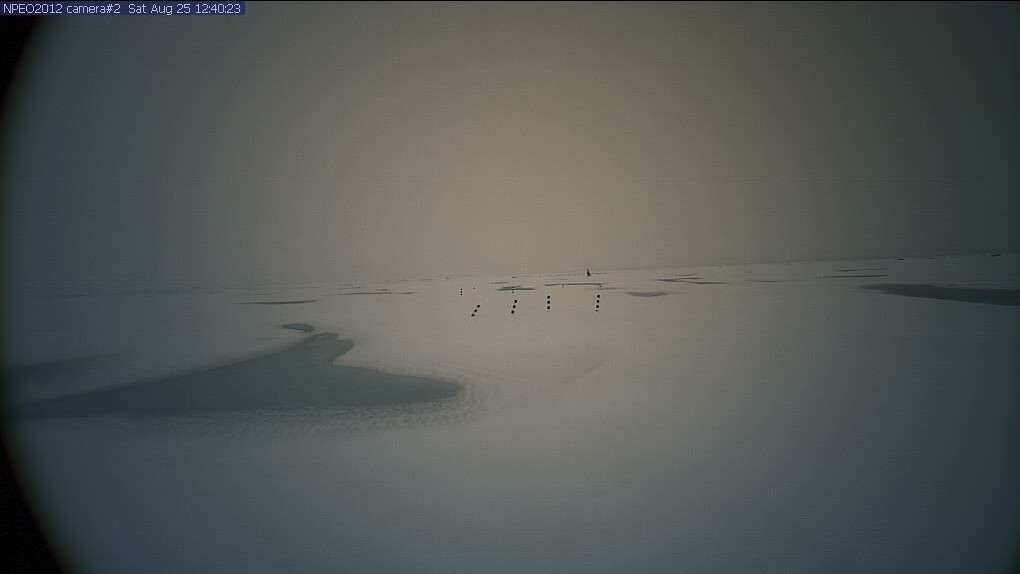
Temperatures were below normal all summer north of 80N, and very little melting occurred. Small melt ponds appeared and the planted poles tipped a little bit.
A sad day for humanity. Neil was the first person (and one of the last) to set foot on another world.
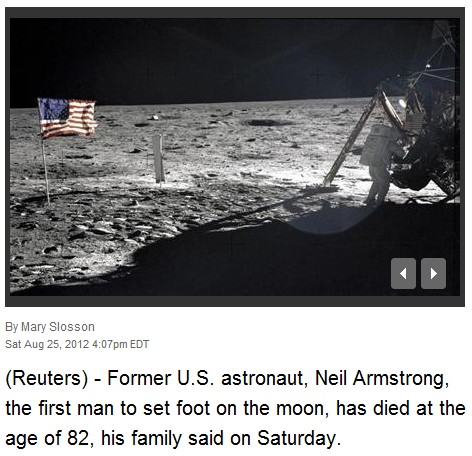
First man on moon Neil Armstrong dead at 82, family says | Reuters
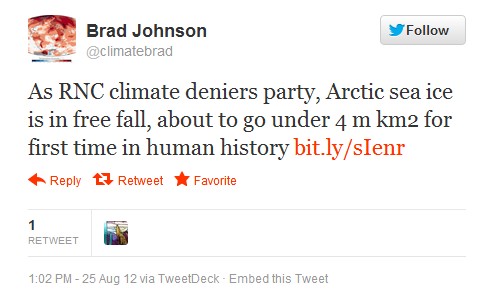
Twitter / climatebrad: As RNC climate deniers party, …
According to Dr. Walt Meier at NSIDC, the Arctic was completely free of ice sometime between 5,000 and 15,000 years ago. Apparently Brad Johnson believes that human history is less than 5,000 years.
There is nothing unusual happening the Arctic. Some years are a little higher or lower than others. These people are nuts.
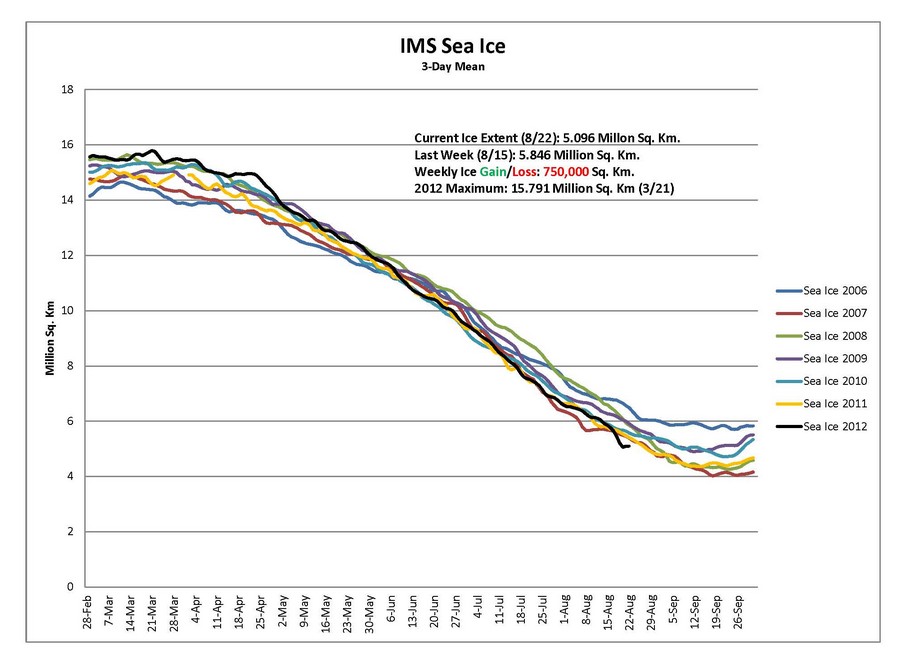
h/t to Marc Morano
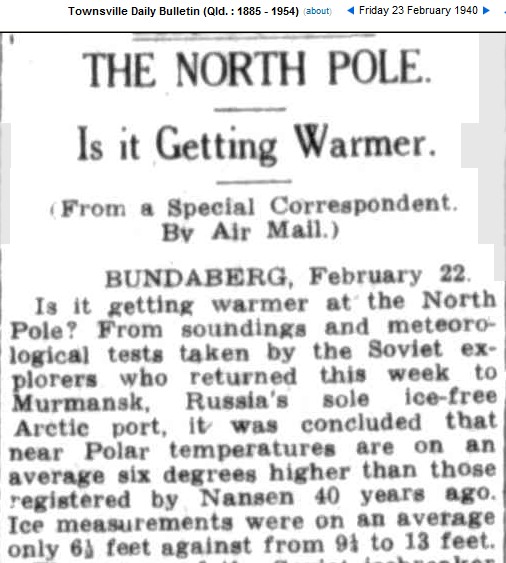
23 Feb 1940 – THE NORTH POLE. Is it Getting Warmer. | BUNDABER…
The ice at the north pole was two metres thick in 1940. It is still two metres thick.
A winter storm broke up the ice in the Chukchi Sea at the beginning of the month and dragged warm water to the surface. As you can see from the animation above, not much else happened this month.
What does an early winter storm have to do with global warming?
-Storm area 1 million square kilometers
-Wave height of 2 to 3 meters broke apart ice into smaller chunks, increasing surface area and thus melting
-Storm mixed fresh water at surface (from melted ice) with deeper warmer saltier water from below increasing melting rate
-Storm agitated water to depths of 500 meters (where water is much warmer) bringing it to surface increasing melt rate
-Low pressure of storm center sucked up water level by 0.3 meters, causing warm water to flow into Arctic Ocean from Pacific Ocean via Bering Strait and from Atlantic Ocean, increasing melting
-Storm rotation (counterclockwise) spread out ice over larger area and pushed ice towards open ocean (on Atlantic Ocean side)
Julienne Stroeve NSIDC
Abramovich’s £25 million is paying off.
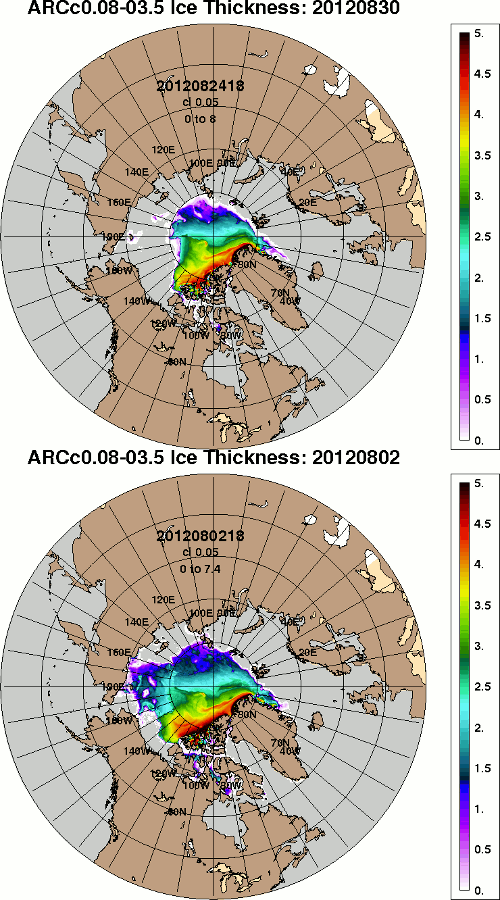
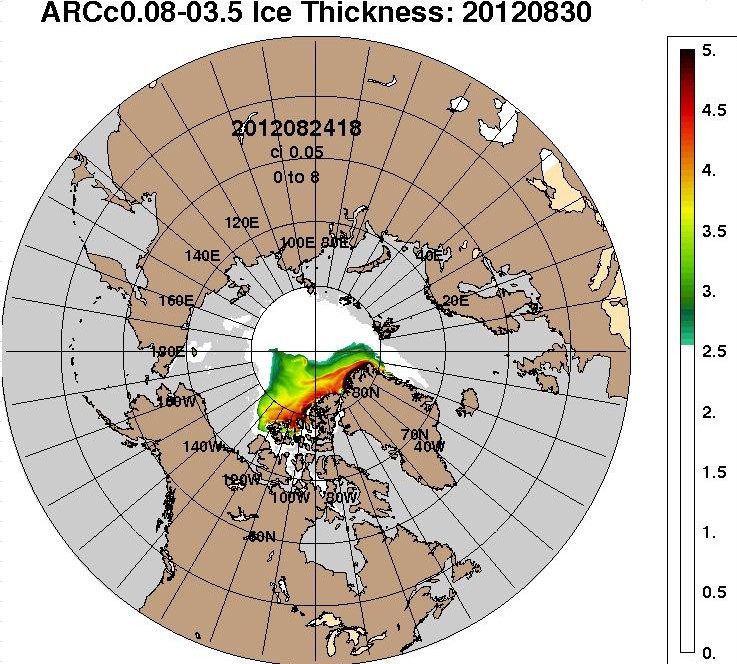
The US Navy shows a region larger than Alaska, of 8-16 foot thick ice. No doubt this will all melt at below 0 degrees C
The graph below shows the difference between USHCN average maximum and average minimum temperature since 1930. The gap is getting smaller due to UHI effects keeping nighttime temperatures up.
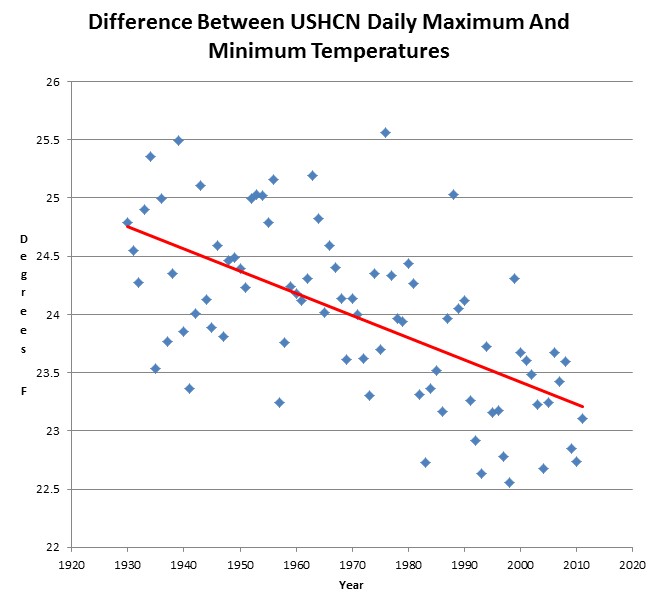
Alarmists claim that this is due to increased humidity caused by global warming, but as usual they have no idea what they are talking about.
Average long-term trends (1930 – 2010) indicate that temperature has warmed, but little change has occurred in dewpoint and specific humidity.
USHCN says that they make a 0.1F UHI adjustment, which is about 1500% too small.
Turquoise represents ice present in 2012 which wasn’t present at the 2007 minimum. Red shows the opposite. There is 36% more ice than there was at the 2007 minimum.
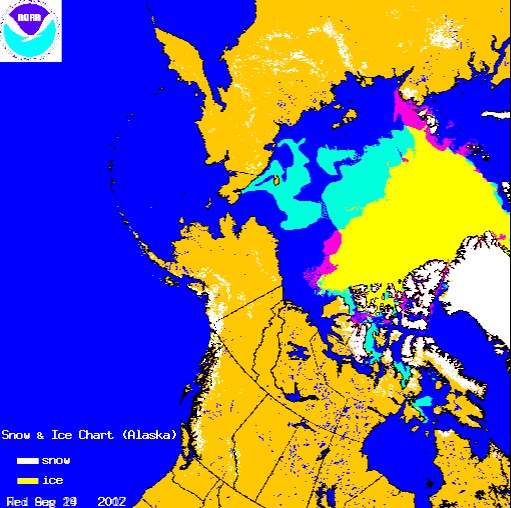
http://www.natice.noaa.gov/pub/ims/ims_gif/DATA/cursnow_alaska.gif
http://www.natice.noaa.gov/pub/ims/ims_gif/ARCHIVE/AK/2007/ims2007265_alaska.gif
Passive microwave measurements are missing vast areas of ice, because an early winter storm broke the ice up into chunks which the satellites are unable to detect. Alarmists are going hysterical, based on garbage data.


