DAYTON 1 WSW   	114
  RITZVILLE 1 SSE	112
  ODESSA         	110
  POMEROY        	109
  KENNEWICK      	108
  NORTHPORT      	108
  WILBUR         	105
  SUNNYSIDE      	103
  DAVENPORT      	102
  WENATCHEE      	102
  WINTHROP 1 WSW 	102
  ELLENSBURG     	100
Temperature forecast for Dayton today is 97
DAYTON 1 WSW 114 RITZVILLE 1 SSE 112 ODESSA 110 POMEROY 109 KENNEWICK 108 NORTHPORT 108 WILBUR 105 SUNNYSIDE 103 DAVENPORT 102 WENATCHEE 102 WINTHROP 1 WSW 102 ELLENSBURG 100
Temperature forecast for Dayton today is 97
August 1936 was spectacularly hot in much of the central and eastern US, but it isn’t happening in 2012. Their strategy of pouring on the lies during hot weather has hit a brick wall.
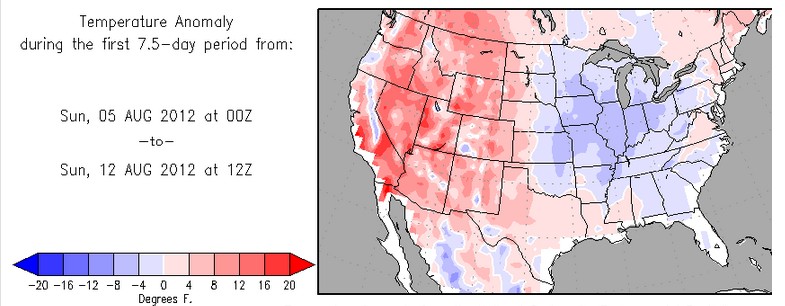
You can’t make this stuff up. He claims that the weather is the most extreme in 10,000 years based on a baseline of “the last few decades”
[youtube=http://www.youtube.com/watch?v=TX2KyF0p-xU]
What a brazen liar this man is. He wrote the exact opposite ten years ago.
Empirical evidence does not lend much support to the notion that climate is headed precipitately toward more extreme heat and drought. The drought of 1999 covered a smaller area than the 1988 drought, when the Mississippi almost dried up. And 1988 was a temporary inconvenience as compared with repeated droughts during the 1930s “Dust Bowl” that caused an exodus from the prairies, as chronicled in Steinbeck’s Grapes of Wrath.
There were twice as many daily all-time high temperature records set or tied during the 1930s as in the 2000s, for USHCN stations which were operational during both decades. That is why he doesn’t start his baseline until the 1950s.
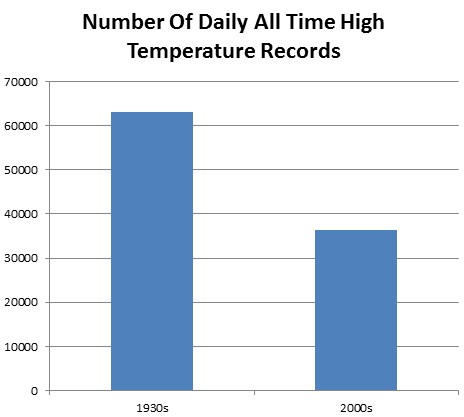
Perhaps the 1930s was more than 10,000 years ago?
Barring a huge change in the weather, the map below shows the minimum possible extent for 2012 vs. 2007
Green is 2012 and red is 2007. This is based on current ice thickness and temperature forecasts. Chances are that 2012 will finish larger than what I showed, because there is a lot of MYI in the Chukchi Sea which is not likely to melt out.
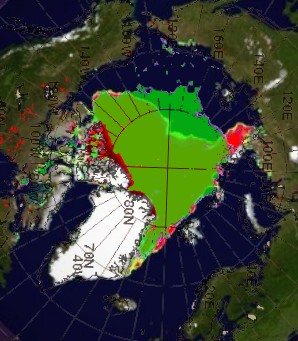
The only thing which could change this would be very strong southerly winds, like those which occurred in late summer 2007.
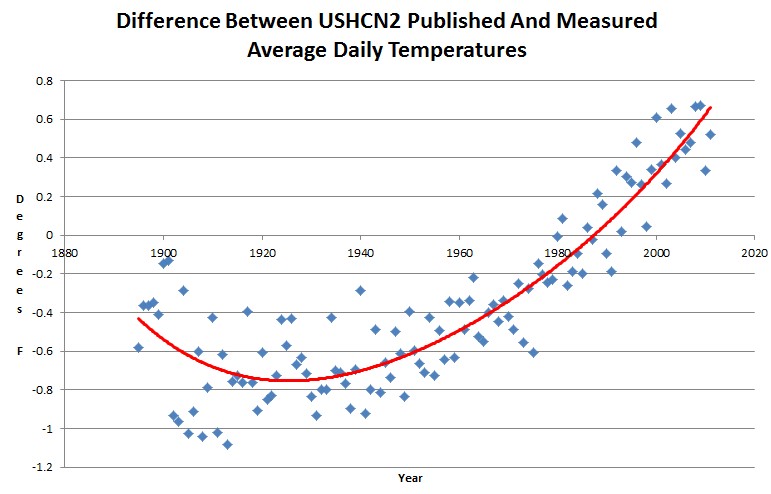
According to Tom Karl, Americans are very stupid people who have severe trouble taking temperature readings – except during the year 1988. Americans are currently in an exponentially increasing stupid state, where temperatures need to be adjusted upwards by more and more every year.
In other words, USHCN is desperately trying to hide the decline.
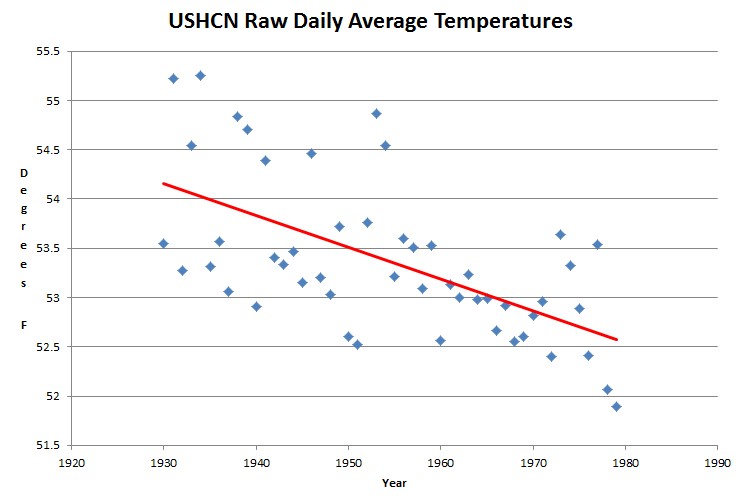
One of our readers says that 1979 was an anomaly.
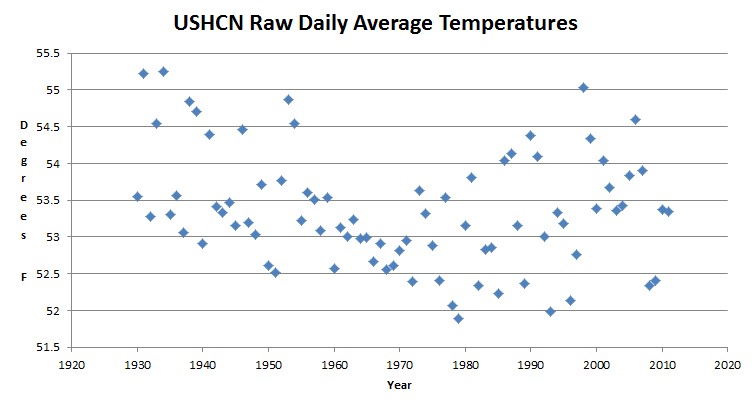
Similar story in Greenland. Temperatures bottomed right when satellites went up, making satellite data extremely misleading.
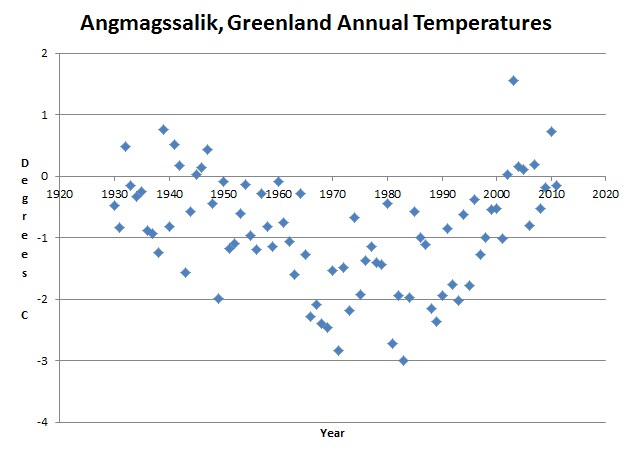
The research by a man often called the “godfather of global warming” says that the likelihood of such temperatures occurring from the 1950s through the 1980s was rarer than 1 in 300. Now, the odds are closer to 1 in 10, according to the study by NASA scientist James Hansen. He says that statistically what’s happening is not random or normal, but pure and simple climate change.
The Associated Press: New study links current events to climate change
No, it is pure and simple cherry-picking. Had he compared against the 1930s he would have seen that recent temperatures have been relatively quite cool.
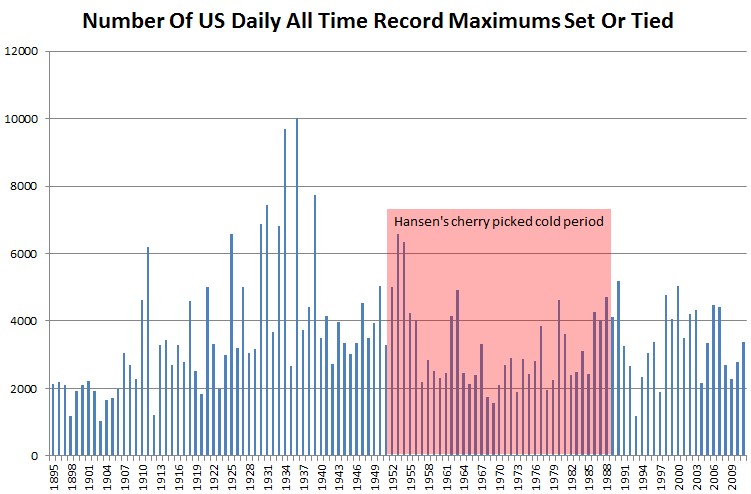
Data is for all USHCN stations which were operational during both the 1930s and the most recent decade.
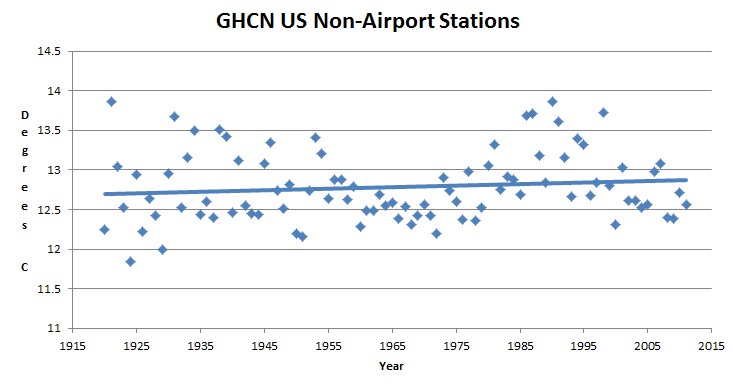
Something is seriously wrong with the GHCN US data. Two-thirds of the stations are at airports and they show regular divergences from the non-airport stations which can only be described as …. bizarre.
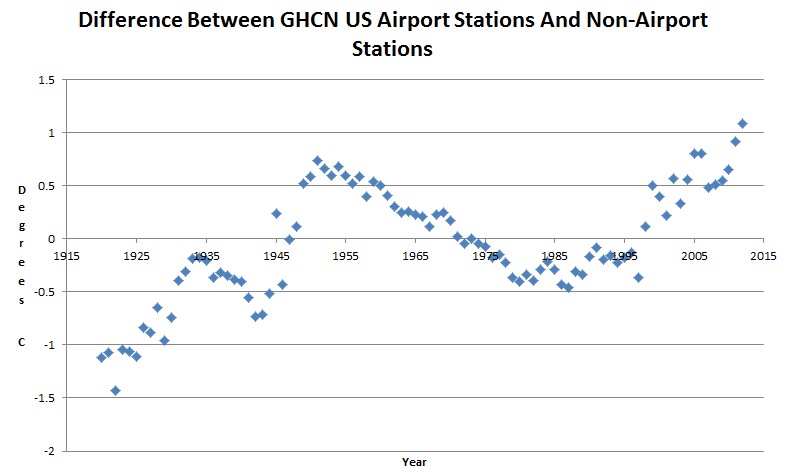
The non-airport stations show almost no trend over the last 80 years, with 1921 and 1990 tied for the hottest year, and a steep cooling trend over the last 20 years.