Pachauri Proves He Is Scientifically Incompetent Again

Railroad engineer Pachauri demonstrates once again that he understands nothing about science

“it’s possible that part of this huge body of ice (Greenland) could collapse, and fall into the ocean which would lead to several meters of sea level rise.

http://www.youtube.com/watch?v=HHCz-WlXcLk#t=0m49s

Mindless drivel. The Greenland ice sheet is a 3 km thick chunk of ice spread across a 1000 km wide island. You could visualize it as being a thick piece of paper. Can you imagine a piece of paper lying flat on a table, collapsing?

But it is worse than it seems. The land under the ice sheet is depressed due to the weight of the ice above it, and is bowl shaped. Furthermore, the island is full of mountain ranges buried under the ice – which prevent lateral movement.

Perhaps Pachauri  thinks that ice cream can spontaneously jump out of a bowl? What a maroon.
Posted in Uncategorized | 23 Comments

Visualizing The Magnitude Of The NCDC July 2012 Fraud

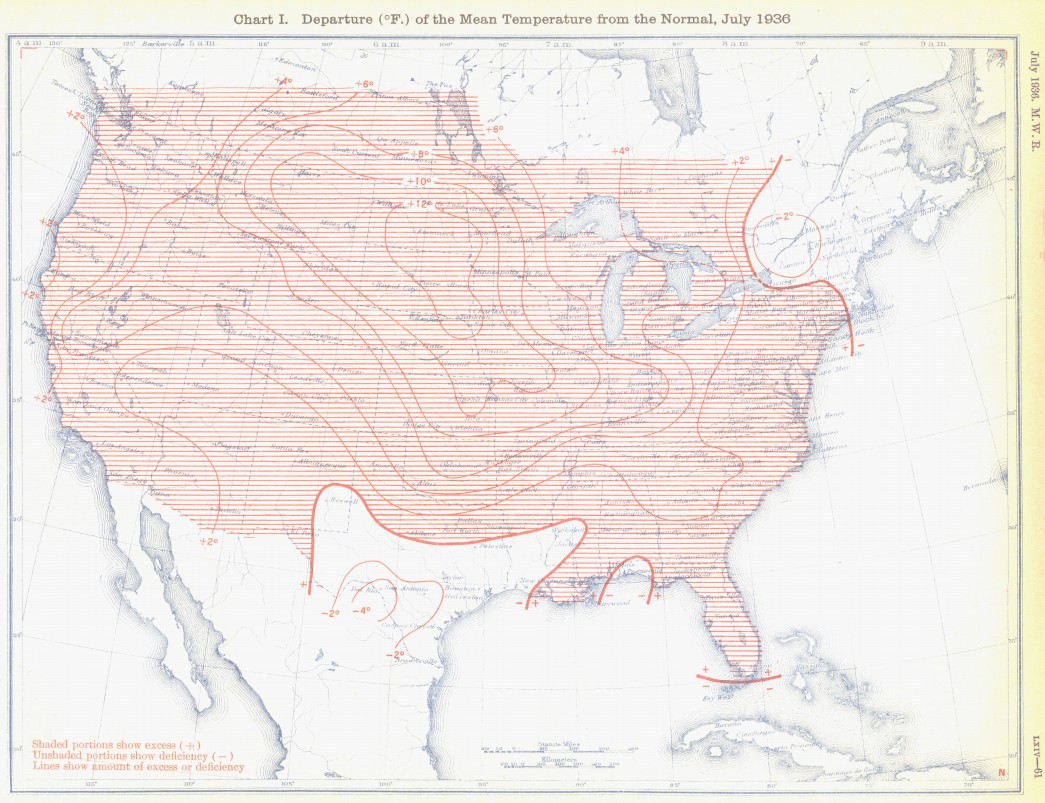
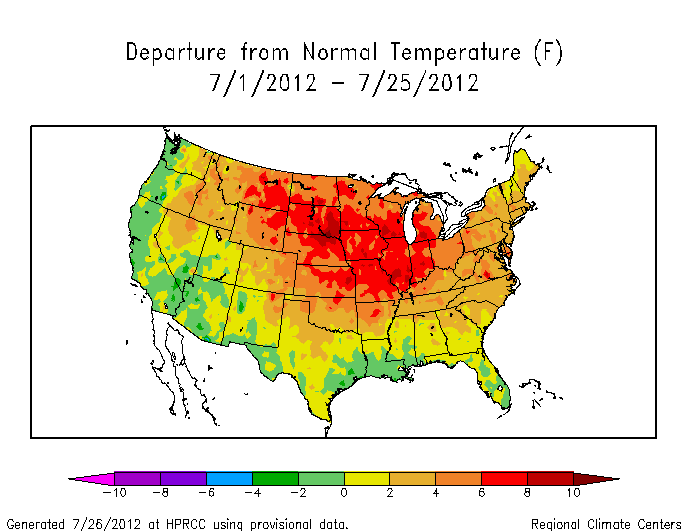
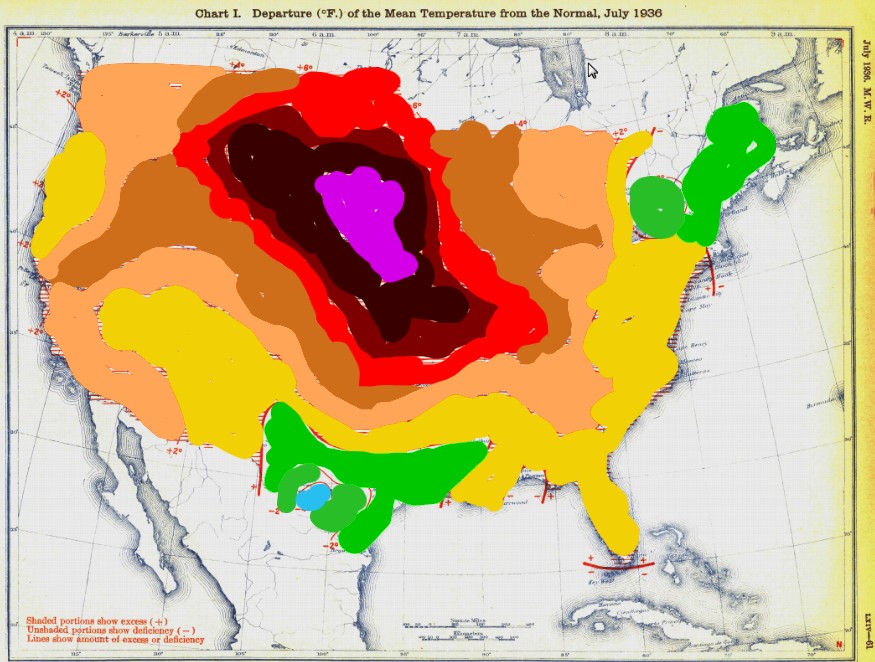
I painted in the July 1936 temperature anomaly map with the same color scale as the July 2012 map, with pink added for +12 anomaly. As you can see, July 1936 was much hotter than July 2012 over 70% of the US – but that isn’t going to stop NOAA from claiming that 2012 was the hottest.

docs.lib.noaa.gov/rescue/mwr/064/mwr-064-07-c1.pdf

MonthTDeptUS.png (688×531)

Posted in Uncategorized | 8 Comments

Jonathan Jones Gets The Full Stupid Award For The Morning

Greenland’s ice sheet melt: a sensational picture of a blunt fact

The NASA report which he is referring to, said that the non-event which just happened occurs every 153 years and was right on schedule.

What kind of moron would interpret a cyclical event which is right on schedule – as being due to climate change?

Posted in Uncategorized | 14 Comments

NCDC Setting Up the Big July Lie

With five days to go in July, preliminary data show that the heat could top records set decades ago: “The warmest July for the contiguous U.S. was in 1936, when the nationally averaged temperature was 77.43 degrees, 3.14 degrees above average,” said climate scientist Jake Crouch of the National Climatic Data Center.

The actual average temperature for July 1936, before they adjust it down – is 77.93 degrees. They knocked it down half a degree from the measured daily temperatures.

Preliminary data from the center show the national temperature for the first three weeks of July was 3.63 degrees above average. If the heat continues, and after the data are more closely analyzed, that would top July 1936.

How horrid? July on pace to be hottest month on record – USATODAY.com

Complete bullshit. July, 1936 was much hotter, but they now upwards adjust more than 1.5 degrees on to the monthly temperature relative to 1936.

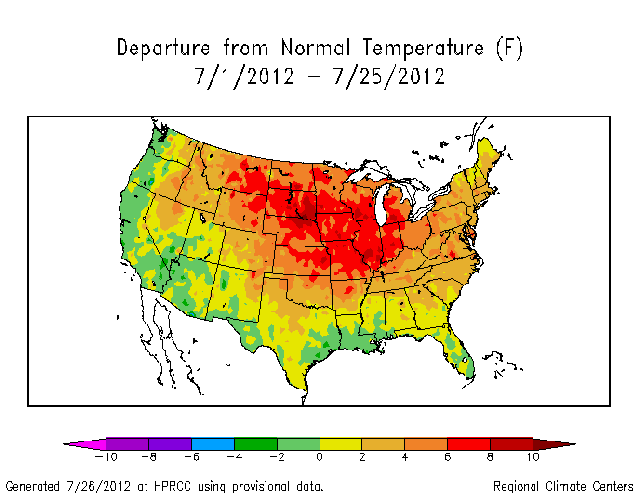
Compare the huge region of +10 and +12 degrees in 1936 to the tiny region of +8 in 2012. The area of +10 was probably two hundred times larger in 1936. There is no +12 in 2012. Every band +2 or above was much larger in 1936.

This July isn’t even close to 1936, but by tampering with the data they get the political result they are looking for. I doubt that July 2012 is even in the top five without their tampering.


docs.lib.noaa.gov/rescue/mwr/064/mwr-064-07-c1.pdf

MonthTDeptUS.png (688×531)

Just another huge climate scandal in the making.

Posted in Uncategorized | 18 Comments

Greenland Melt Now Impacting Gay Rights At Chick-fil-A

I just captured this screenshot from Google News

http://news.google.com/nwshp?tab=wn

Posted in Uncategorized | 7 Comments

Shakun Flashback

From April

The results show that while temperature increases around Antarctica appear to have led increases in atmospheric CO2, the picture globally was the opposite – CO2 increases paved the way for temperature increases.

Ice age study delivers blow to global-warming skeptics – CSMonitor.com

No this was not an April Fool’s Joke – just spectacular stupidity from climate science and the Christian Science Monitor.

Here is the sequence of events which Shakun laid out

  1. Temperatures rise or fall in Antarctica
  2. Hundreds of years later – CO2 rises or falls
  3. Hundreds of years later – temperatures rise or fall  globally

Let’s assume for a minute that this sequence is correct. The implication is that Antarctica controls the world’s temperature. Whatever Antarctica does, the rest of the world does several hundred years later. This is particularly scary, because the wind chill in Antarctica is -156F

How did climate scientists react to this brilliant work?

The new work is a significant advance” in the study of the climate conditions surrounding Earth’s cycle of ice ages, notes Richard Alley, a Penn State University geologist who specializes in studying glaciers and the climate records encoded in the ice.

Posted in Uncategorized | 4 Comments

If I Only Had A Brain …. The Joe Romm Story

Joe has declared war on Andy Revkin, and science. Joe is apparently also really pissed off at the author of the NASA Greenland melt  study – who said that this has happened every 150 years for the last 10,000 years.

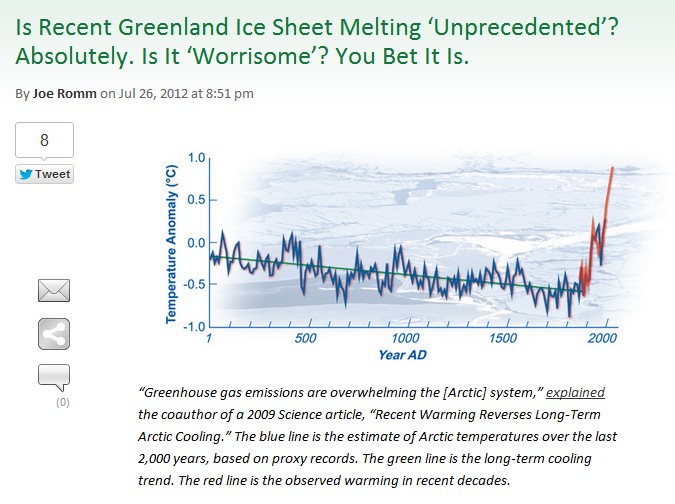
Suppose for a minute that Joe is right, and everyone else is wrong. Look at his graph below – had it not been for evil humans interfering in the climate system, we would be having an ice age.  Sometime around the war of 1812 humans started doing something really bad to warm the climate up – and saved us all from freezing to death.

What a maroon

Posted in Uncategorized | 2 Comments

My Letter To Jeremy Kaplan (Science Editor at Fox News)

I sent the E-mail below to Jeremy Kaplan at Fox News this afternoon. Jeremy responded right away, and told me that he was looking in to it.

—————————————————————

Hi Jeremy,

I saw that you quoted Jay Zwally in your article today.  Here is some background information about him which you might find useful

In 2007, Zwally forecast an ice-free Arctic in 2012 for National Geographic Magazine

Arctic Sea Ice Gone in Summer Within Five Years?

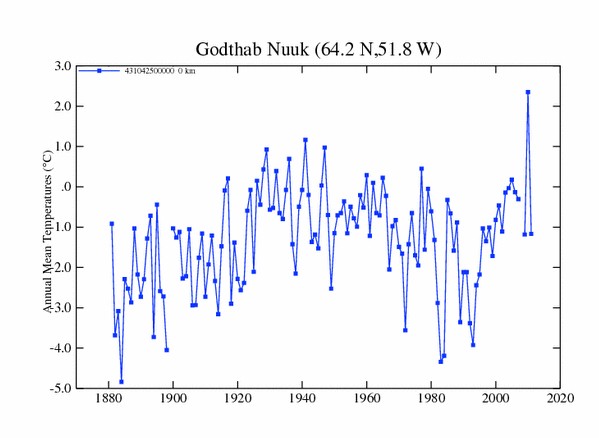
He also gave you some extremely misleading information. While it is true that Greenland temperatures rose 4C from 1990 to 2006, the long term trend since the 1920s is downwards, as well as the short term trend since 2006. He cherry picked the twenty year period very carefully, as twenty years ago was the coldest period in Greenland’s history. Had he picked almost any other start date, there would be no warming trend.

Data.GISS: GISS Surface Temperature Analysis

I consider what he told you to be highly misleading, and hope that you will follow up with this.

Best regards,

Steven

Posted in Uncategorized | 5 Comments

This Is What Global Warming Looks Like

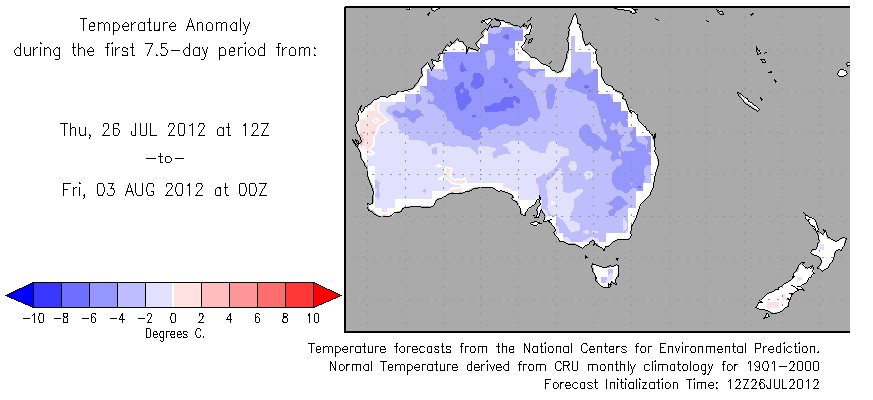
Australia is of course not as big as Washington DC, and definitely not part of the globe.

10-Day Temperature Outlook

Posted in Uncategorized | 11 Comments

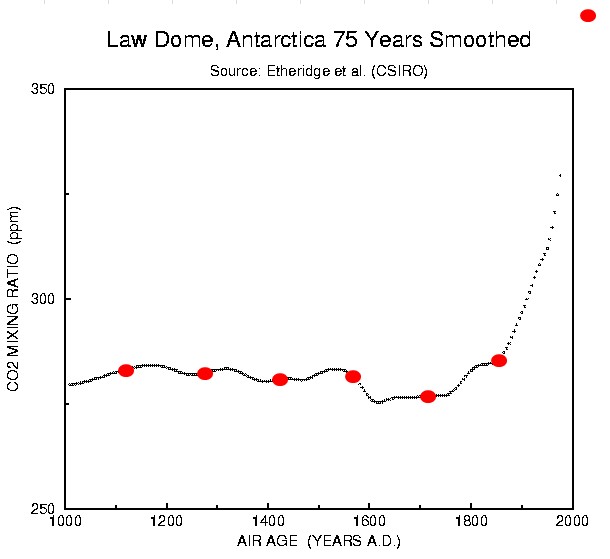
99% Of Greenland Melt Events Happened With CO2 Below 350 PPM

According to NASA, Greenland melt events happen every 153 years, which means they have no correlation to  CO2. It also means that alarmists trying to blame the event on CO2 are being as stupid as they always are.


lawdome.smooth75.gif (792×612)

Posted in Uncategorized | 1 Comment