Rahmstorf Picking Rotten Cherries

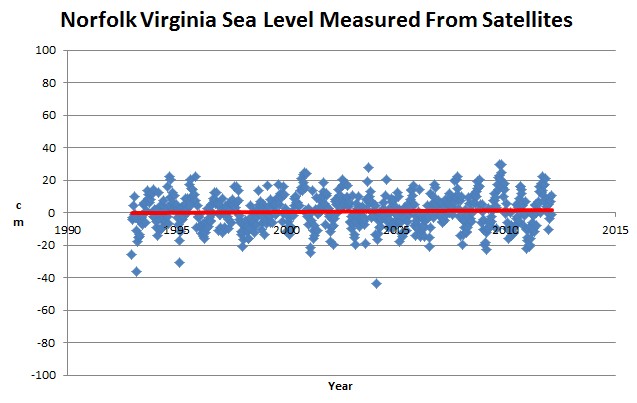
Rahmstorf is a real piece of work. When it comes to global sea level, he happily chucked the tide gauge data and instead used the 1992-2005 subset of the satellite data. But when it comes to local sea level data like the northeastern US, he happily ignores the satellite data and sticks religiously to tide gauge data.

But it is worse than it seems. When calculating future sea level rise, he ignores both the tide gauge data and the satellite data, and instead just makes numbers up. Never mind that none of the data sources show a positive acceleration in sea level rise rates. He knows that all hell is about to break loose.

Posted in Uncategorized | 2 Comments

The Atlantic Hot Spot Of Stupidity

Rahmstorf continues displaying his ignorance today on RealBadClimateBS

Nature Climate Change publishes two new sea-level papers today. One, by Sallenger et al., is an analysis of US tide gauge data. The main finding is that there is a “hotspot” of acceleration in sea level rise over the past sixty years on the US Atlantic coast, with the largest acceleration found between Cape Hatteras and Boston. The authors argue that this pattern is consistent with a weakening of the Atlantic overturning circulation (and hence their first reference is to our 2005 paper where we show this sea-level pattern in our model). In my opinion an intriguing possibility that warrants further investigation. There could be other causes, like interdecadal changes in the wind field.

RealClimate: Far out in North Carolina

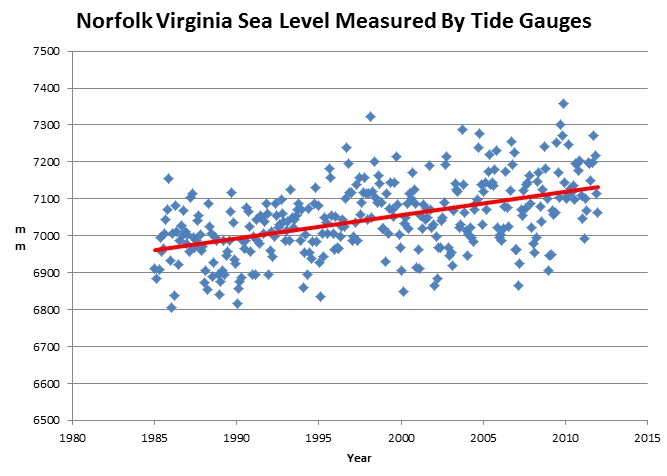
Tide gauges show significant sea level rise in that region ….

but satellites don’t ….

Satellites measure the absolute elevation of the sea surface, whereas tide gauges measure the height of the sea relative to the land. If tide gauges show a large increase in sea level, but satellites don’t – the only rational explanation is that the land is sinking.

This is very basic science, and the failure of the experts to realize this is yet another indication that these people are incompetent.

Posted in Uncategorized | 10 Comments

More On The Oklahoma Big Lie Of 2011

I did some more math to check the claims that last July in Oklahoma was the hottest month in US history. The BS is worse than it seems.

Meeker Oklahoma USHCN Temperatures
Month    Year   Average Max   Mean   Average Min
August   1913         106.4   89.5          72.2
August   1936         105.8   90.1          73.7
July     2011         101.9   89.0          75.6

Meeker is the closest USHCN station to Oklahoma City. Daytime temperatures were much higher in both 1913 and 1936, mean temperatures were higher in both 1913 and 1936, and UHI made nighttime temperatures warmer in 2011.

But it gets worse. August 1913 had five consecutive days over 110 and a total of 22 days over 110. August 1936 had six consecutive days over 110. July, 2011 had zero days over 110 degrees.  1913 and 1936 were both much hotter than 2011.

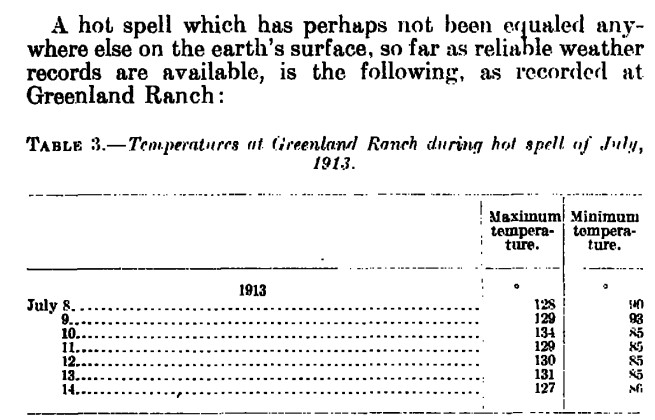
1913 was also the year that California set the hottest temperature ever measured this side of the Atlantic – 134F.

docs.lib.noaa.gov/rescue/mwr/050/mwr-050-01-0010.pdf

According to Hansen, every year since 2000 has been hotter in the US than 1913, and 2011 style heatwaves were impossible below 350 PPM. He is completely incompetent.

Posted in Uncategorized | Leave a comment

In 1748 : Every Mountain Range Burned

Interesting story in the NYT explaining how fire suppression has caused big forest fires.

Using data from tree ring studies, scientists have reconstructed a history of fires in the Southwest. The wildfires of the past were frequent and massive, but they stayed close to the ground and mainly helped prevent overcrowding. Take 1748. “Every mountain range we studied in the region was burning that year,” Dr. Allen said. “But those were surface fires, not destroying the forest but just keeping an open setting.” Cyclical wildfires were the norm.

But beginning in 1900, when railroads enabled the spread of livestock, cattle devoured the grassy surface fuels and the fire cycle stopped. A decade later, a national policy of forest fire suppression formalized this new normal. Over the next century, forest density went from 80 trees per acre to more than 1,000.

Then in 1996, the climate emerged from a wet cycle into a dry one — part of a natural cycle for this region. Winters became drier. And “we immediately began seeing major fires,” Dr. Allen said.

With so many trees crammed into the forest, fires climbed straight to the canopy instead of remaining on the ground.

“These forests did not evolve with this type of fire,” said Dr. Allen. “Fire was a big deal in New Mexico, but it was a different kind of fire.” The result, he said, is that the species that now live there — ponderosa pines, piñon, juniper — cannot regenerate, and new species are moving in to take their place.

“Ecosystems are already resetting themselves in ways big and small,” Dr. Allen said. The challenge for managing these ecosystems, he said, is to try to help them adapt.

Seeking to preserve existing systems is futile, he said.

Goodbye to Mountain Forests? – NYTimes.com

In other words, environmentalists wrecked the forests by insisting that all forest fires be put out, and then blamed the consequences  of their stupidity on global warming.

Posted in Uncategorized | 6 Comments

Shock News : Man Made CO2 May Delay The Next Ice Age

Do these geniuses ever stop and think about what they are complaining about?

Ice Age Research
JANUARY 10, 2012

High levels of carbon dioxide emissions in the atmosphere mean the next ice age is unlikely to begin for at least 1,500 years, according to a recently published article in the journal Nature Geoscience.

Officially, the earth has been in an interglacial, or warmer period, for the last 10,000 to 15,000 years, and estimates vary on how long such periods last.

“(Analysis) suggests that the end of the current interglacial (period) would occur within the next 1,500 years, if atmospheric CO2 concentrations do not exceed (around) 240 parts per million by volume (ppmv),” the study said.

However, the current carbon dioxide concentration is of 390 ppmv, and at that level an increase in the volume of ice sheets would not be possible, it added.

Ice Age Research | Catlin Arctic Survey

Posted in Uncategorized | 14 Comments

Greenland Farming Update

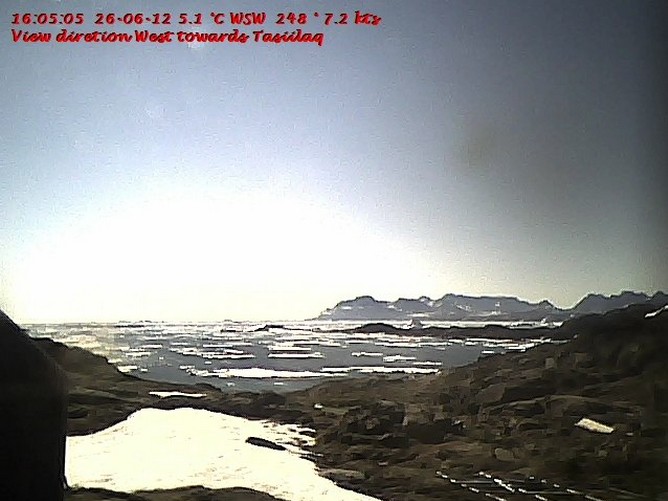
With only eight weeks left until harvest, the corn crop along the coast is going crazy  in the 5 degree heat.

Weather Webcams | Weather Underground

Posted in Uncategorized | 5 Comments

Monbiot : Stuck On Bambi

Some people will respond by giving up, or at least withdrawing from political action. Why, they will ask, should we bother, if the inevitable destination is the loss of so much of what we hold dear: the forests, the brooks, the wetlands, the coral reefs, the sea ice, the glaciers, the birdsong and the night chorus, the soft and steady climate which has treated us kindly for so long?

After Rio, we know. Governments have given up on the planet | George Monbiot | Comment is free | The Guardian

Soft and steady climate? Perhaps he is thinking of the LIA which brought the Black Death and killed 80% of Europe? Perhaps he is thinking of the Irish Potato Famine which killed 25% of the population of Ireland? Maybe the Bristol Flood of 1607, or the England Drought of 1976?

Or perhaps this is what he is thinking of?

  1. DROUGHT IN ENGLAND.
    Launceston Examiner (Tas. : 1842 – 1899) Friday 1 July 1887 p 2 Article
    … DROUGHT IN ENGLAND. The agricultural prospects in several’ English counties are being seriously affected by the prolongeddrought. … 18 words
    Continue reading →
Posted in Uncategorized | 25 Comments

Phil Jones Coldest Month Ever – Based On Nothing

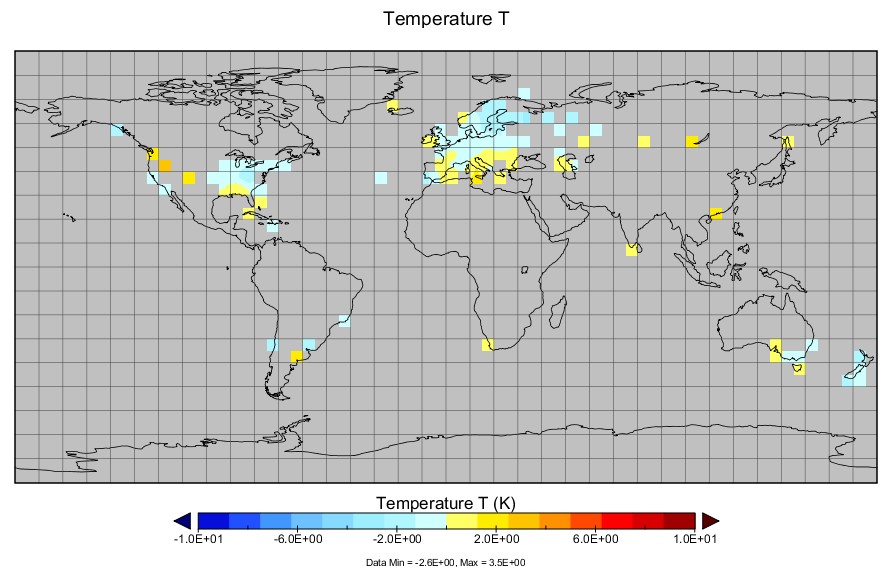
Phil Jones lists August, 1865 as the coldest month ever in the Southern Hemisphere.

The map below shows all of the land data he had that month. Jones had less than two dozen land based thermometers in the Southern Hemisphere and many of those were above normal. yet was able to report record cold with a precision of 0.001 degrees,

Posted in Uncategorized | 5 Comments

Sea Level Quiz

If the Arctic Ocean warmed up 2 degrees, would sea level rise or fall?

Posted in Uncategorized | 8 Comments

The Oklahoma Big Lie Of 2011

Oklahoma July Hottest Month Ever Recorded in U.S.

Last week, we gloated that, although Tulsa and OKC made the cut as two of the five hottest cities in the U.S., Lubbock, TX had the dubious honor of being awarded Very Most Hellish City of 2011 by The Daily Beast. “At least we don’t live in Texas,” we poked.

We will now eat our words, because the Oklahoma Climatological Survey has just announced that July, 2011 in Oklahoma was the hottest month ever recorded in the contiguous United States.

Oklahoma July Hottest Month Ever Recorded in U.S. | This Land Press

Last year’s climate disinformation campaign was largely centered around Oklahoma and Texas, and claims that July in Oklahoma was the hottest month ever in the US. Actually, it wasn’t even close.

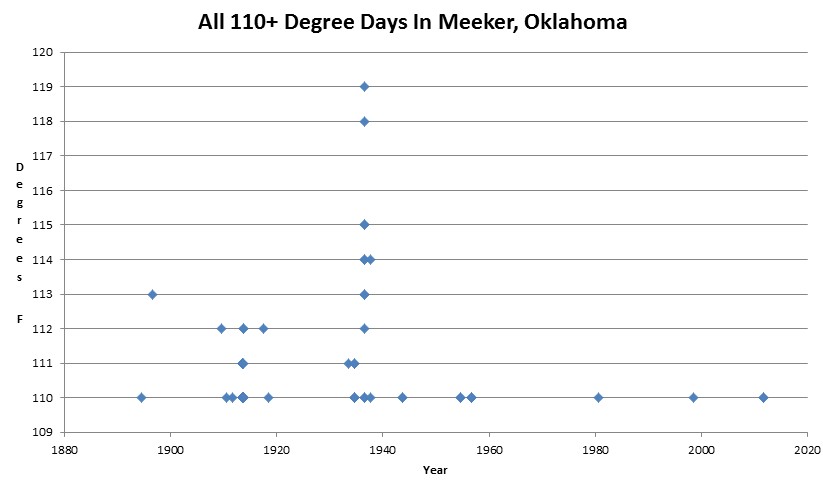
Meeker, Oklahoma is the closest USHCN station to Oklahoma City. They recorded no days in July, 2011 over 110 degrees, and only two days in August.

The hottest month was August, 1913 – when  there were twenty-two days over 110F – compared to zero days in July, 2011.

The year 1936 also had ten days over 110F, including the all-time record high of 119F and four days over 115F. There have been a total of fifty-nine days over 110F in Meeker, Oklahoma, and all but three occurred below 350 PPM. The vast majority occurred before 1940.
U.S. Historical Climatology Network

Claims that last summer was the hottest ever, and that it was caused by CO2, are garbage. If Oklahoma had a month like August, 1913 with twenty-two days over 110F, Joe Romm would demand immediate world communism.

Posted in Uncategorized | 1 Comment