
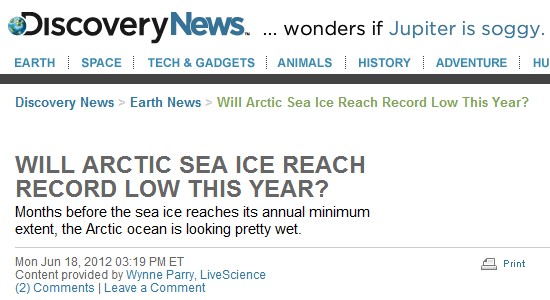
Will Arctic Sea Ice Reach Record Low This Year? : Discovery News
What are these geniuses talking about? A week after the article was written, the Arctic Basin is still almost entirely frozen over.
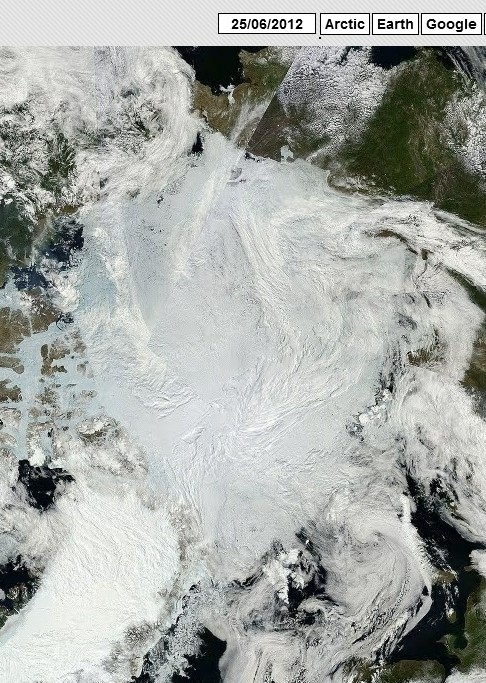
Will Arctic Sea Ice Reach Record Low This Year? : Discovery News
What are these geniuses talking about? A week after the article was written, the Arctic Basin is still almost entirely frozen over.
There are two ice sheets on Earth – Greenland and Antarctica. Both are located at high latitudes and and high altitudes. Temperatures are too cold over the vast majority of the ice sheets to ever melt.
Alarmists have made a big stink about melting along the lower fringes of the western edge of the Greenland ice sheet. If you have ever flown over Western Greenland in late summer (I have several times) you can see that the ice there is almost pitch black. It is covered with soot or dirt and as a result melts for a few weeks every summer.
At the end of the last ice age, the Earth slowly warmed by 4–7 °C globally14 and lost almost two-thirds of its land ice in the process. That raised sea level by 120 metres, at rates often exceeding a metre per century1. It seems that nothing in the present ice-sheet configuration would rule out similar rates in future. How much of the remaining 65 metres’ worth of land ice will humans melt if we warm the planet by a further several degrees?
A new view on sea level rise : article : Nature Reports Climate Change
At the end of the last ice age, the ice sheet extended as far south as 40N (New York and Chicago). By contrast, the southern tip of Greenland is at 60N. Temperatures in the center of the Greenland ice sheet have not gotten above freezing at any time this year.
Besides the fact that the remaining ice is located much further north, most is at much higher elevation and the surface area is much smaller than it was 15,000 years ago. Melt rates producing sea level rise of one metre per century are completely implausible.
Rahmstorf has absolutely no idea what he is talking about.
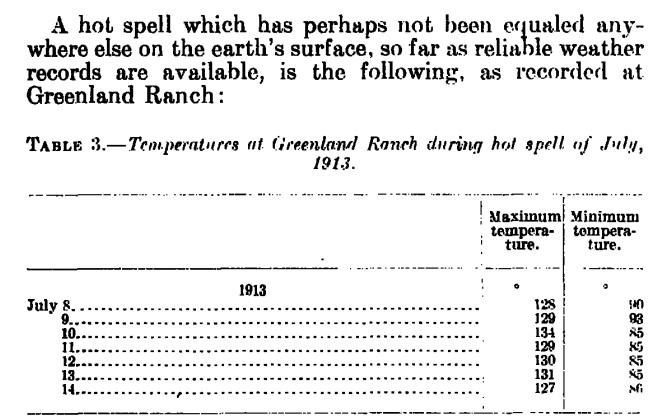
docs.lib.noaa.gov/rescue/mwr/050/mwr-050-01-0010.pdf
Hansen says that extreme heat waves like this can only be caused by man-made CO2.
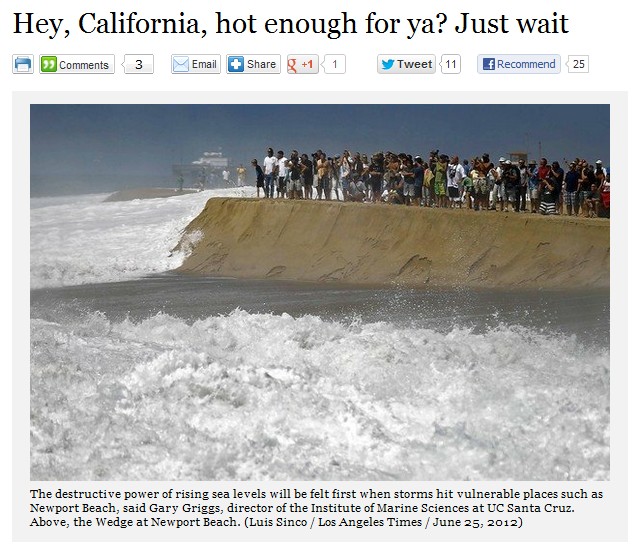
Hey, California, hot enough for ya? Just wait
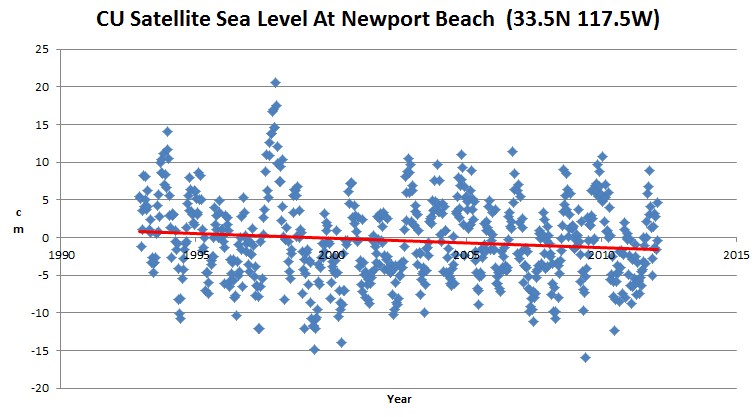
California hit 134 degrees in 1913, and sea level has been declining at Newport Beach for as long as the satellite records have been made. As usual, the author has all of his facts wrong.
The report says that sea-level rise from Cape Hatteras, North Carolina to Boston, Massachusetts (a 600-mile expanse of coastal zone called the “hotspot” by scientists) has grown 2-3.7 millimeters per year since 1990. For comparison, scientists say that the global growth rate over the same time frame was 0.6 -1.0 millimeter per year.
The report warns that if global temperatures continue to increase, rates of sea level rise along the East Coast are likely to continue growing. Scientists say this prediction is based on data and analyses that are detailed in the report.
Good thinking. Anomalous local effects are caused by global warming.
Scientists say that global sea level will not increase at the same rate at every location, even though calculations show that it is likely to rise approximately two-to-three feet or more by the end of the 21st century. Sea level rise can vary both regionally and locally due to deviations in land movements, strength of ocean currents, water temperatures and other factors.
Study: Global warming could destroy the East Coast | The Bunsen Burner
Eighty eight years left in the century, and a global growth rate of 0.6 to 1.0 mm per year. According to the government, that works out to two or three feet (600 to 900 mm.)
Any paper which includes the words “Since the beginning of satellite measurements” is a red flag that someone is about to start lying to you.
A new view on sea level rise Stefan Rahmstorf
Over the course of the twentieth century, the rate of sea level rise has roughly tripled in response to 0.8 °C global warming. Since the beginning of satellite measurements, sea level has risen about 80 per cent faster, at 3.4 millimetres per year, than the average IPCC model projection of 1.9 millimetres per year.
A new view on sea level rise : article : Nature Reports Climate Change
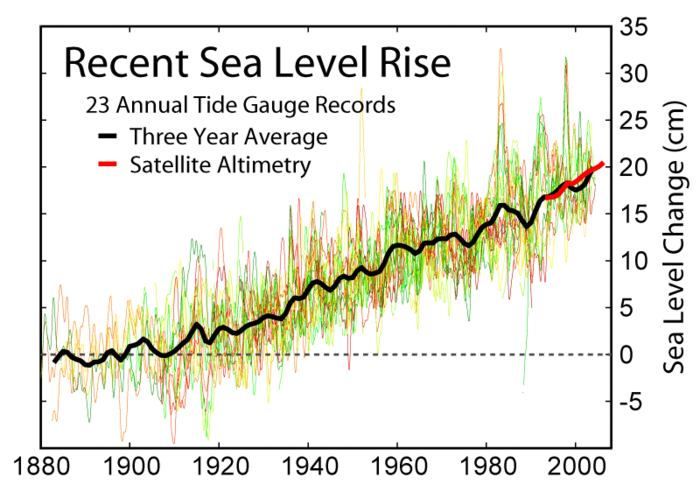
Utter tripe. Tide gauges show a steady 1.8 mm/year over the last 100 years. There has been no acceleration.
From 1991
GLOBAL SEA-LEVEL RISE Author(s): DOUGLAS, BC (DOUGLAS, BC) Source: JOURNAL OF GEOPHYSICAL RESEARCH-OCEANS Volume: 96 Issue: C4 Pages: 6981-6992 DOI: 10.1029/91JC00064 Published: APR 15 1991
The value for mean sea level rise obtained from a global set of 21 such stations in nine oceanic regions with an average record length of 76 years during the period 1880-1980 is 1.8 mm/yr +/- 0.1. This result provides confidence that carefully selected long tide gauge records measure the same underlying trend of sea level and that many old tide gauge records are of very high quality.
From 2012
Source found for missing water in sea-level rise Human use of water contributes markedly to rising tides. Amanda Mascarelli 20 May 2012
During the latter half of the twentieth century, global sea level rose by about 1.8 millimetres per year, according to data from tide gauges. The combined contribution from heating of the oceans, which makes the water expand, along with melting of ice caps and glaciers, is estimated to be 1.1 millimetres per year, which leaves some 0.7 millimetres per year unaccounted for.
Source found for missing water in sea-level rise : Nature News & Comment
What changed is that Rahmstorf was disappointed that tide gauges blew away his theory, so he switched to an uncalibrated measurement system – i.e. satellites. Call it Stefan’s Nature trick.
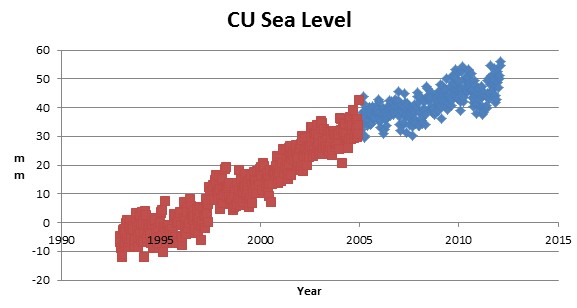
But it sucks to be Stefan, because even the satellites have turned against his nonsense. Since 2005, satellites are also reporting 1.8 mm/year.
Here is where Rahmstorf goes full stupid
Whether the response of continental ice to warming is well represented by empirical models is harder to judge, though the linear dependence on temperature is similar to that also used in glacier modelling studies and by the IPCC. The semi-empirical approach, however, was recently criticized in the popular media9 on the grounds that it is, to a large extent, calibrated to the past glacier contribution, and that glaciers would be “largely gone by 2050”. Apart from this being just not so, the melting of all glaciers would add 60 centimetres to global sea level10, a lot more than in the worst-case scenario projected by semi-empirical models for 2050. And that contribution would be in addition to seawater expansion and melting of continental ice sheets.
If two-thirds of glacier ice were lost, this would add 40 centimetres to the global sea level, which is close to the lower bound of 37 centimetres recently estimated by glacier experts12. In that case, the percentage contribution of glacier melting to sea level rise would remain the same as in past decades13. The big ice sheets would then need to contribute only about 50 centimetres — corresponding to less than one per cent of their mass — to bring sea level rise up to 114 centimetres. None of this appears any less plausible than the IPCC’s assumptions.
Glaciers gone by 2050? 600 mm of sea level rise by 2050? 1140 mm of sea level rise? Rahmstorf has absolutely no idea what he is talking about.
Experts tell us that the hot weather in Colorado proves global warming. These same experts completely ignored us during the previous two Junes when we were experiencing flooding and record snowpack.
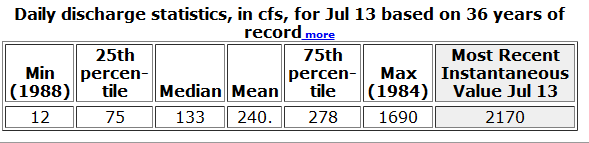
July 13, 2011 broke the record for most snow melt runoff in the Poudre River that late in the summer.
January 12, 1888 started out as a very mild day on the Great Plains. During the afternoon, an incredible blizzard moved into the region without warning. Hundreds of children froze to death walking home from school that day. It became known as the Schoolhouse Blizzard.
Schoolhouse Blizzard – Wikipedia, the free encyclopedia
Two months later, the Great Blizzard of 1888 struck the Northeast – dropping 40-50 inches of snow on New York. It was the biggest snowstorm in history in that region, and became the motivation for building the subway system in New York.
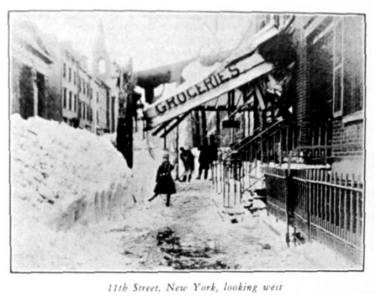
Some days our clueless friends tell us that big snowstorms are due to global warming, and on other days they say that snow is a thing of the past.
But that’s not all. On July 11, 1888 – Colorado set its all time high temperature record at 118F. www.ncdc.noaa.gov/oa/pub/data/special/maxtemps.pdf
This was seven years after Europe set their all-time temperature record of 122F in 1881. World Temperature Extremes
Experts tell us that record heat can’t happen without man made CO2, because they have their heads firmly planted where the sun never shines.
Colorado’s 114°: hottest temperature in state history
The remarkable heat wave that affected Colorado on Saturday and Sunday has tied the all-time heat record for the state. According to wunderground’s weather historian Christopher C. Burt, Saturday’s 114° reading in Las Animas tied for the hottest temperature ever measured in the state of Colorado. Two other 114° readings have occurred in Colorado history: in Las Animas on July 1, 1933, and in Sedgwick on July 11, 1954.
What Jeff was trying to say, is that he thinks Colorado is just as hot as it was 80 years ago. He got a bit confused when he wrote the headline.
But it is worse than it seems. NOAA says it was 118 F on July 11, 1888 in Bennett, Colorado.
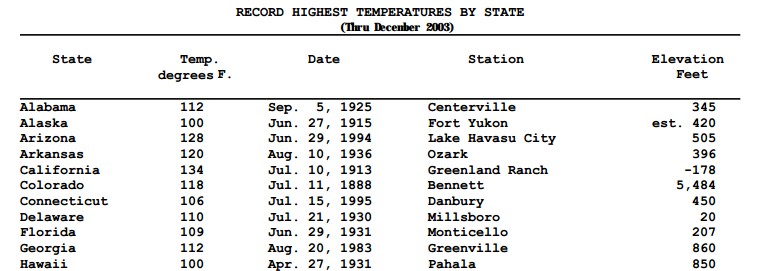
www.ncdc.noaa.gov/oa/pub/data/special/maxtemps.pdf
He also wrote :
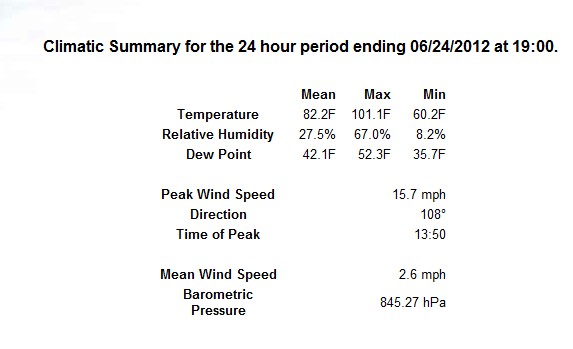
In Fort Collins, the mercury hit 102° on Sunday, just 1° below the city’s all-time hottest temperature of 103° set on Jul 21, 2005. The heat did no favors for firefighters struggling to the contain the massive 81,000 acre High Park fire fifteen miles northwest of Fort Collins. The fire is the second largest and most destructive wildfire in Colorado’s history, and is 45% contained.
Once again, Jeff is spreading BS. The official high temperature in Fort Collins on Sunday was 101F, and according to USHCN it was 102F on three days in 1954 and one day in 1925.
I wonder why he forgot to tell the truth?
As far as the fire goes, it is perhaps 1% the size of the 1898 fire.
