The Methane Big Lie

The world has enough natural gas to power it for many centuries. The idea of clean, abundant natural gas is terrifying to people who have invested heavily in nearly worthless technologies like solar and wind powered electricity. This has led to idiotic claims that methane is 20X worse than CO2 and will cause mankind to go extinct.

The truth is that methane has almost no effect on Earth’s radiative balance. It has only a couple of narrow absorption bands, both of which overlap with much more abundant H2O. The atmospheric mole fraction of CH4 is less than 0.000002
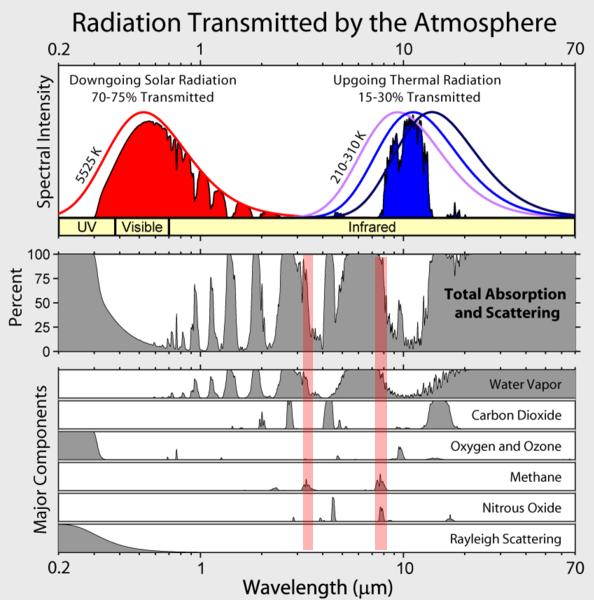
File:Atmospheric Transmission.png – Global Warming Art

Posted in Uncategorized | 5 Comments

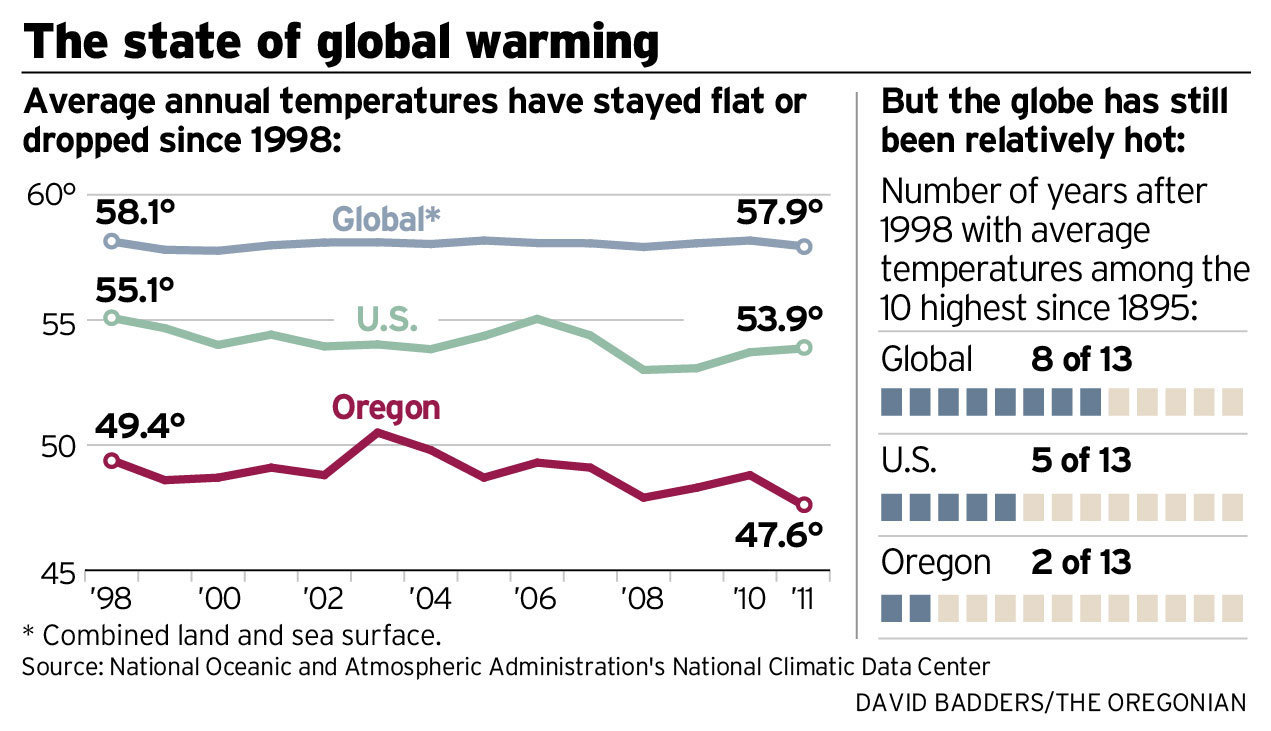
Oregonian Observes Out Of Control Global Warming

Global warming ‘hiatus’ in recent years helps spur skepticism | OregonLive.com

h/t to GORE LIED

Posted in Uncategorized | 5 Comments

Man Made Global Warming In Alaska

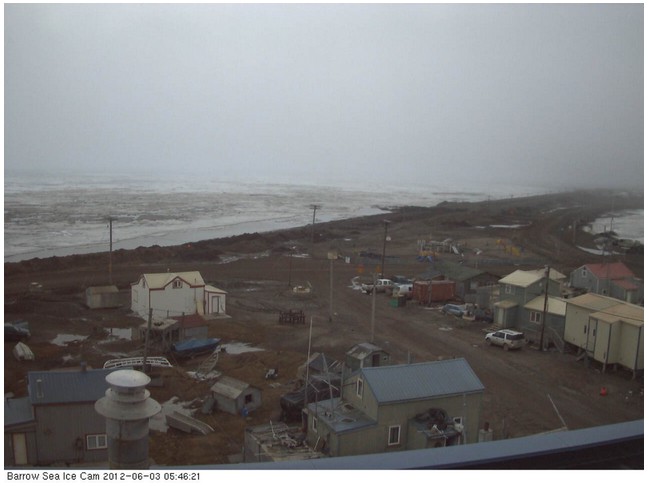
The ice offshore at Barrow is covered with dirt which has blown off the roads. This causes the ice to melt much faster.

Barrow Sea Ice Webcam

UHI has caused more than 2C winter warming in Barrow.

THE URBAN HEAT ISLAND IN WINTER AT BARROW, ALASKA

During winter (December 2001–March 2002), the urban area averaged 2.2 °C warmer than the hinterland. The strength of the UHI increased as the wind velocity decreased, reaching an average value of 3.2 °C under calm (<2 m s?1 ) conditions and maximum single-day magnitude of 6 °C. UHI magnitude generally increased with decreasing air temperature in winter, re?ecting the input of anthropogenic heat to maintain interior building temperatures. On a daily basis, the UHI reached its peak intensity in the late evening and early morning. There was a strong positive relation between monthly UHI magnitude and natural gas production/use. Integrated over the period September–May, there was a 9% reduction in accumulated freezing degree days in the urban area. The evidence suggests that urbanization has contributed to early snowmelt in the village.

www.cas.umt.edu/geography/documents/Hinkel_etal_2003_winter_UHI.pdf

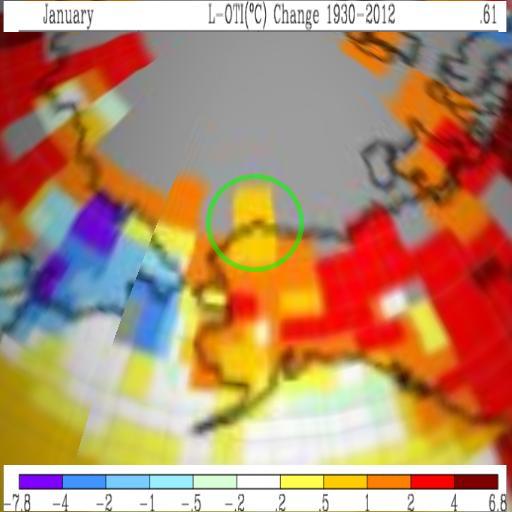
Hansen tells us that January temperatures in Barrow have warmed half a degree since 1930, which means that an honest reporting would be about 1.5C cooling in Alaska over the last 80 years.

Data.GISS: GISS Surface Temperature Analysis

Posted in Uncategorized | Leave a comment

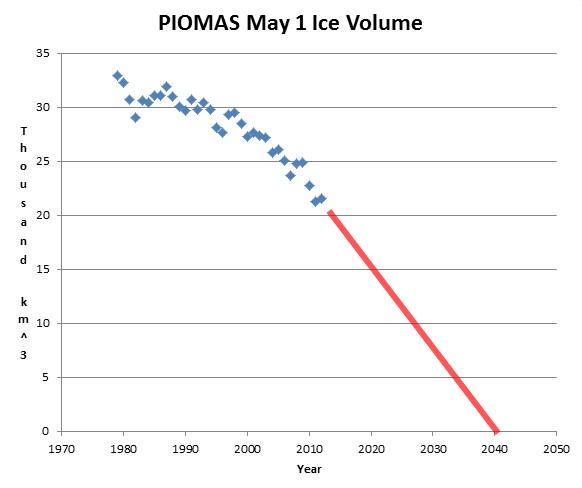
PIOMAS – Ice Free May By 2040

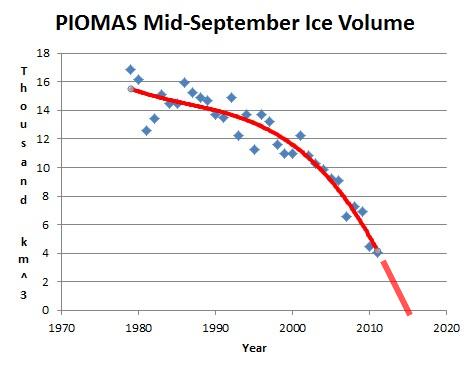
Even more impressive is that their data shows an ice-free September by 2015

Your tax dollars at work in an American university.


Posted in Uncategorized | 6 Comments

Life In The USSR

Obama’s literary agent (who promoted his biography and made him very rich) told everyone from 1991 to April 2007 that Obama was born in Kenya.

The press chose to ignore this story until Don Trump got involved, and has now determined that the past actions of Obama’s agent are the result of modern conspiracy theorists.

Apparently no one in the press has thought to ask Goderich where she got the information from, and why Obama never corrected it over 16 years. This is the same press corps(e) who hunted down Zimmerman for weeks, manufactured fake transcripts of his 911 call, and reported that he had no wounds on his head.

I used to read about the incredible lies coming from Pravda, but they had nothing on the modern United States Socialist Republic.

Posted in Uncategorized | 7 Comments

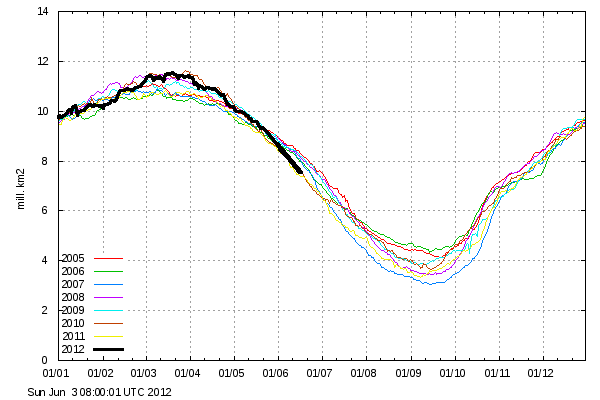
DMI’s New Death Spiral Feature

DMI got about a week behind, but is now compensating by showing what ice extent will be two weeks in the future. They have determined (using the latest data from ouijasat) that at mid-month, extent will be the lowest on record.

COI | Centre for Ocean and Ice | Danmarks Meteorologiske Institut

h/t to Scott

Posted in Uncategorized | 6 Comments

Defiling The Past At NOAA

The new normal in climate science is to distort climate records from the 1930s.

After recalculating data from last year, the nation’s climatologists are declaring that Oklahoma suffered through the hottest summer ever recorded in the U.S. last year — not Texas as initially announced last fall.

“It doesn’t make me feel any better,” joked Texas rancher Debbie Davis, who lives northwest ofSan Antonio.

In the new tally by the National Climatic Data Center, Oklahoma’s average temperature last summer was 86.9 degrees, while Texas finished with 86.7 degrees. The previous record for the hottest summer was 85.2 degrees set in 1934 — in Oklahoma.

Oklahoma had hottest summer on record

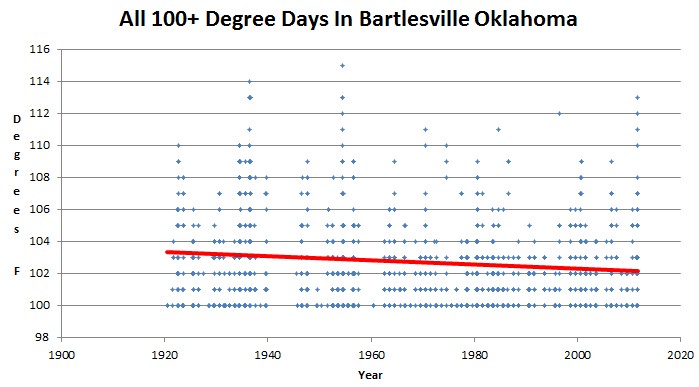
NCDC’s data shows that the Oklahoma City summer of 1934 had 61 days over 100 degrees, compared to only 38 days in 2011.

The graph below shows all 100+ degree days ever recorded at Oklahoma City, which have been on the decline. Nine of Oklahoma City’s ten hottest days occurred before 1960.

U.S. Historical Climatology Network

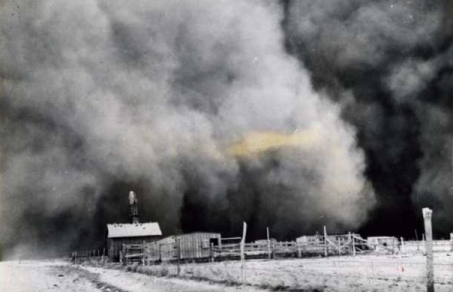
Even more disgusting is their failure to discuss the drought of 1934, which was by far the worst in US history. Much of the population abandoned Oklahoma during the 1930s, because the heat and drought made it unlivable. The Dust Bowl was an important part of Oklahoma history, as chronicled by Steinbeck in “The Grapes Of Wrath.” NASA and NOAA appear determined to erase the Dust Bowl from our memory.

Continue reading →

Posted in Uncategorized | 1 Comment

Polar Ice Passes Its Physical – With Flying Colors

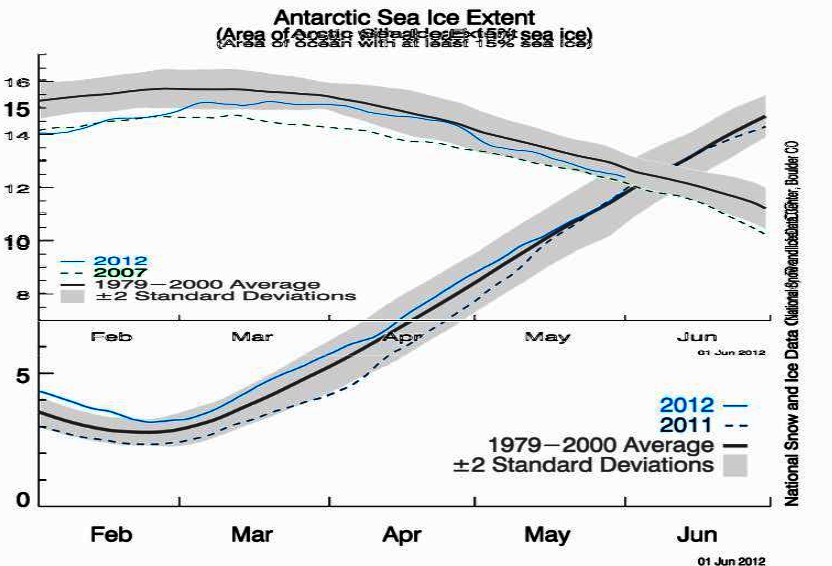
The graph below overlays NSIDC Arctic and Antarctic ice at the same scale. What becomes immediately obvious is that the Earth’s polar ice caps are stable.

During February, Antarctic ice was slightly above two standard deviations, and Arctic ice was slightly below two standard deviations. Since then, both poles have remained very close to the 1979-2000 mean.

Polar experts have tried to blame the growth in Antarctic ice on man-made ozone, but the record shows very clearly that Arctic and Antarctic anomaly trends move opposite each other. Why are climate experts so averse to actually doing science?

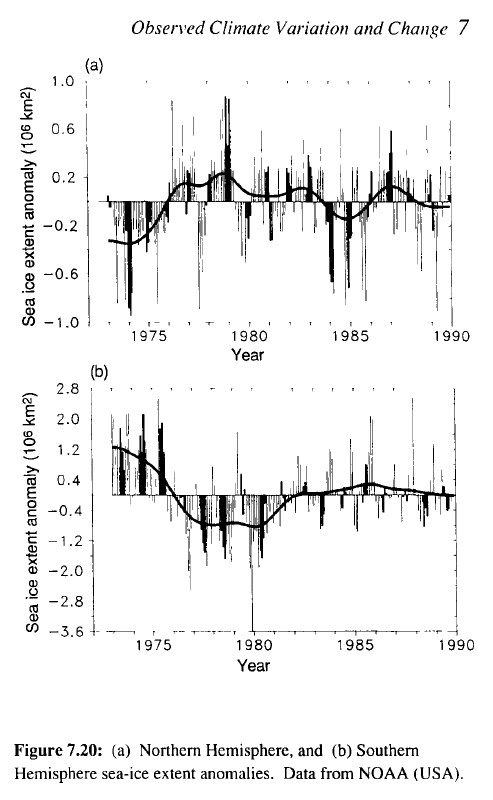
From the first IPCC report – the graphs NSIDC doesn’t want you to see or think about. Prior to 1979, Arctic ice was increasing and Antarctic ice was decreasing.

Posted in Uncategorized | 1 Comment

US Following Argentina’s Lead

Check out this typical government doublespeak below.

Argentina Minister Sees Fewer Gas Cuts To Industry This Winter

For years, Argentina has rationed gas to industrial companies in the Southern Hemisphere’s cold winter months to ensure residential users have enough to heat their homes.

But this year, the first gas cuts came during a cold snap in late April and early May instead of in June and July as is often the case.

Argentina Minister Sees Fewer Gas Cuts To Industry This Winter 

The US placed an idiot in the White House who is working to produce future energy shortages here. Who needs jobs or heat, anyway?

Posted in Uncategorized | 3 Comments

Lukewarm This …..

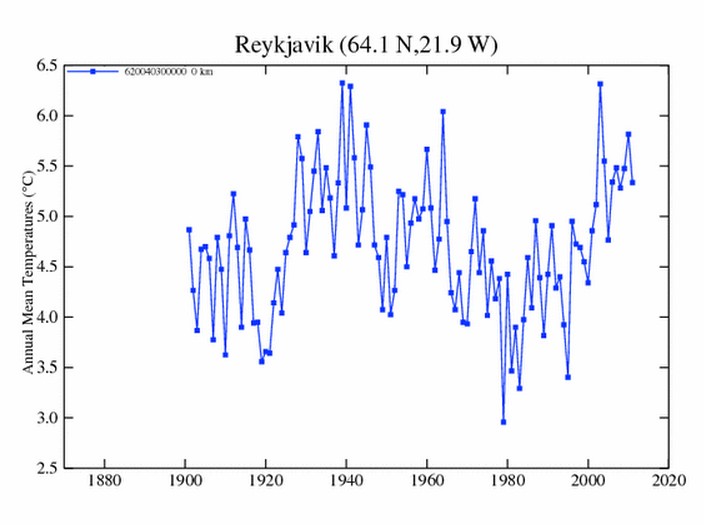
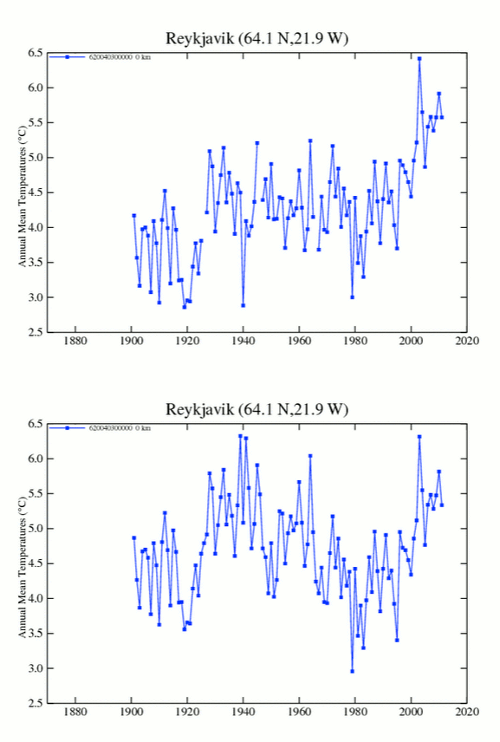
Hansen decided a few months ago that the people of Iceland were too stupid to read thermometers, and took it upon himself to go back in time and produce the correct temperatures there. That inconvenient warmest decade of the 1930s had to be eliminated, just as Hansen had already done to the US temperature record – another country he believed was populated by inferior intellects who can’t read thermometers accurately.

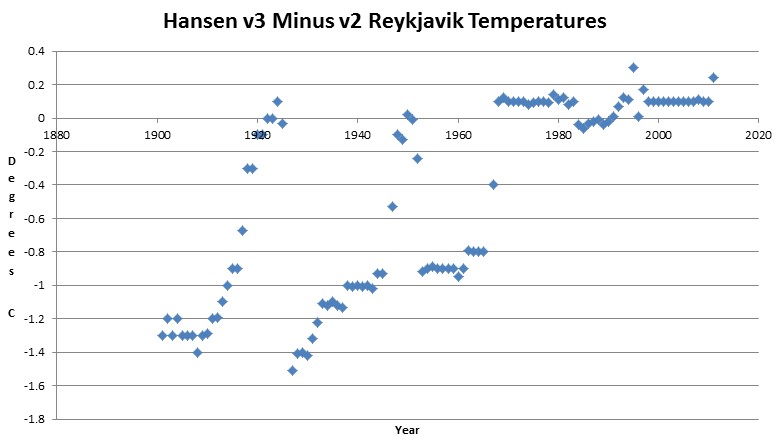
Having been called out by the Icelandic Met Office, Hansen has since traveled back in time again, and made his offense slightly less heinous than it was before – but look at his most recent data tampering below. Unfortunately the data used to generate the altered data above, has been overwritten. It would have looked even worse.

There is no valid mathematical basis for the patterns seen here. Someone is manually tampering with the data.

Our lukewarm friends insist that Hansen’s data is all good, because they can’t admit that they are wrong.

Posted in Uncategorized | 5 Comments