This Week In 1925

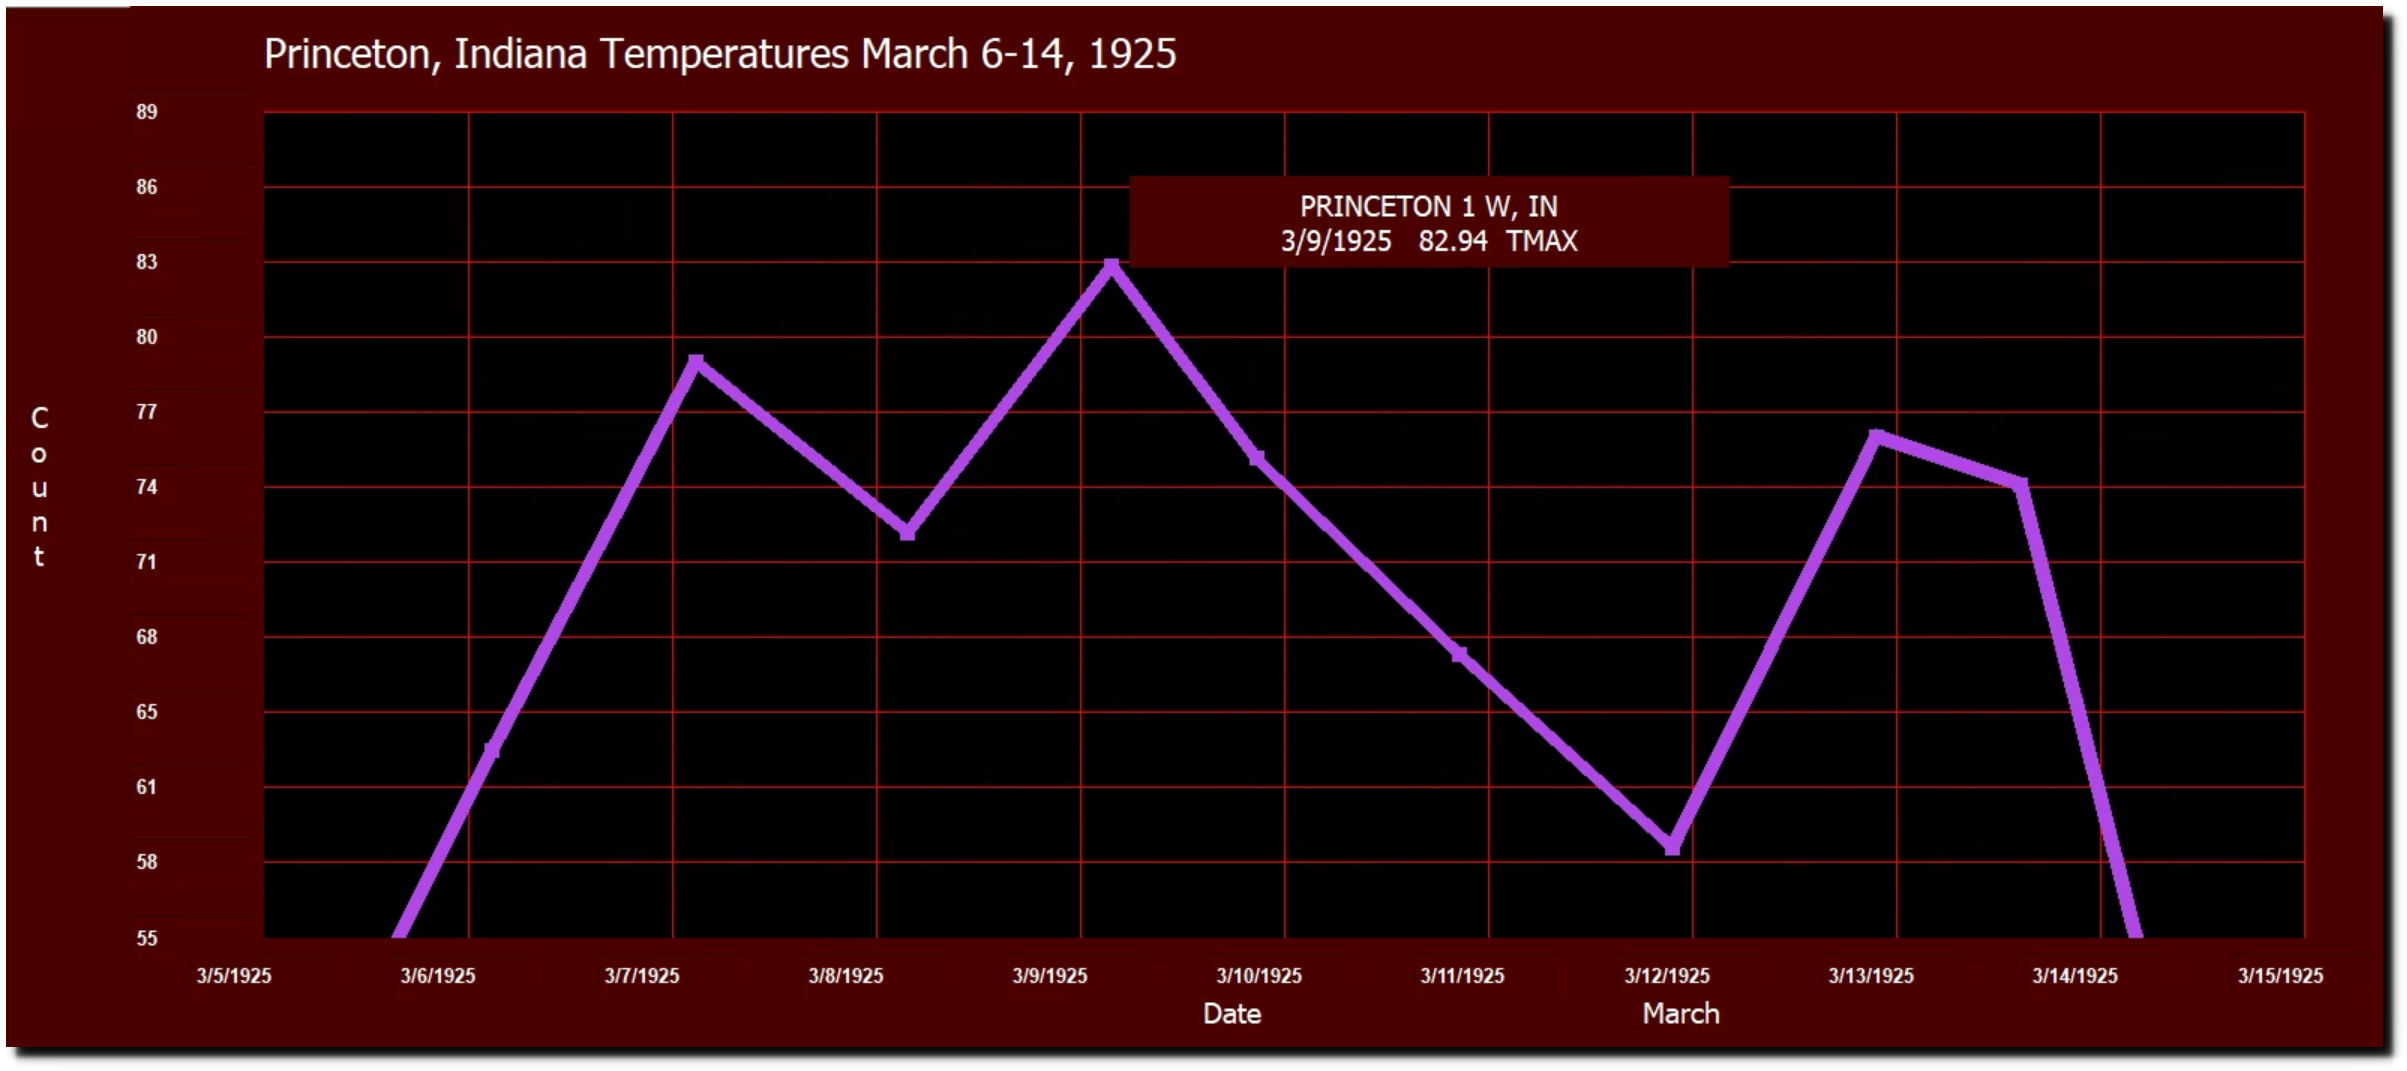
This week in 1925 was very warm in the Midwestern US. Princeton, Indiana averaged 72F from March 6-14 and peaked at 83 degrees on March 9.

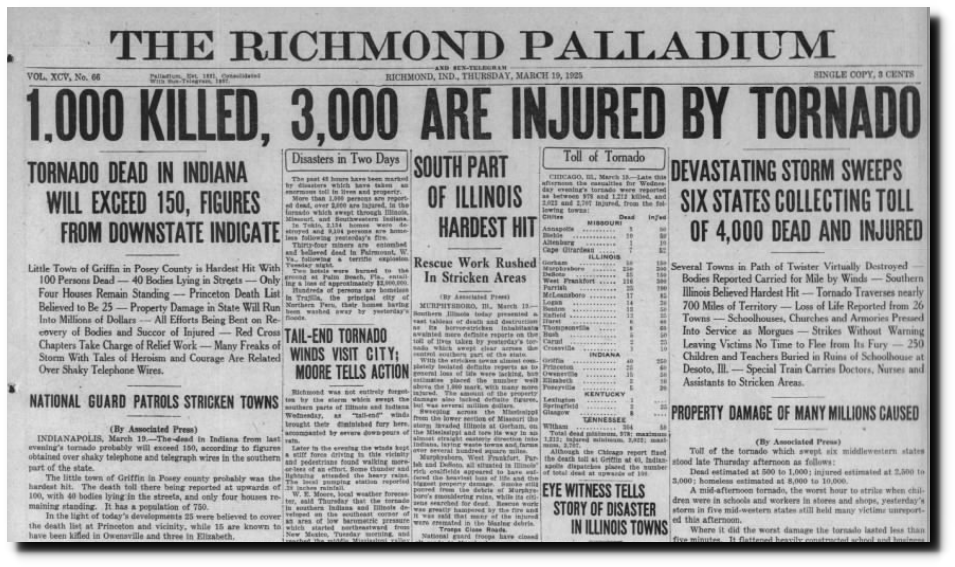
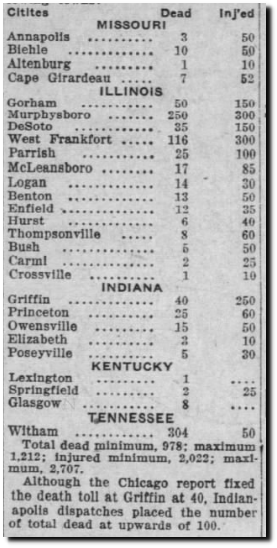
A few days later, the area was hit with the deadliest tornados in US history, which flattened dozens of towns in Illinois, Indiana, Missouri, Kentucky and Tennessee.

19 Mar 1925, Page 1 – Palladium-Item at Newspapers.com

Posted in Uncategorized | Leave a comment

Better Late Than Never …

The New York Times and LA Times have been quite open for many years about their policy of censoring anyone who tells the truth about climate.

The dangerous rise of climate censorship – spiked

Posted in Uncategorized | Leave a comment

Banana Republic

Democrats and the press are bragging about threatening a Supreme Court justice over his position. This used to be a serious crime known as “blackmail” and  “obstruction of justice.”

Clarence Thomas GOP Election Challenge Dissent Sparks Calls to Investigate His Wife

The definition of obstruction of justice seems to change depending on whether the target of the investigation is Republican or Democrat.

Phoenix airport at center of political intrigue after Lynch, Bill Clinton meeting

Mueller testimony: The 10 times Trump may have obstructed justice, according to the Mueller report – CBS News

Posted in Uncategorized | Leave a comment

The Permanent California Drought

“Climate Change is real. California Republicans believe it and are working to address it.”

– John Kasich and Arnold Schwarzenegger

Schwarzenegger, Kasich join forces with new California group that wants to change the state GOP – TheBlaze

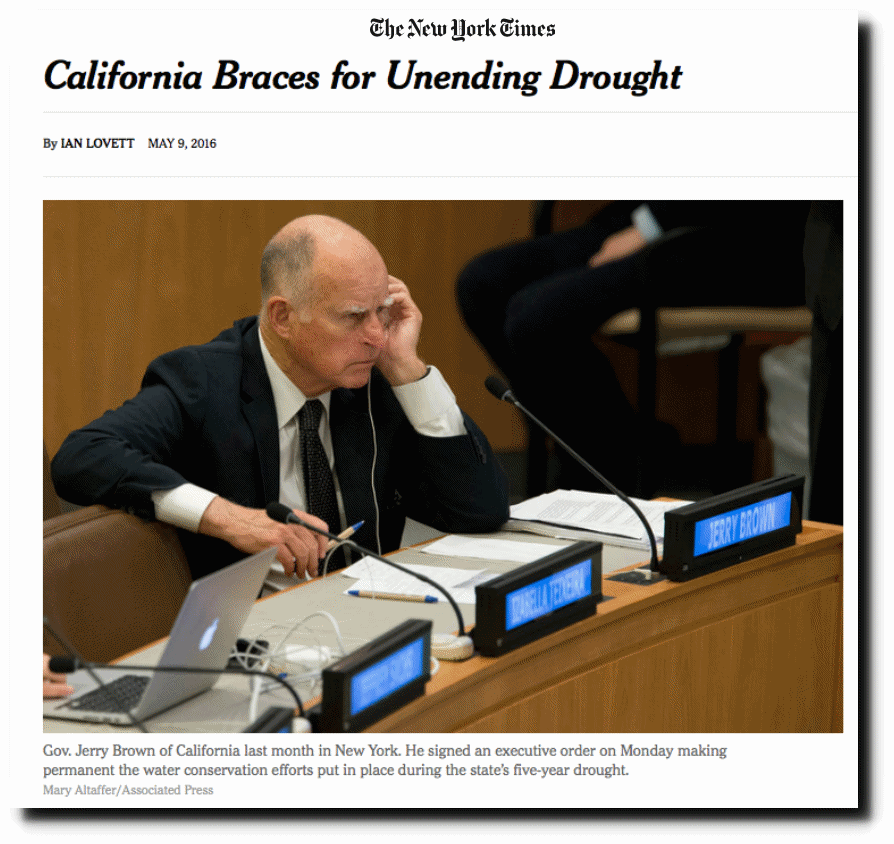
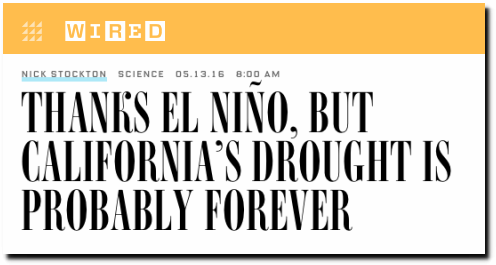
Five years ago the New York Times and Governor Jerry Brown announced the California Permanent Drought.

California Braces for Unending Drought – The New York Times

Thanks El Niño, But California’s Drought Is Probably Forever | WIRED

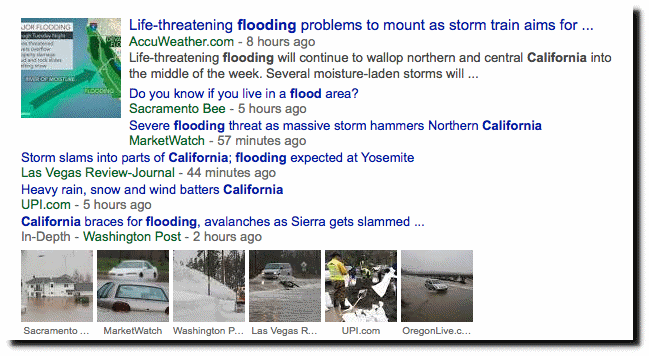
A few months later, California was deal with historic flooding.

NWS: Northern California now on pace for ‘wettest water year on record’ – SFGate

There has been no trend in California precipitation over the last 125 years.

Climate at a Glance | National Centers for Environmental Information (NCEI)

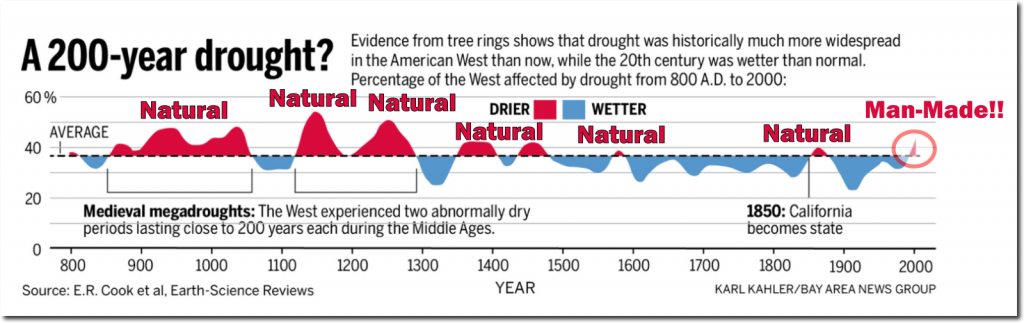
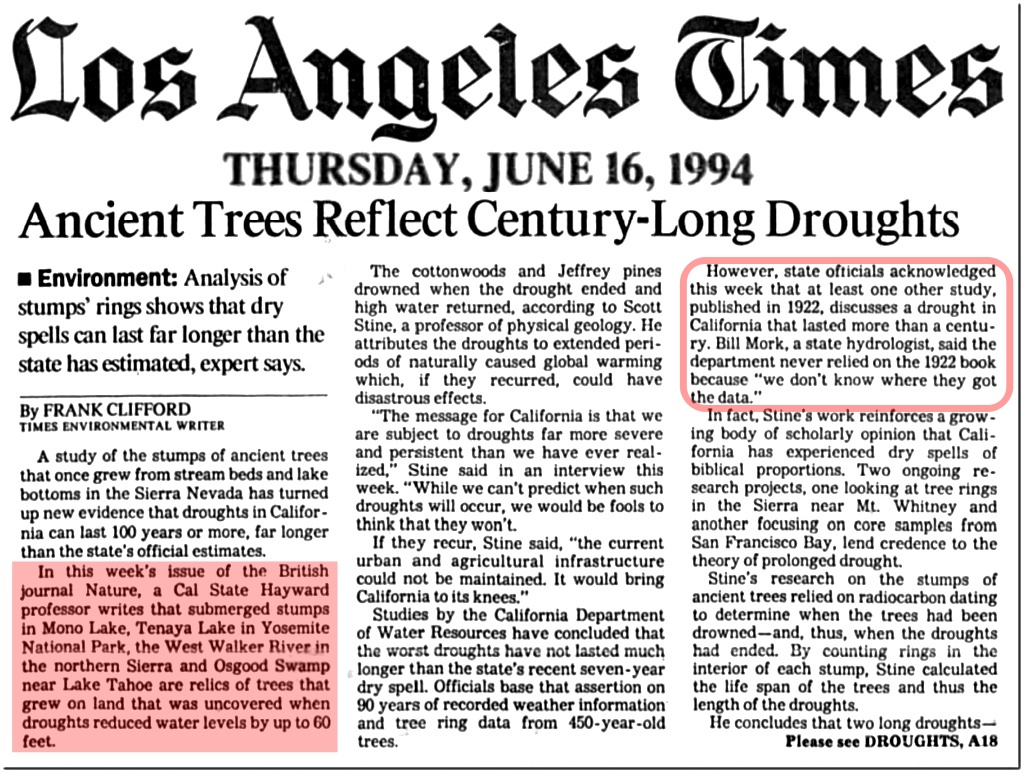
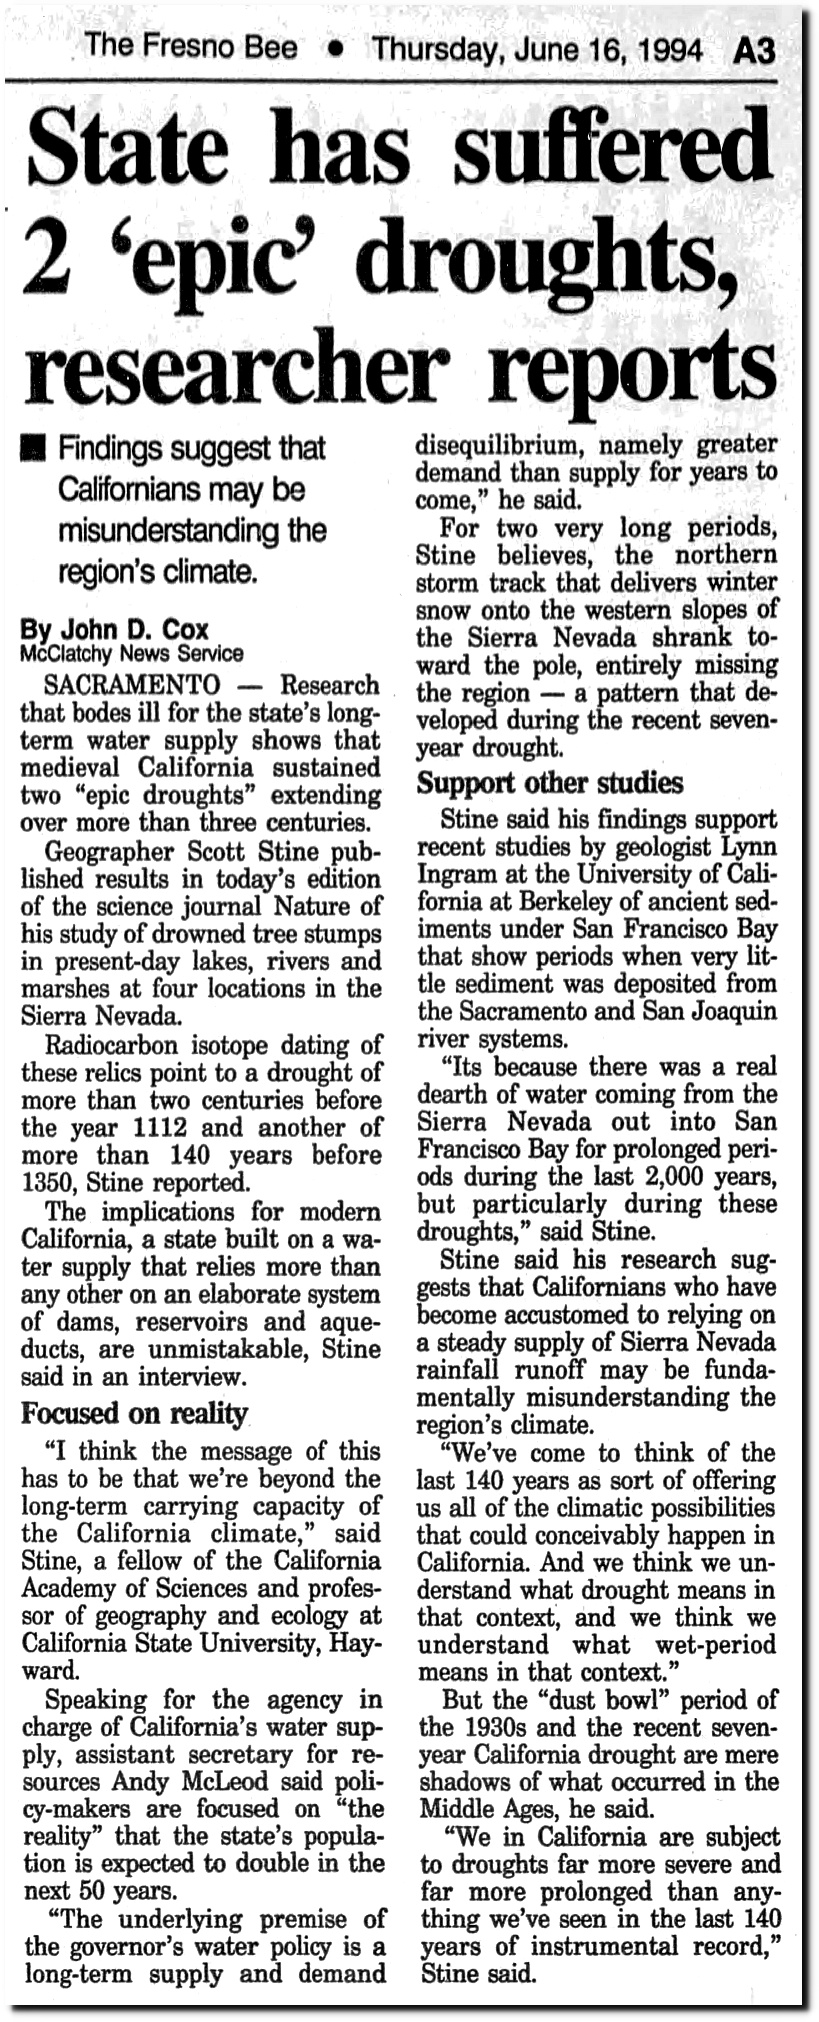
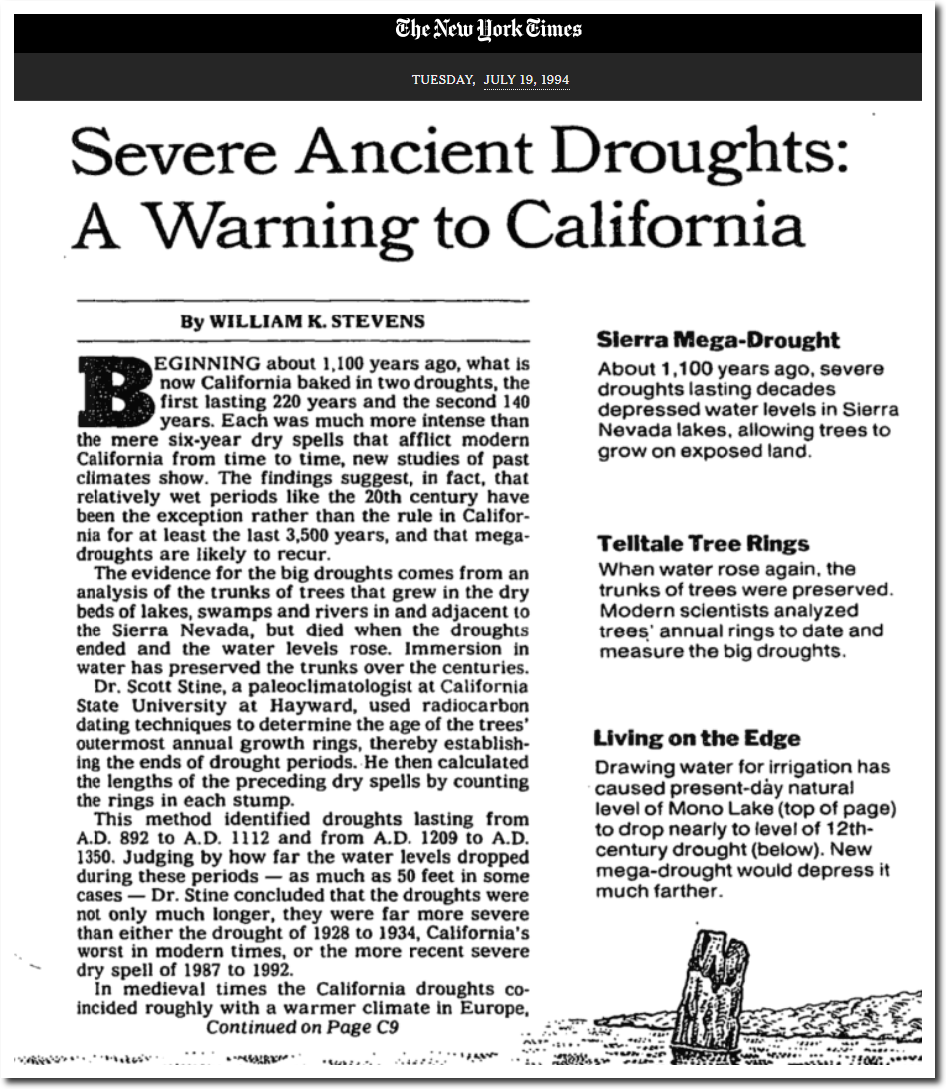
Long term, droughts have become much less common and severe.

Graphic: California’s droughts in the past 1,200 years – The Mercury News

Ancient Trees Reflect Century-Long Droughts : Environment: Analysis of stumps’ rings shows that dry spells can last far longer than the state has estimated, expert says. – latimes

16 Jun 1994, 3 – The Fresno Bee at Newspapers.com

Thirty years ago, the New York Times knew that the 20th century was unusually wet in California, and that the Medieval Warm Period was global.

“Lisa J. Graumlich, who examines the ring patterns of foxtail pine trees and western junipers in the Sierra Nevada, has compiled a detailed record of the year-to-year variation in temperature and precipitation over the last thousand years.

She has seen in the North American trees the feathery but unmistakable signatures of the Medieval Warm Period, a era from 1100 to 1375 A.D. when, according to European writers of the time and other sources, the climate was so balmy that wine grapes flourished in Britain and the Vikings farmed the now-frozen expanse of Greenland; and the Little Ice Age, a stretch of abnormally frigid weather lasting roughly from 1450 to 1850. A Crucial Question

“We can now see that these were global climate phenomena, not regional temperature variations,” she said. “The question is, how did we get those warmer temperatures during pre-industrial times, and what can we learn from those conditions about what is going on today?”

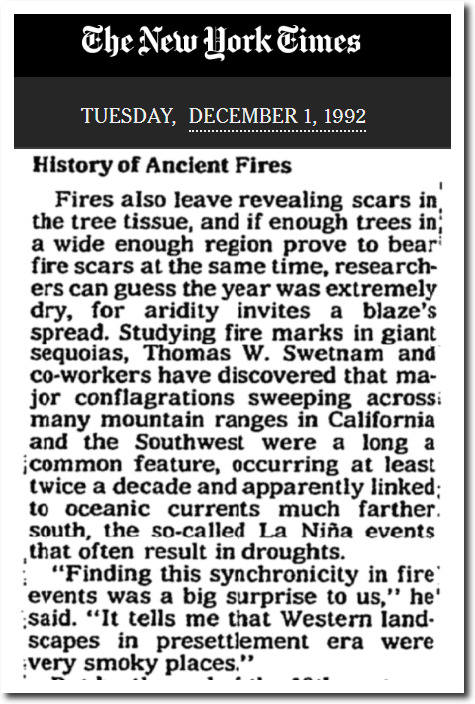
Western landscapes in presettlement era were very smoky places.

Warming? Tree Rings Say Not Yet – The New York Times

Severe Ancient Droughts: A Warning to California – The New York Times

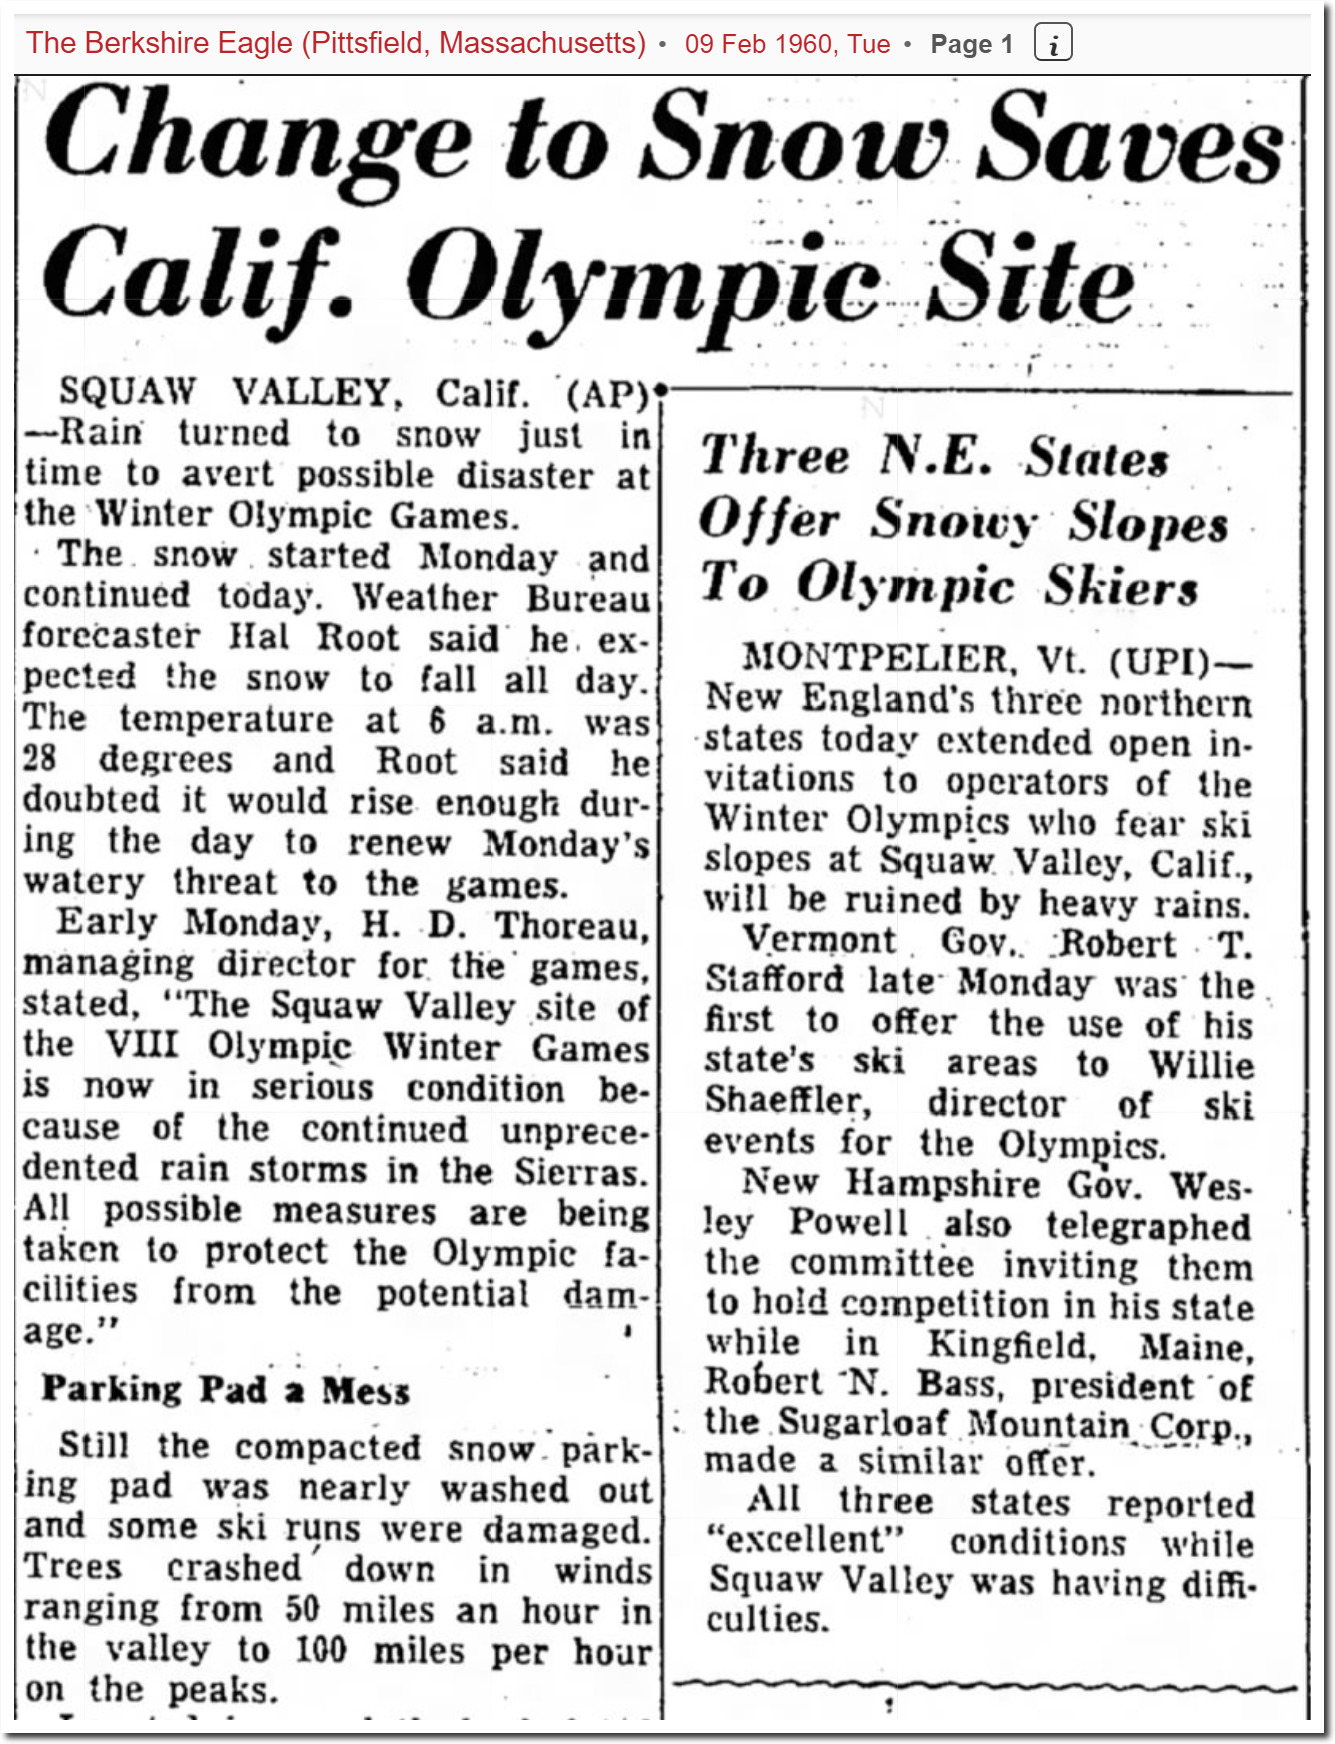
Sixty years ago, the Squaw Valley Winter Olympics almost had to be cancelled because of a lack of snow.

09 Feb 1960, Page 1 – The Berkshire Eagle at Newspapers.com

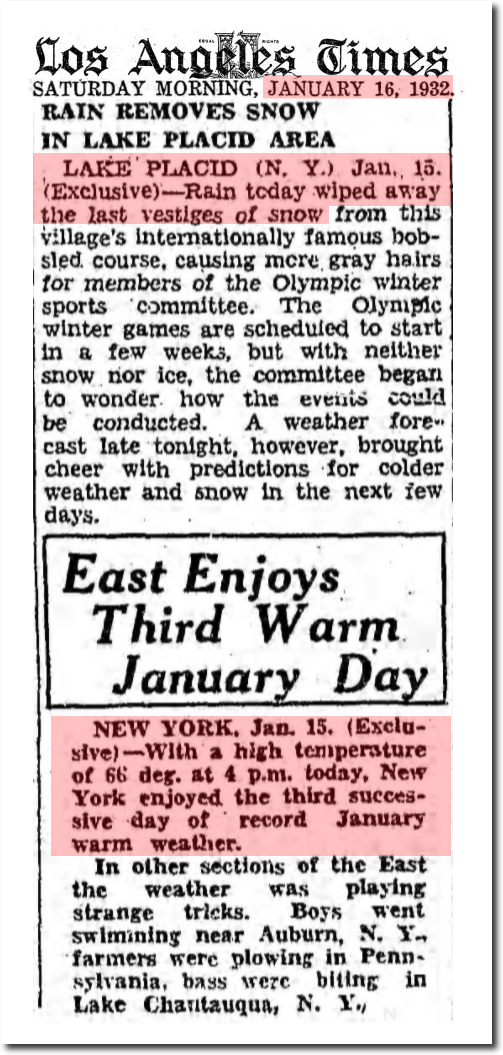
And in 1932, the Lake Placid Winter Olympics almost had to be cancelled because of a lack of snow.

16 Jan 1932, Page 1 – The Los Angeles Times 

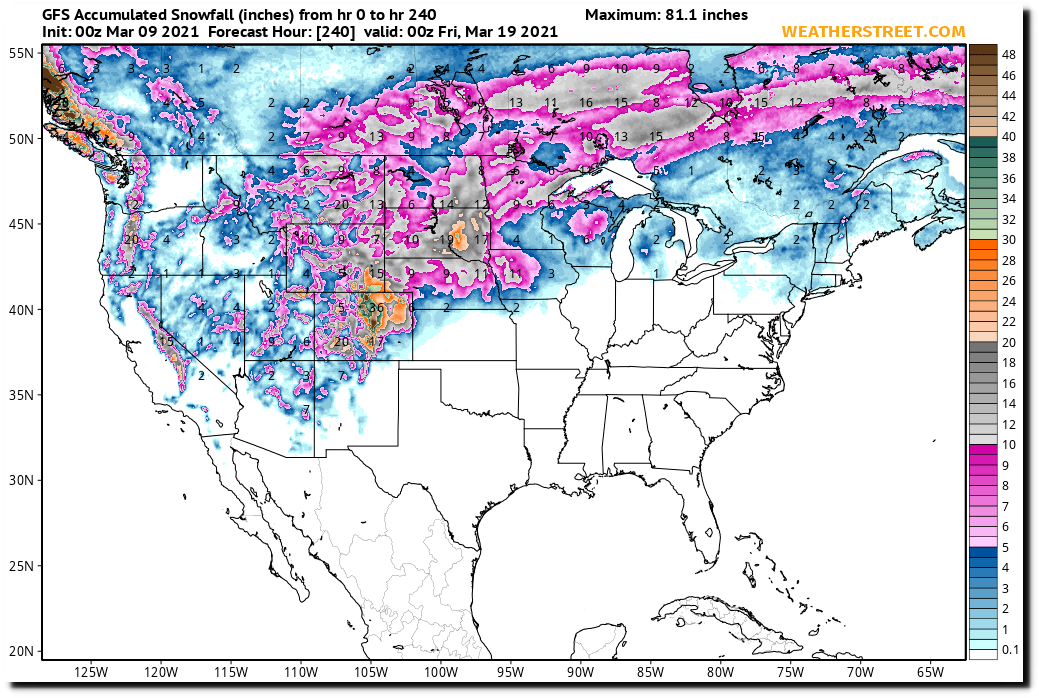
But no shortage of snow now – we are expecting another couple of feet here in Cheyenne, Wyoming this week.

Link

Posted in Uncategorized | Leave a comment

Solar Forecast

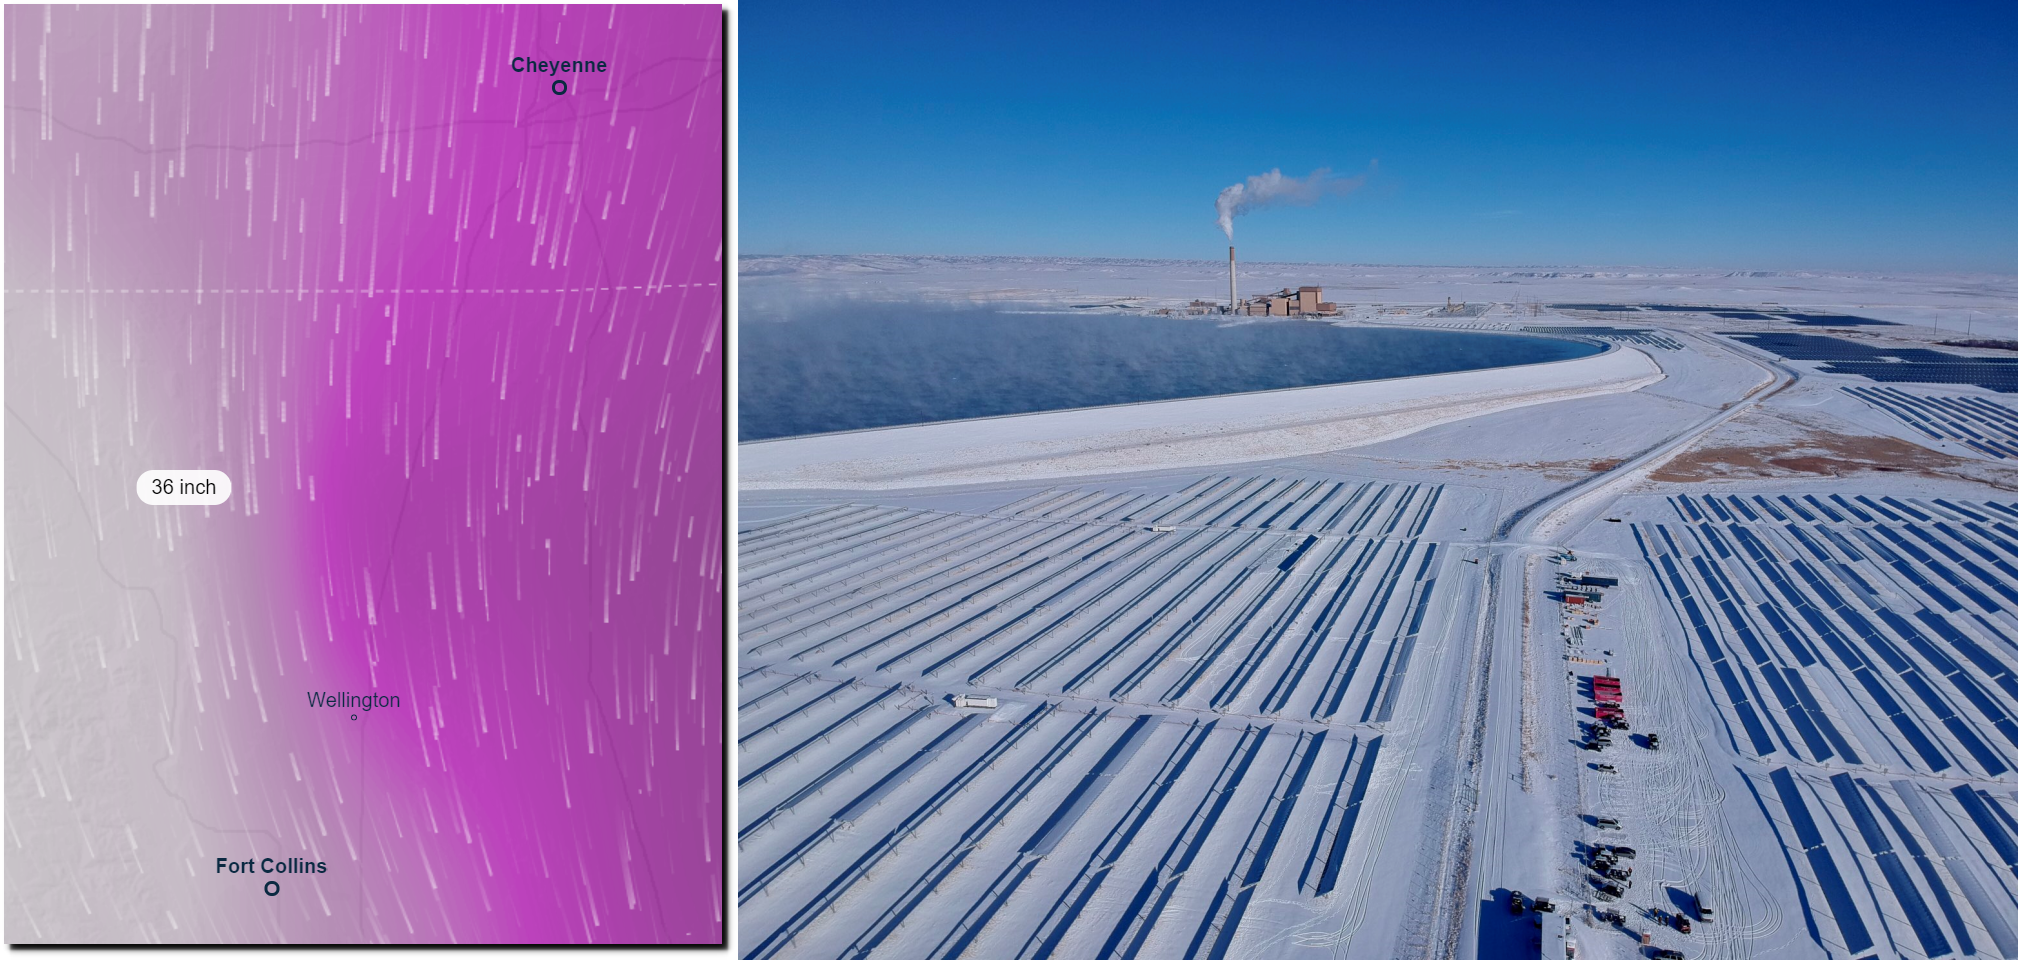
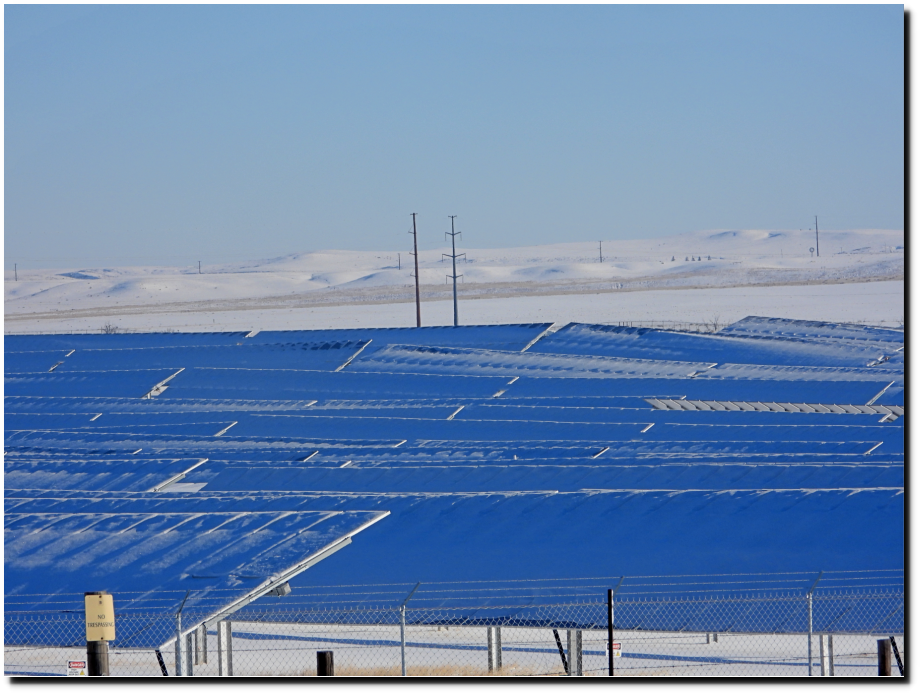
The giant solar array at the coal fired Rawhide Generating Station in northern Colorado is forecast to be buried in three feet of snow this weekend.

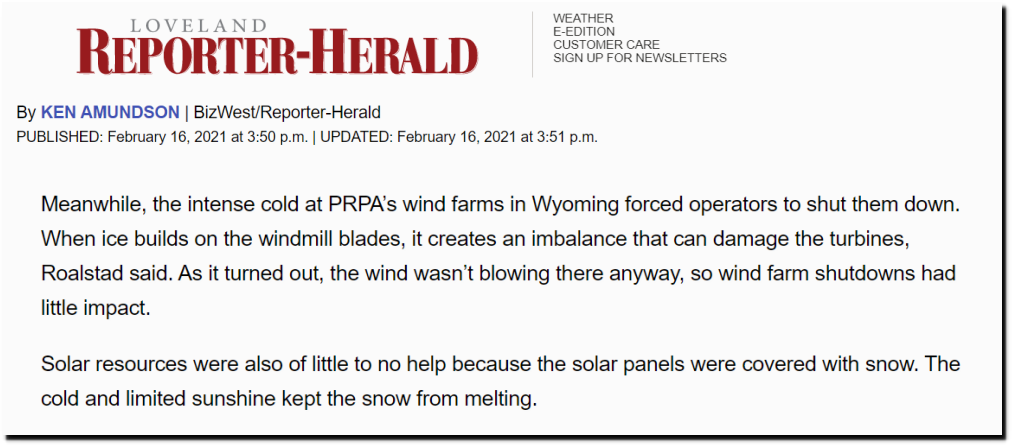
This is what they looked like on February 15 at -10F (-24C) with all wind and solar shut down in Colorado and Wyoming.

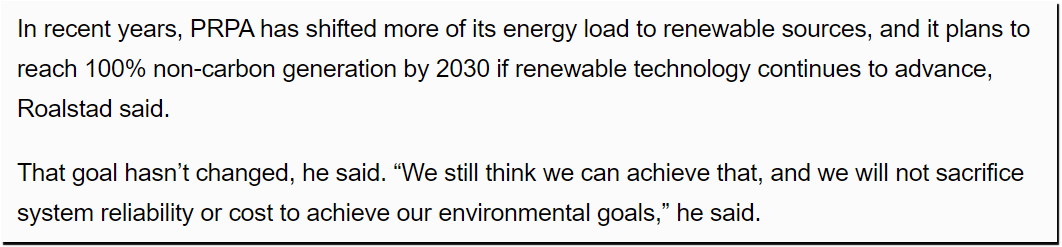
Colorado plans to be 100% wind and solar by 2030.

PRPA: Cold snap accentuates importance of energy networks – Loveland Reporter-Herald

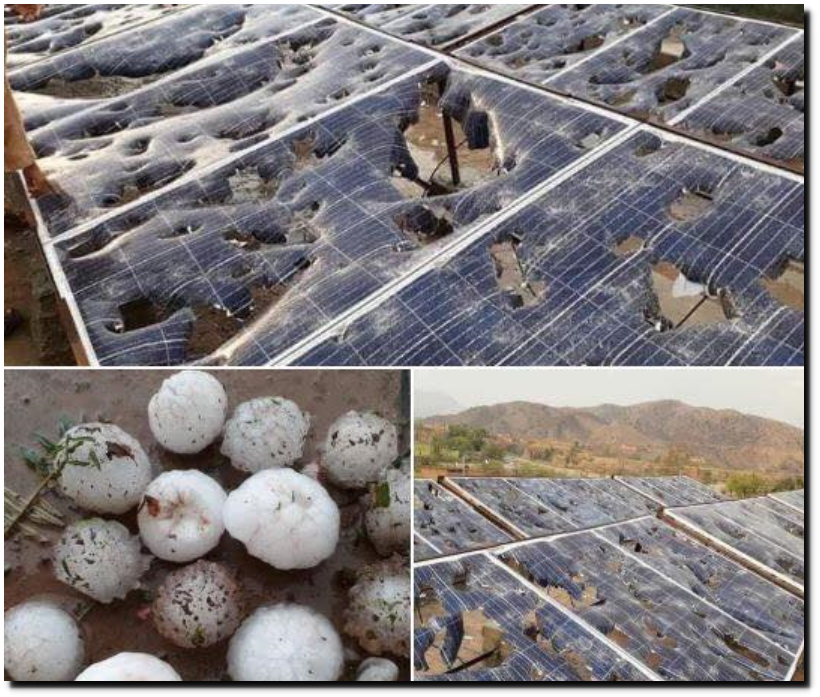
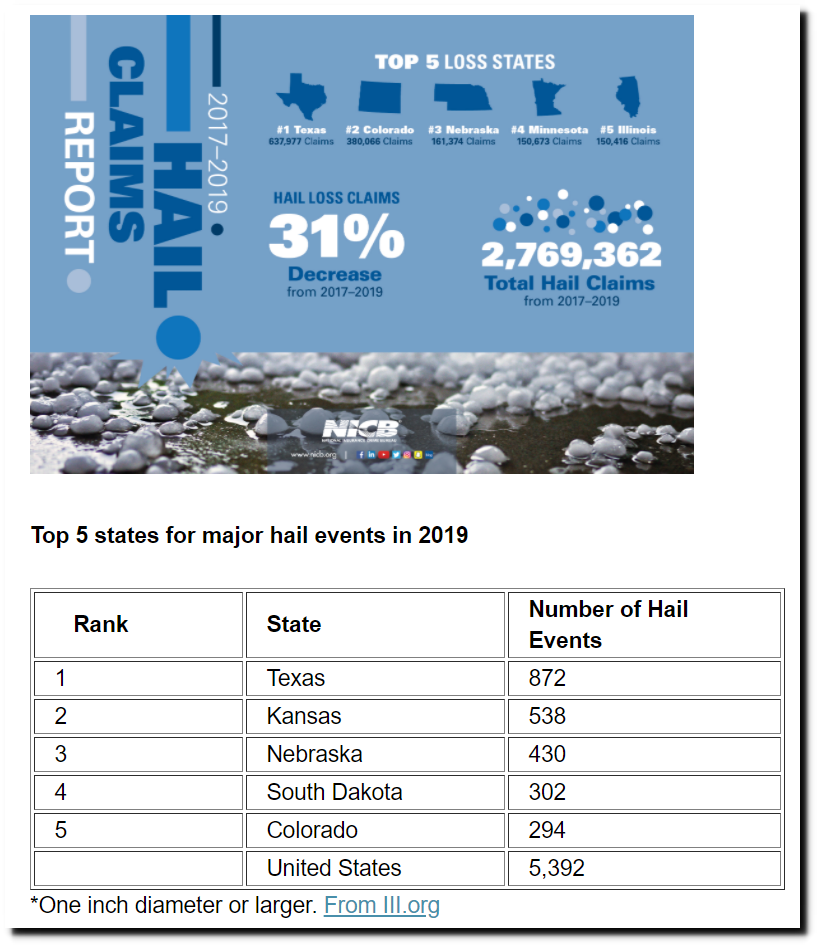
The Front Range of Colorado is also one of the highest risk areas for hail damage in the US.

Hail Damage and Statistics

Posted in Uncategorized | Leave a comment

Are Official US Temperature Graphs Credible?

Ninety years ago, the New York Times reported unanimous consensus that Earth’s climate was controlled by the sun.
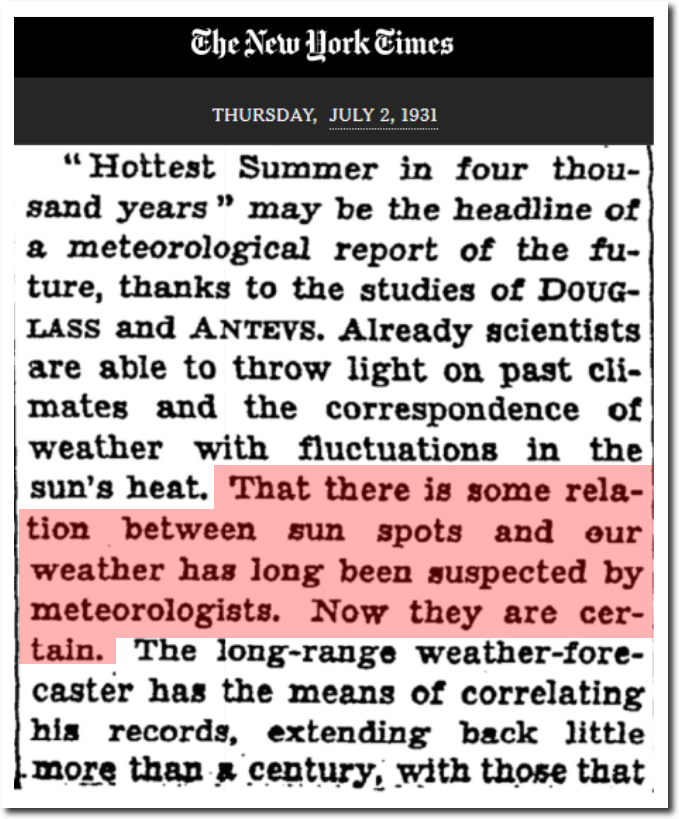
TimesMachine: July 2, 1931 – NYTimes.com

Now NASA reports 97% consensus that Earth’s climate is controlled by CO2.

“Multiple studies published in peer-reviewed scientific journals show that 97 percent or more of actively publishing climate scientists agree*: Climate-warming trends over the past century are extremely likely due to human activities.”
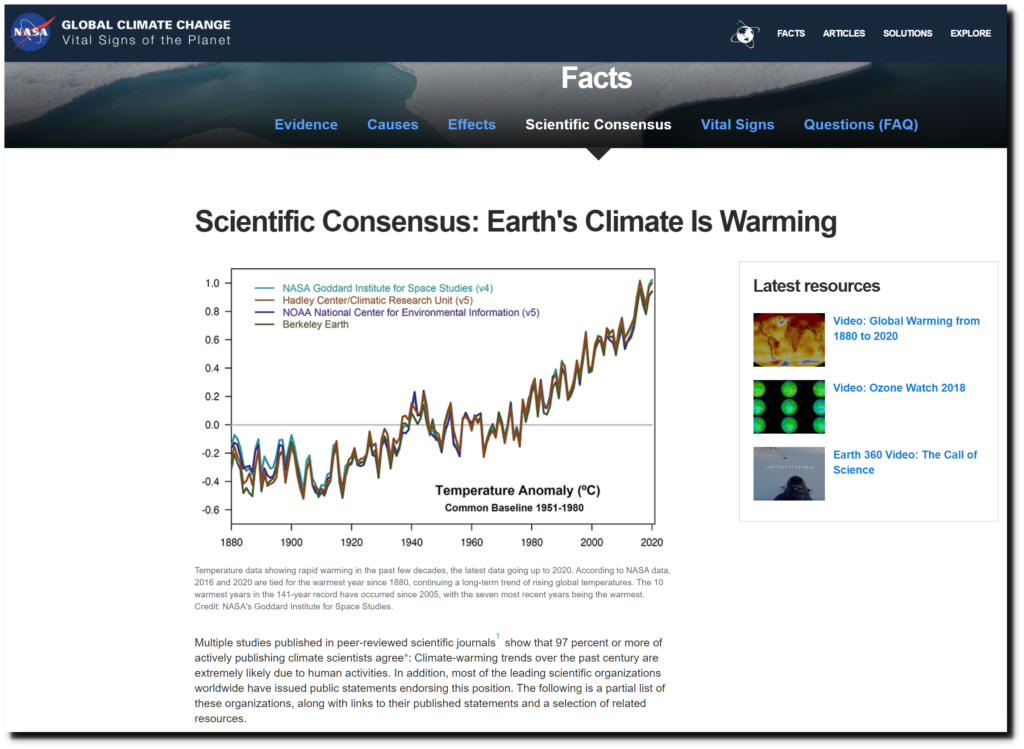
Scientific Consensus | Facts – Climate Change: Vital Signs of the Planet

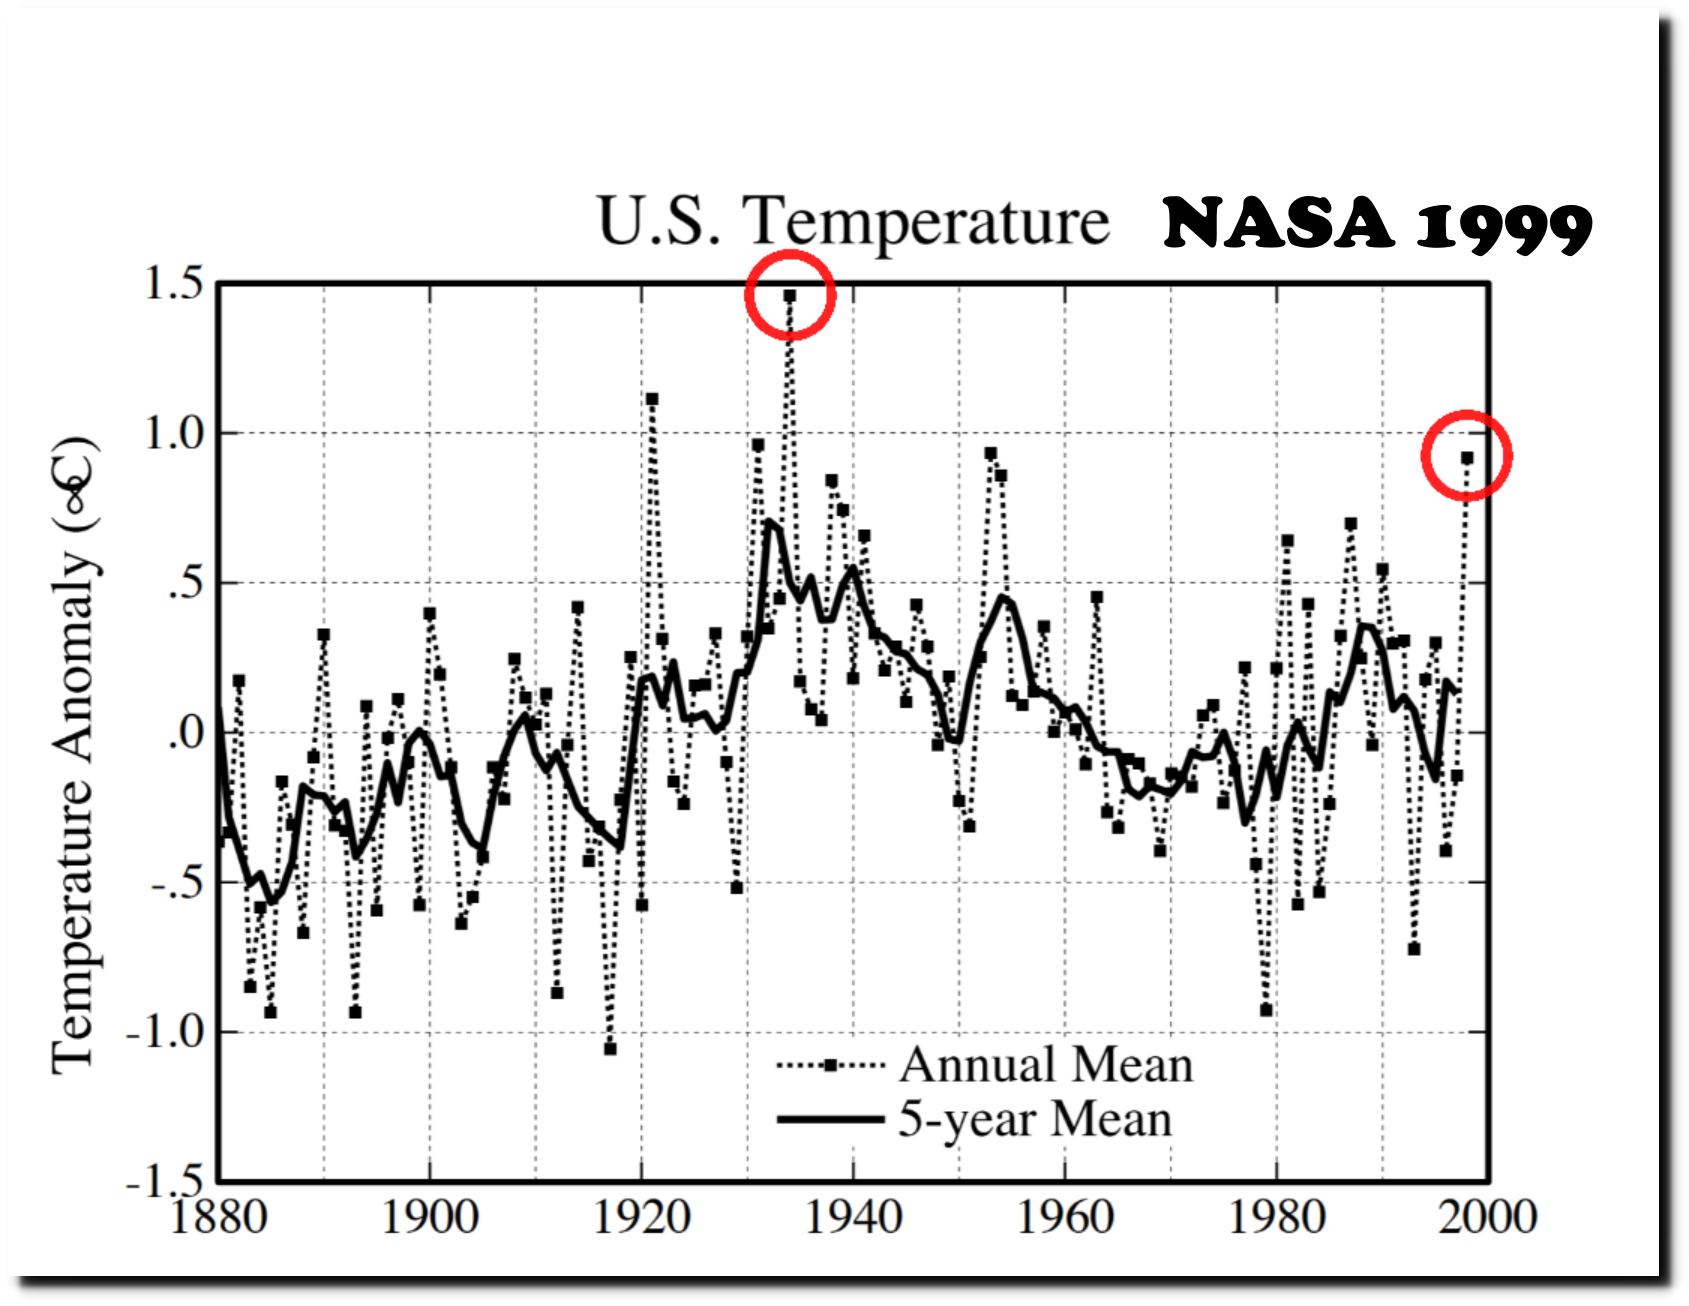
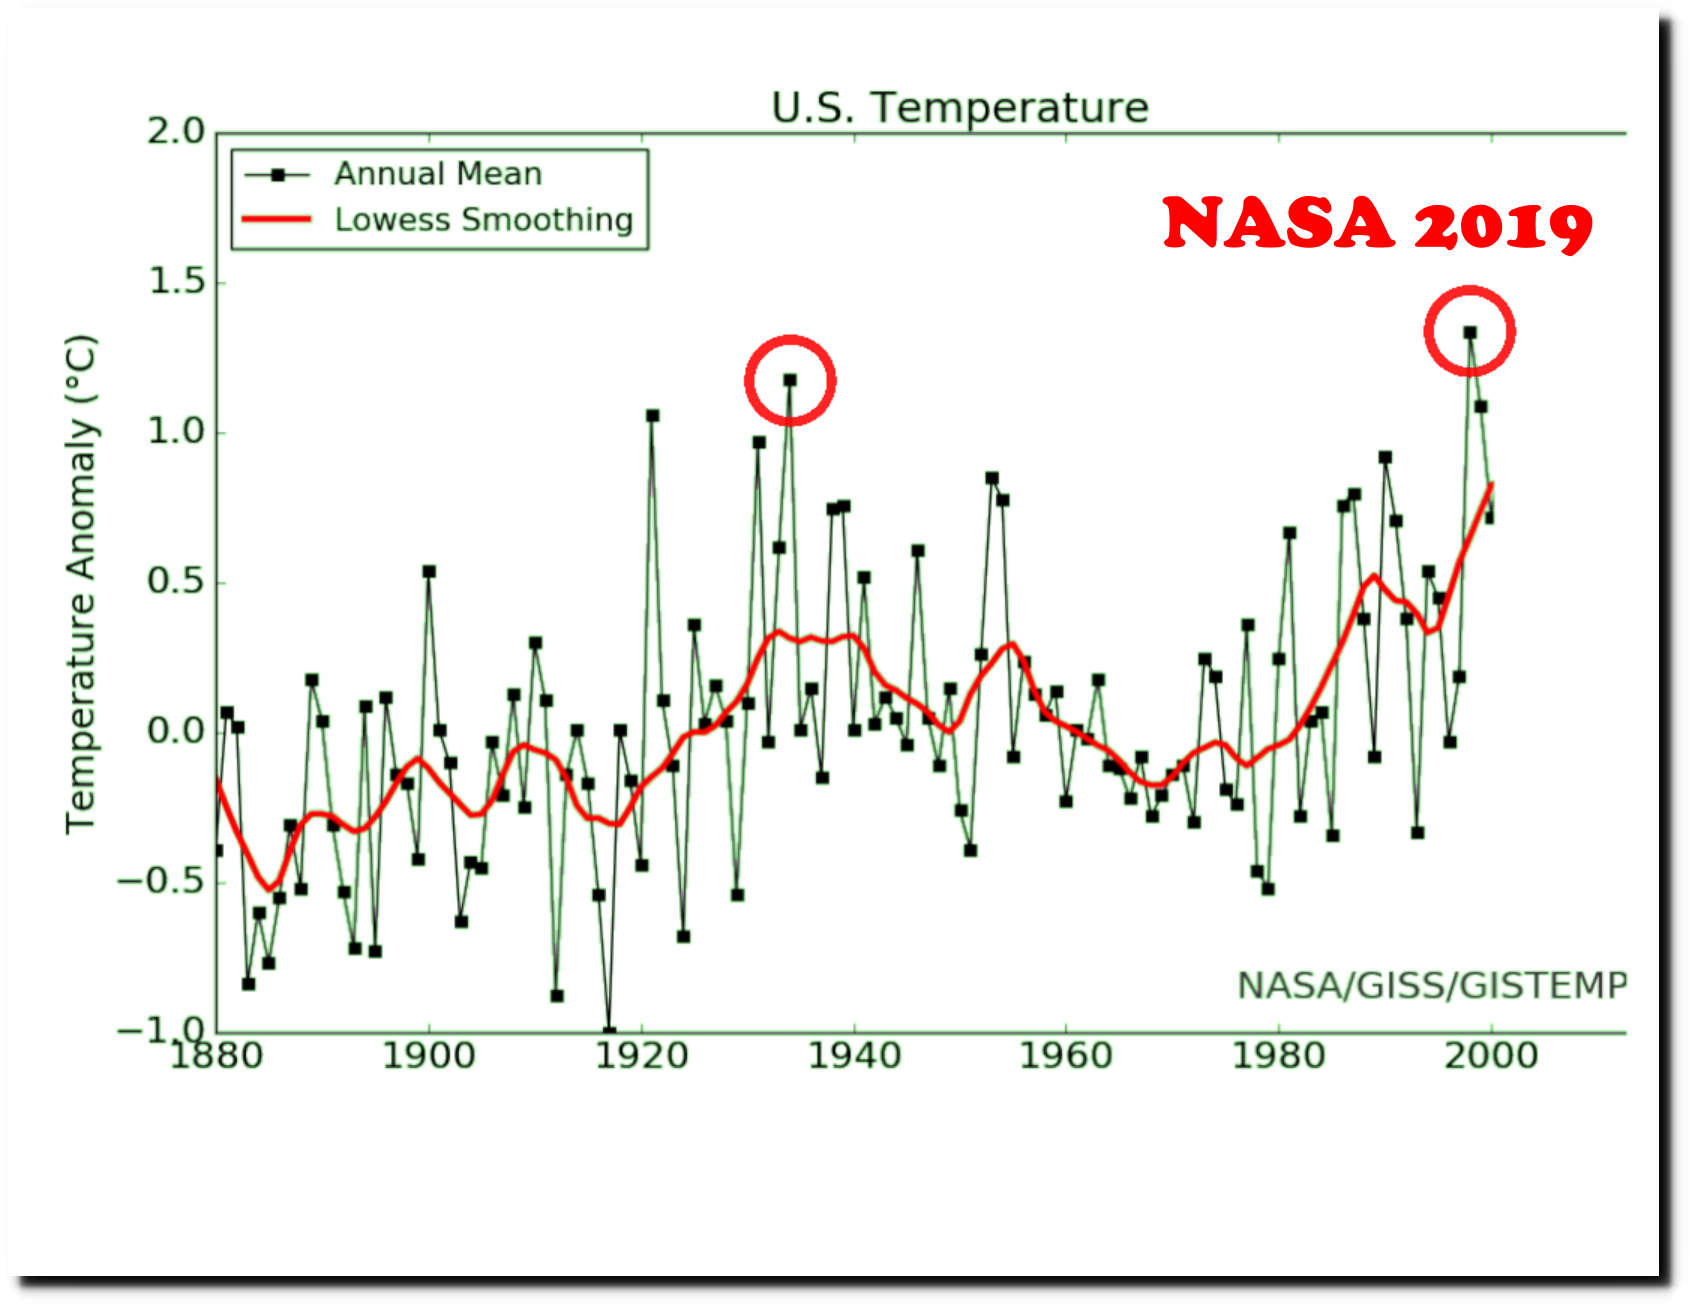
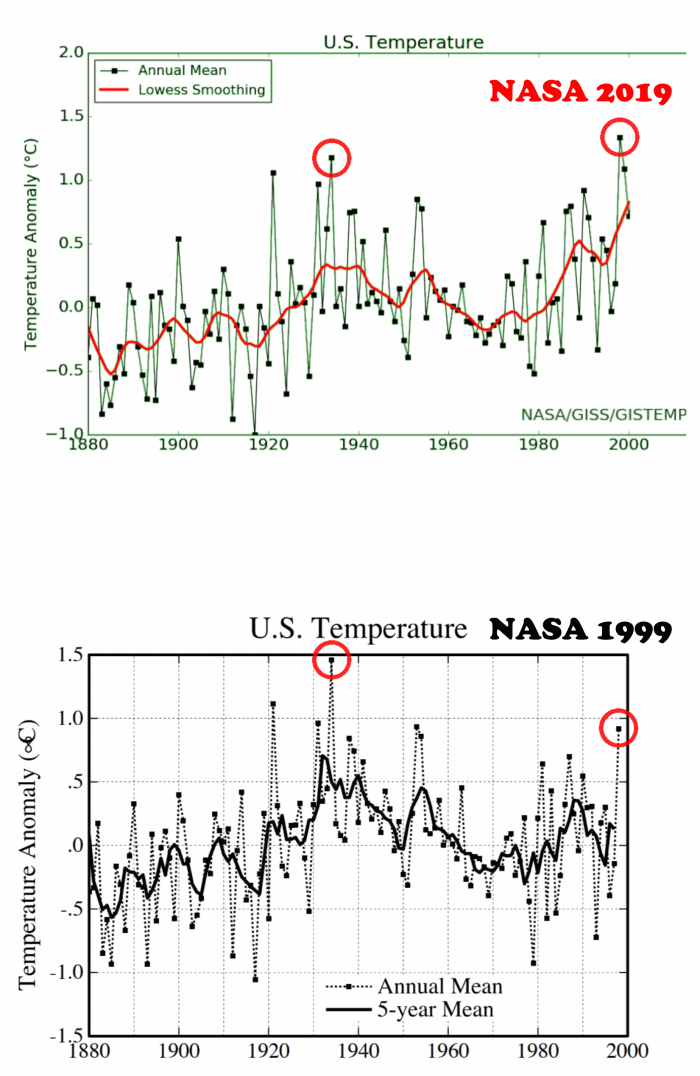
I agree with them – the warming trends over the last century are primarily due to human activities – data tampering by organizations like NASA and NOAA. For example, over the past 20 years NASA has turned a cooling trend in the US from 1930 to 1998 into a warming trend. This is the 1999 version.
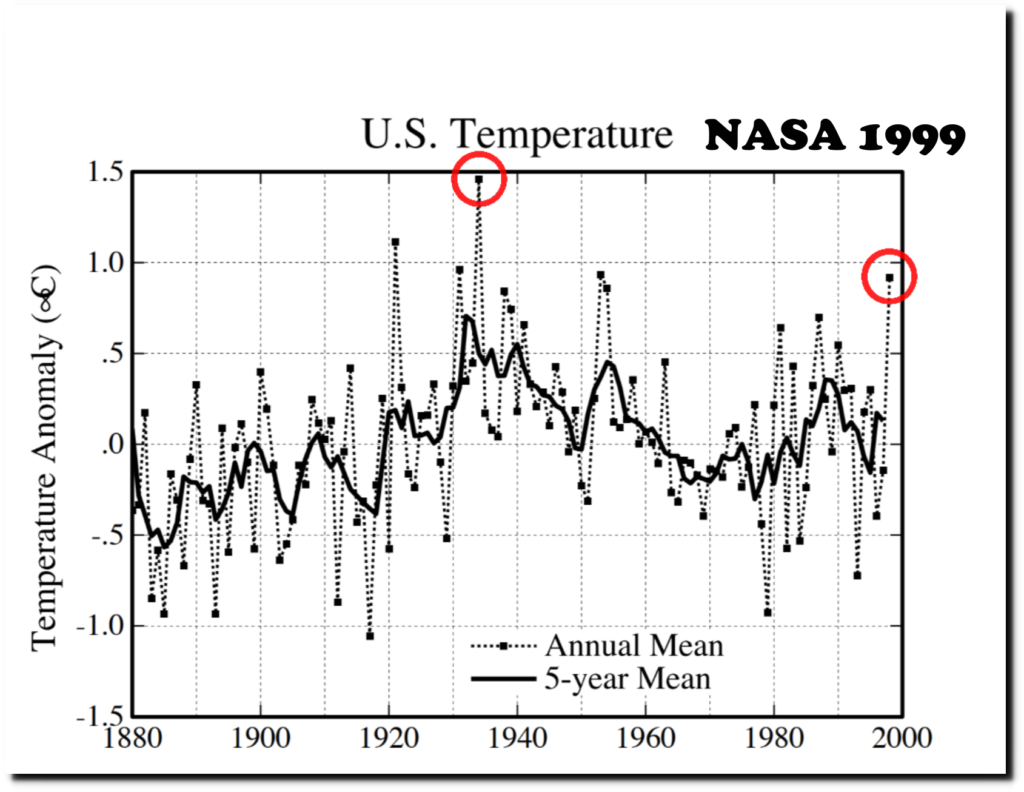
NASA 1999

And this is NASA’s current graph.
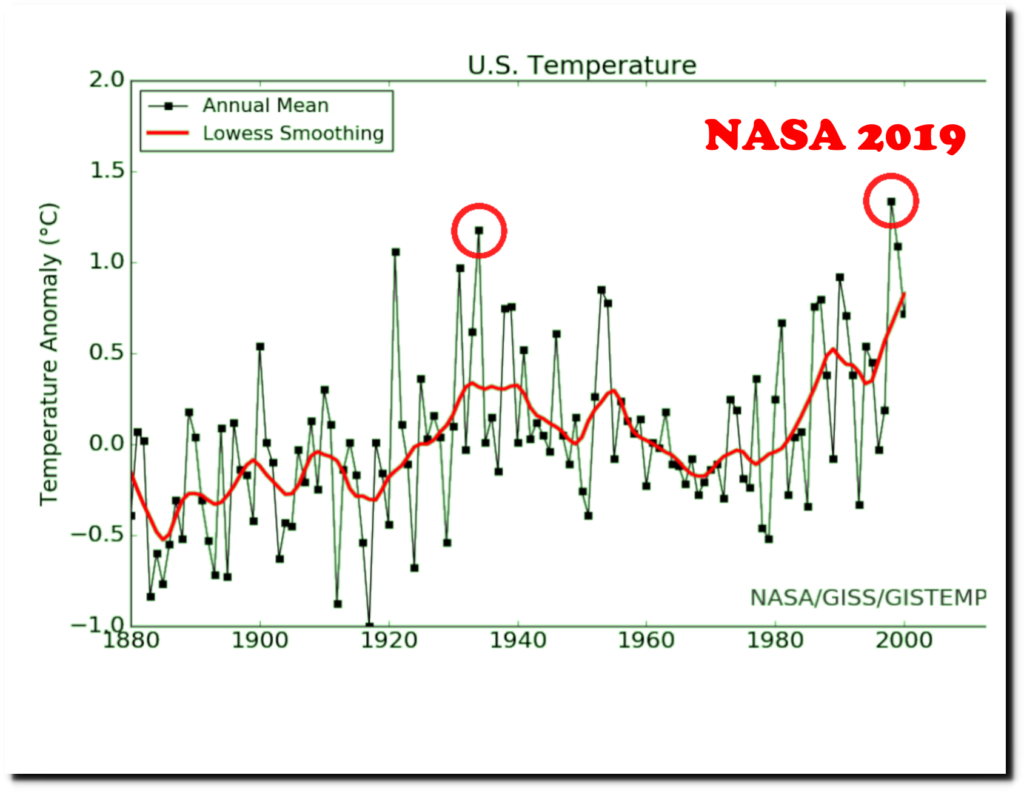
NASA 2021

Here is an animation showing how the data has been altered over the past 20 years.
The US temperature record is very important, because the vast majority of global stations in the NOAA GHCN database with a long term daily temperature record are located in the US.
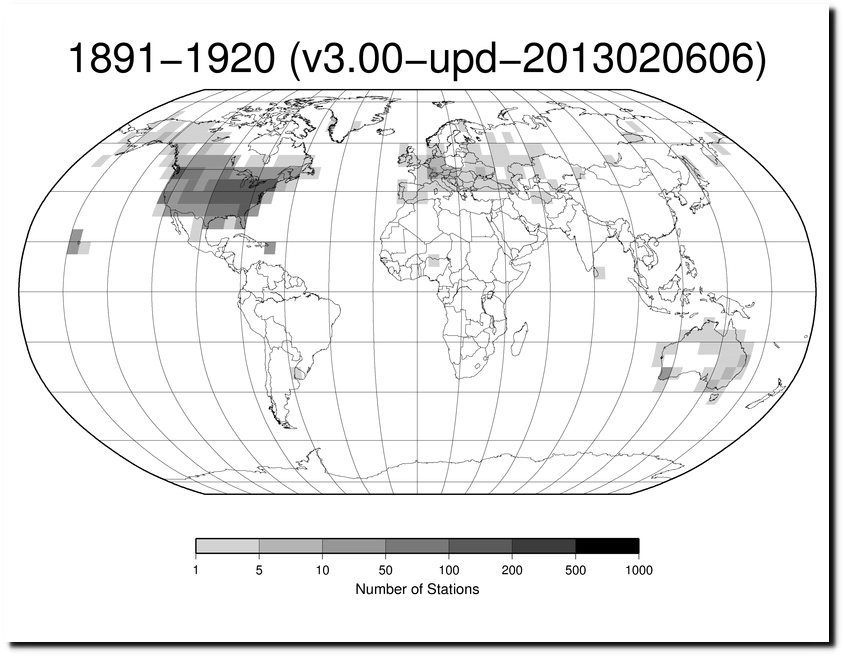
station-counts-1891-1920-temp.png

In 1986, NASA’s James Hansen predicted 4-6 degrees warming for the US by the year 2020, and a huge increase in heatwaves.

“He said that with an expected doubling of atmospheric carbon dioxide by 2040, the number of days each year with temperatures over 80 degrees would rise from 35 to 85 in Washington, D.C., and Omaha, Neb.”

12 Jun 1986, Page 12 – The Evening Times at Newspapers.com

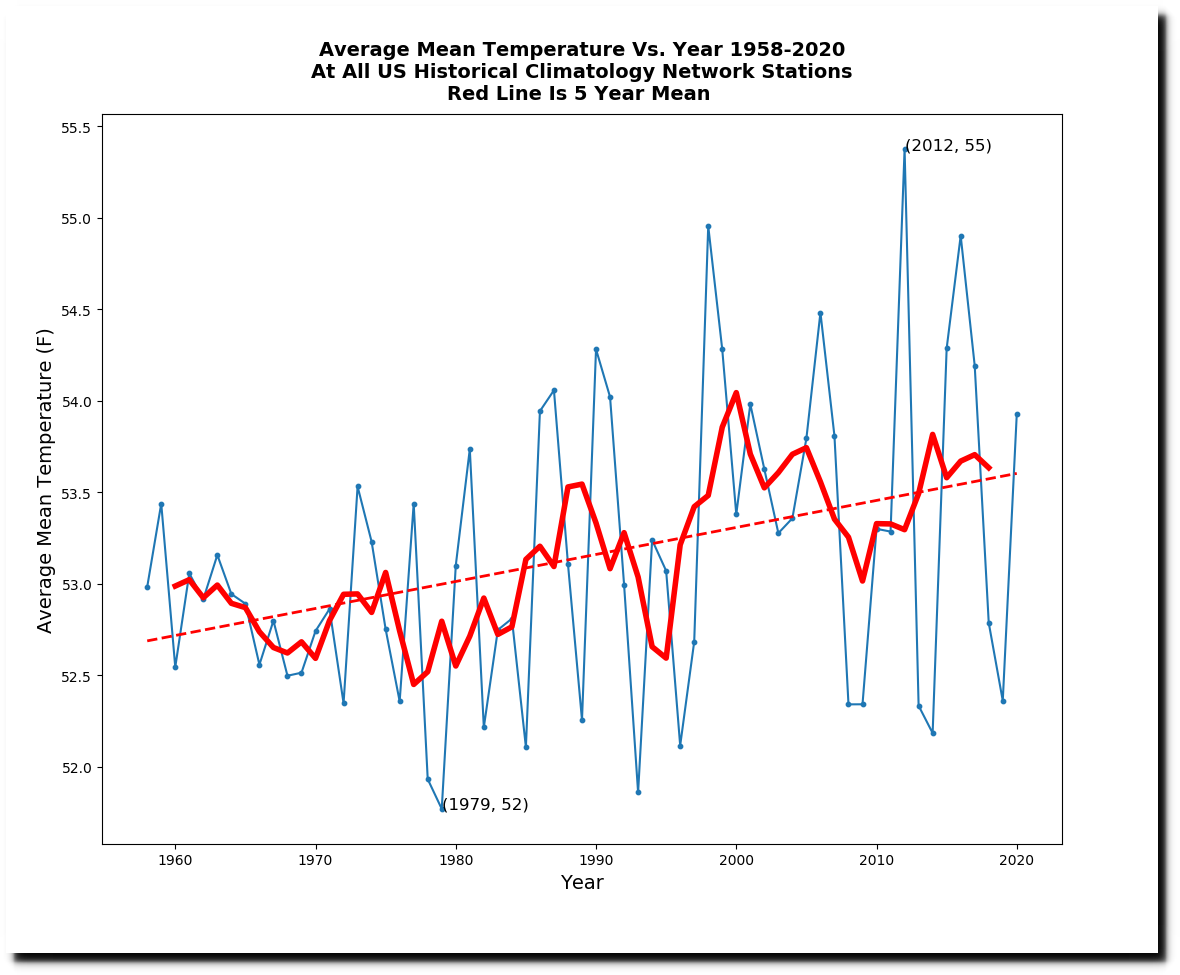
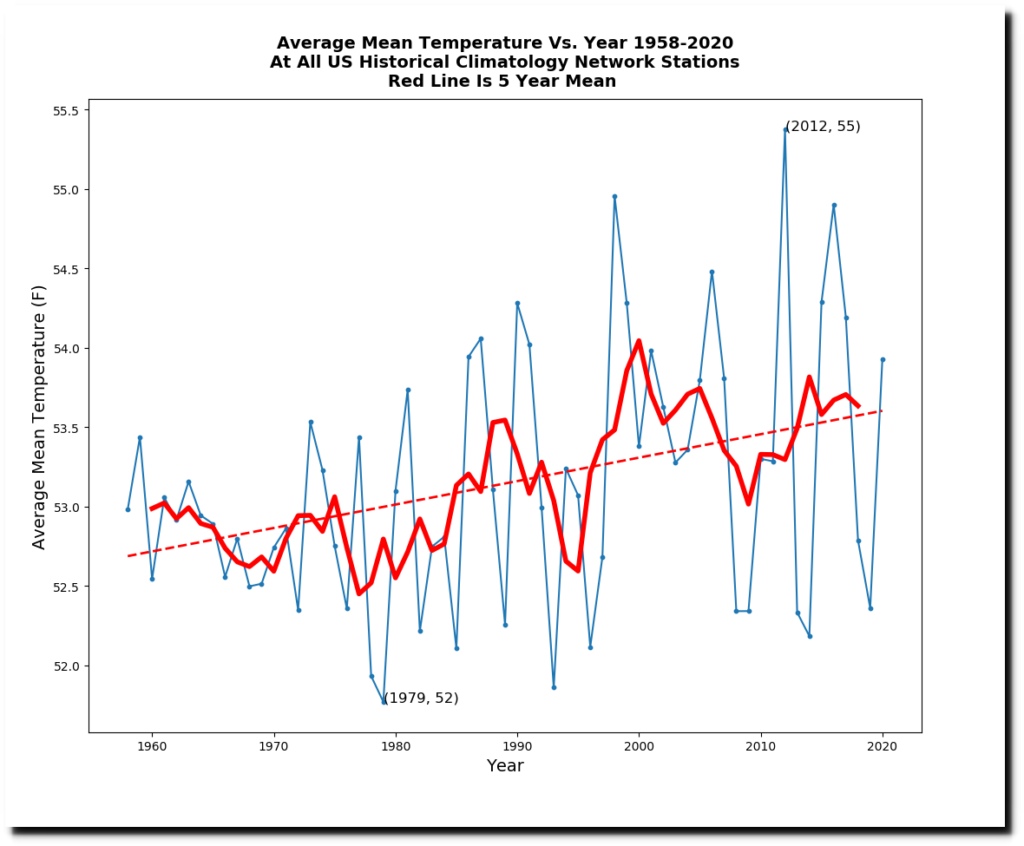
The actual temperature increase from 1958 to 2020 was about one degree.
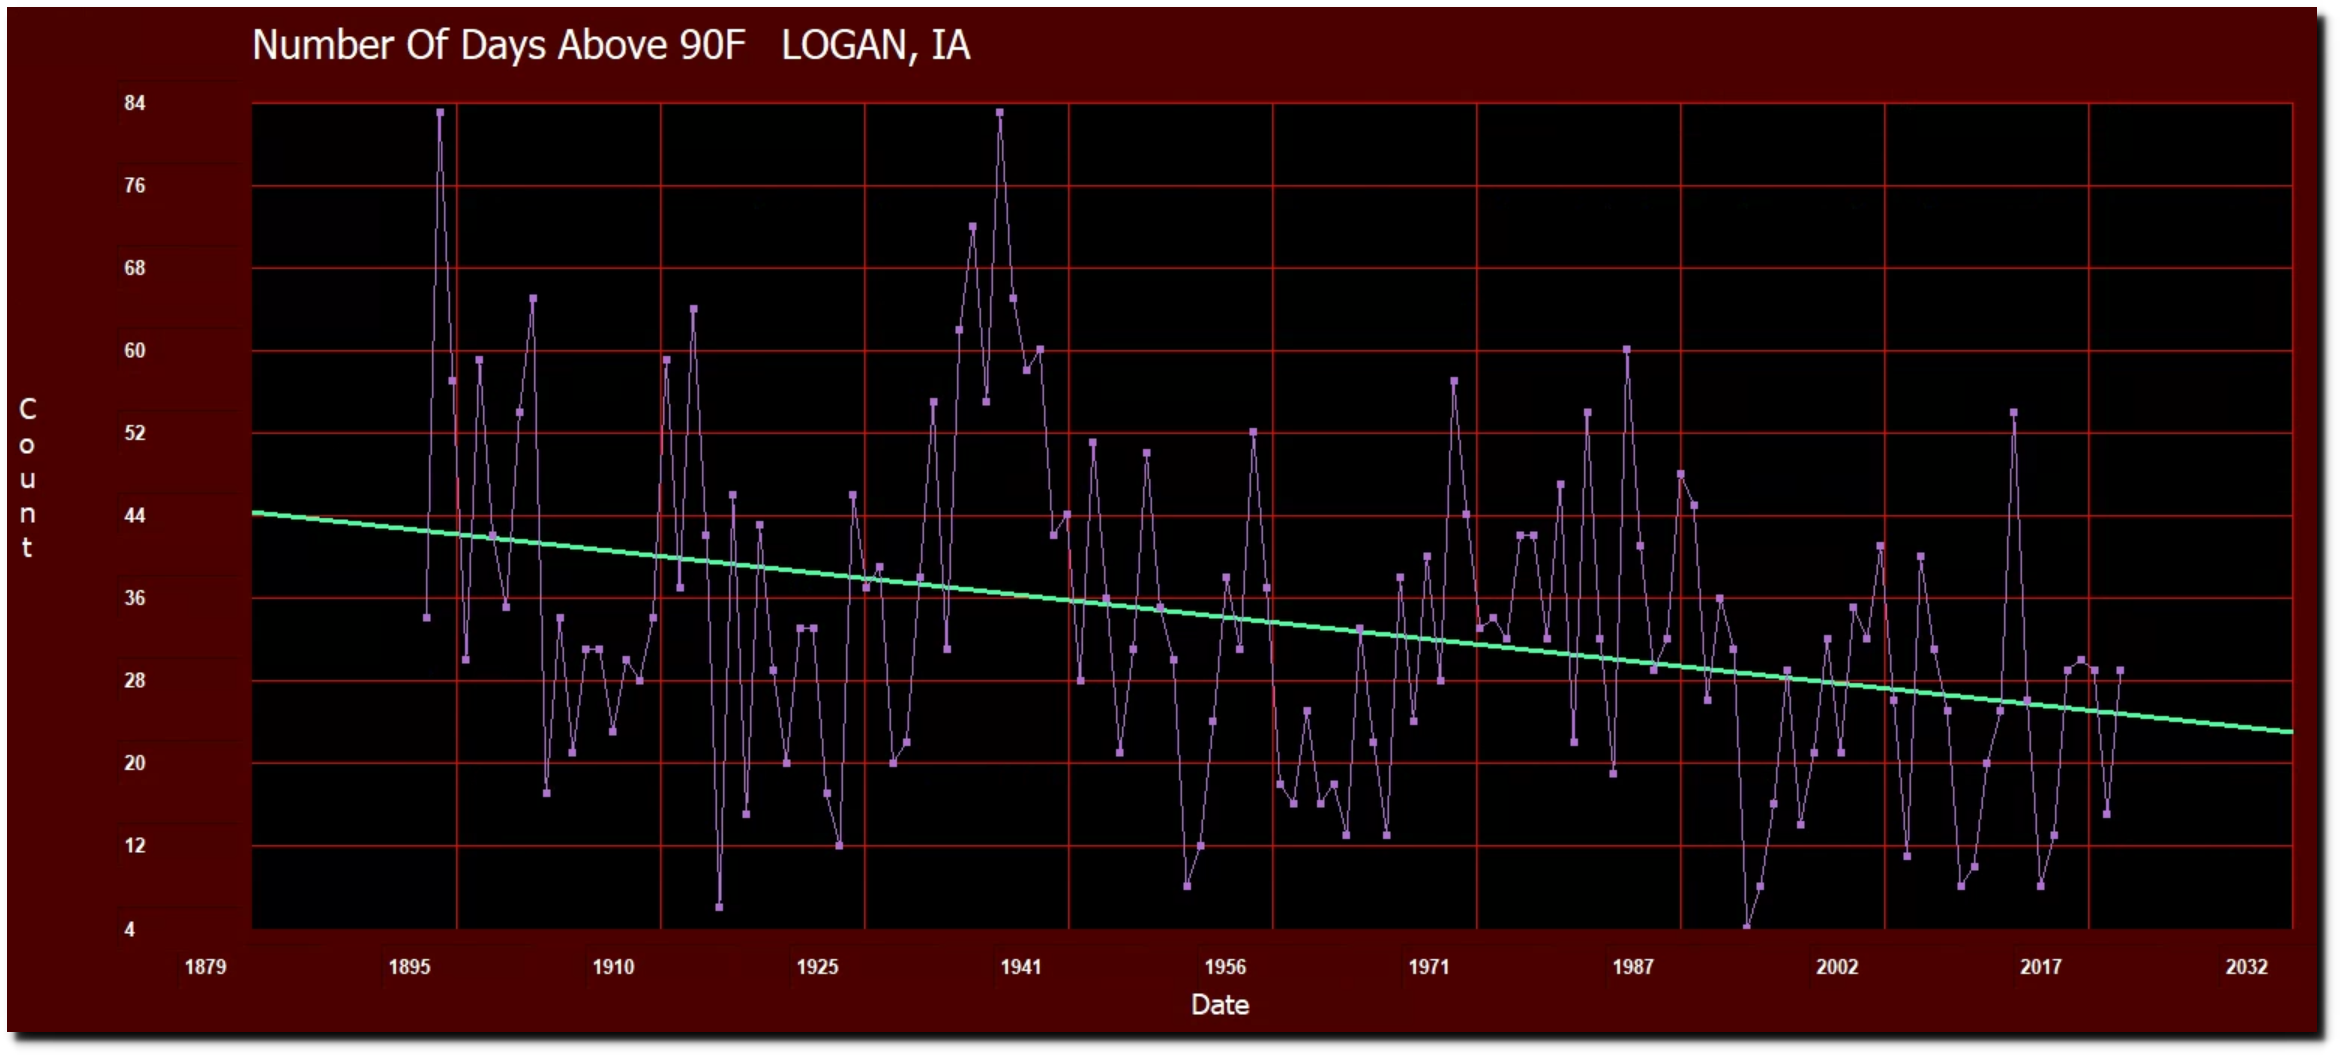
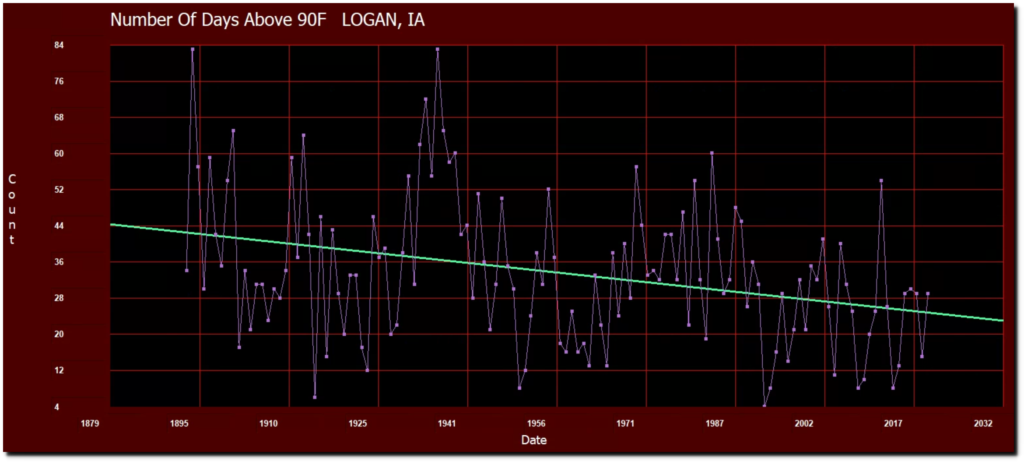
The closest currently operational USHCN station to Omaha is at Logan, Iowa. The number of 90 degree days there peaked in 1894 and 1936 (83) and have been declining sharply ever since.
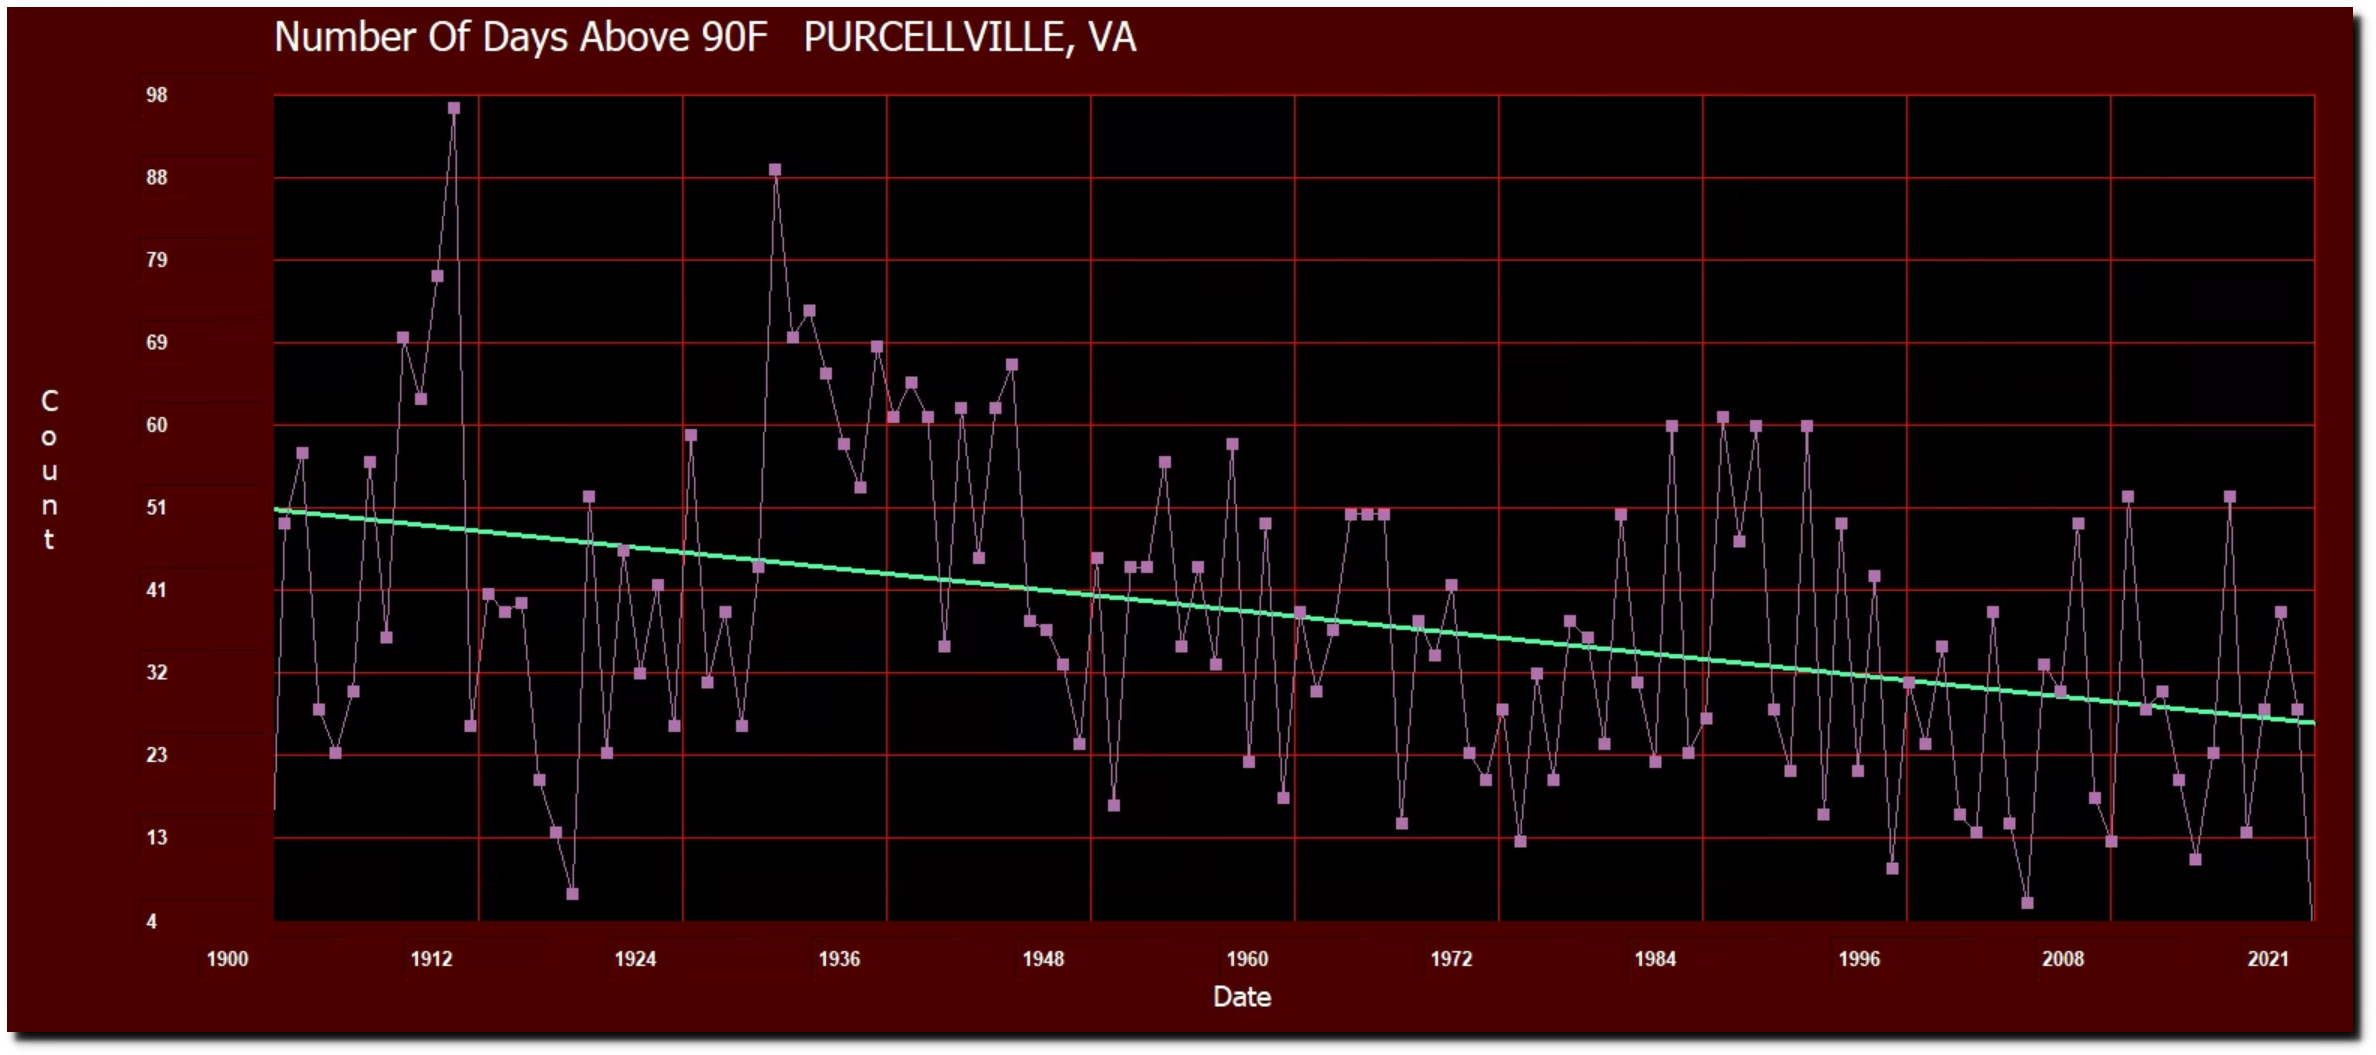
The closest currently operational USHCN station in Virginia to Washington DC is at Purcellville.  The number of 90 degree days there peaked in 1911 (96) and 1930 (89) and have been declining sharply ever since.
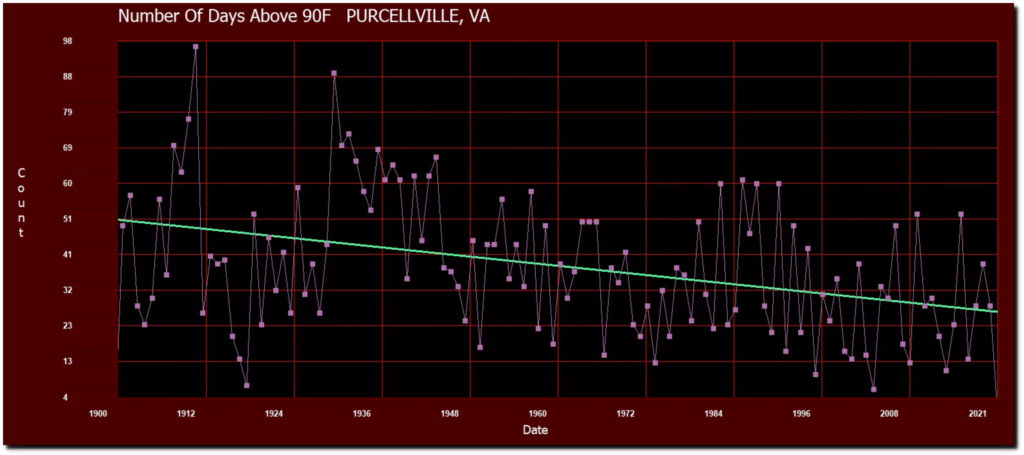
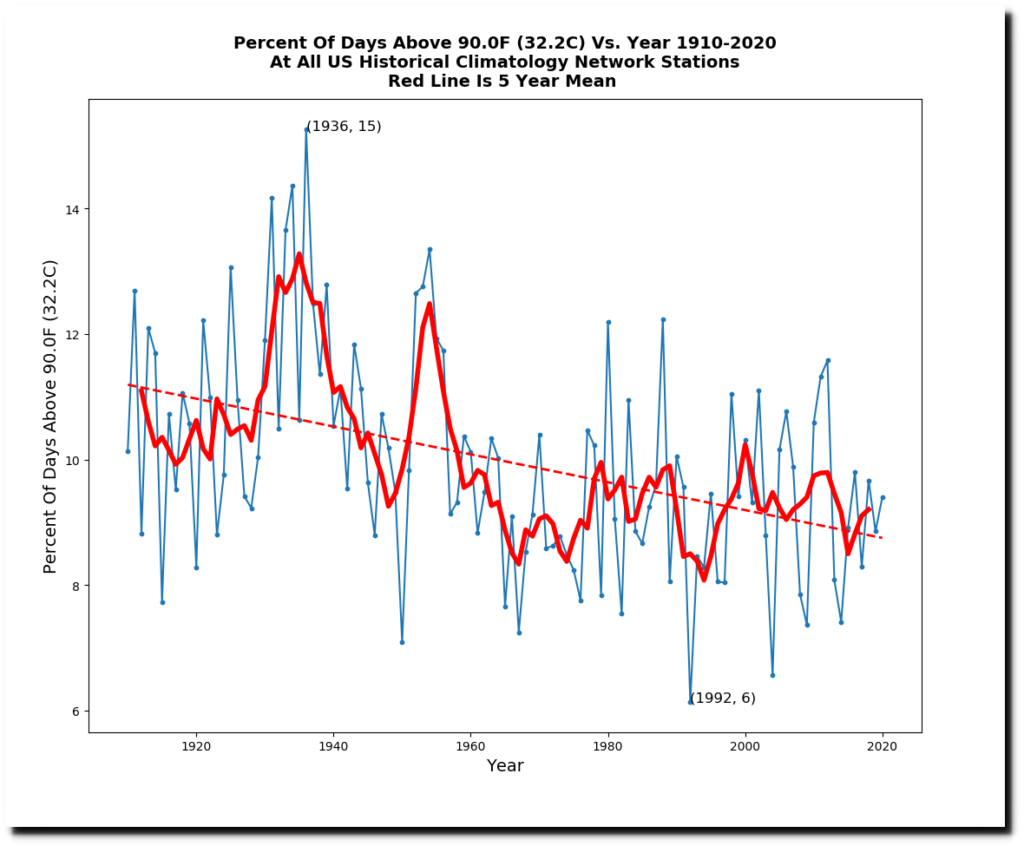
For the entire US, the frequency of 90 degree days has dropped sharply over the past century. Hansen got that exactly backwards.
In 1988, Hansen predicted a large increase in droughts.

“Dr. James E. Hansen, director of the Goddard Institute for Space Studies, who presented recent data compiled from computer models, said that predicted regional effects of global warming show that the chances of summer drought in the low and middle latitudes would be 1 in 3 by the year 2030, as against 1 in 20 in the 1950’s.”
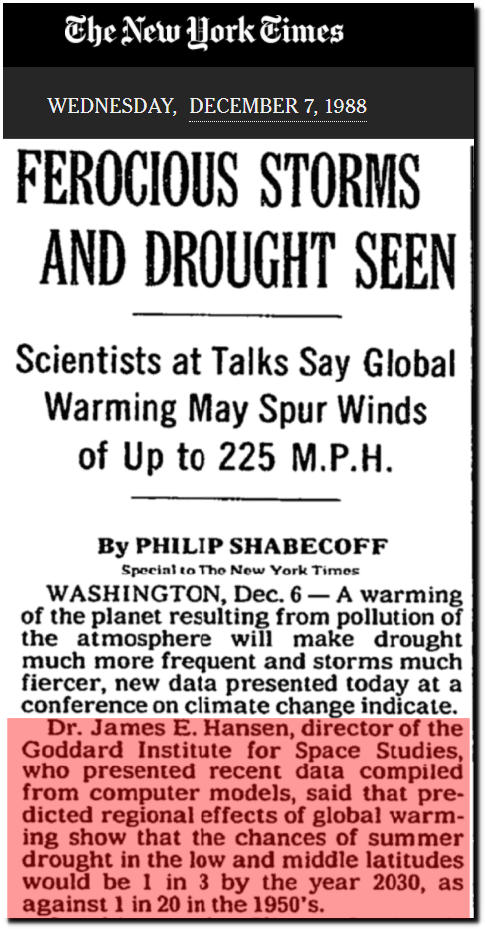
FEROCIOUS STORMS AND DROUGHT SEEN – The New York Times

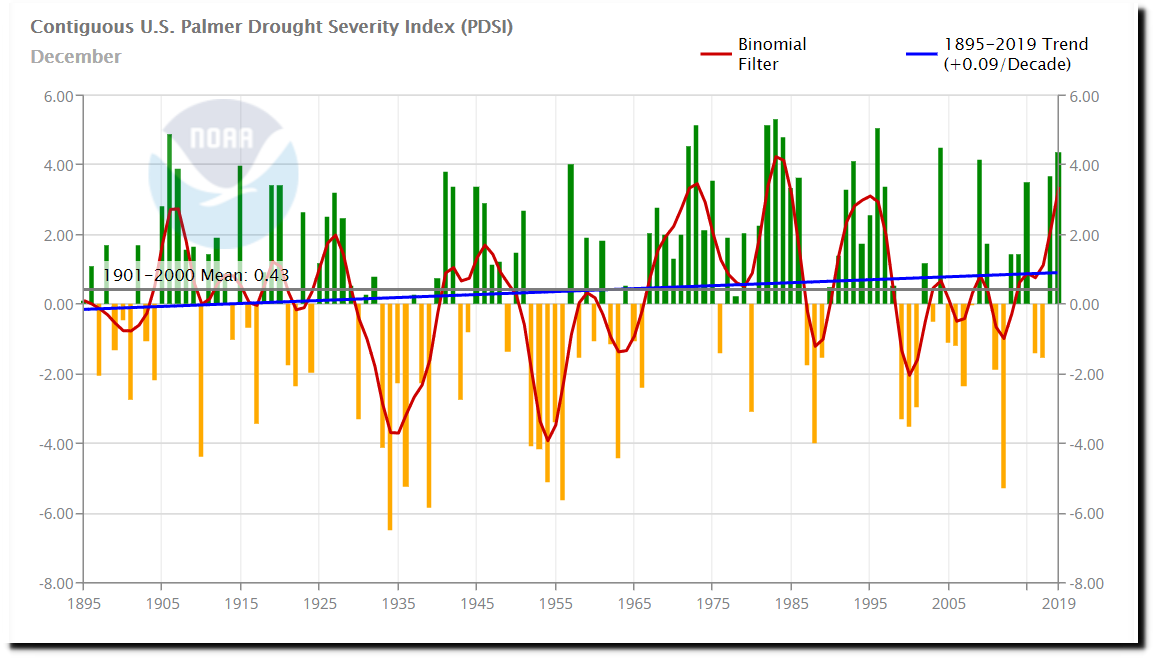
During the 1950’s the US was in drought most of the time, but droughts have been much less common over the past 60 years. Hansen also got that exactly backwards.
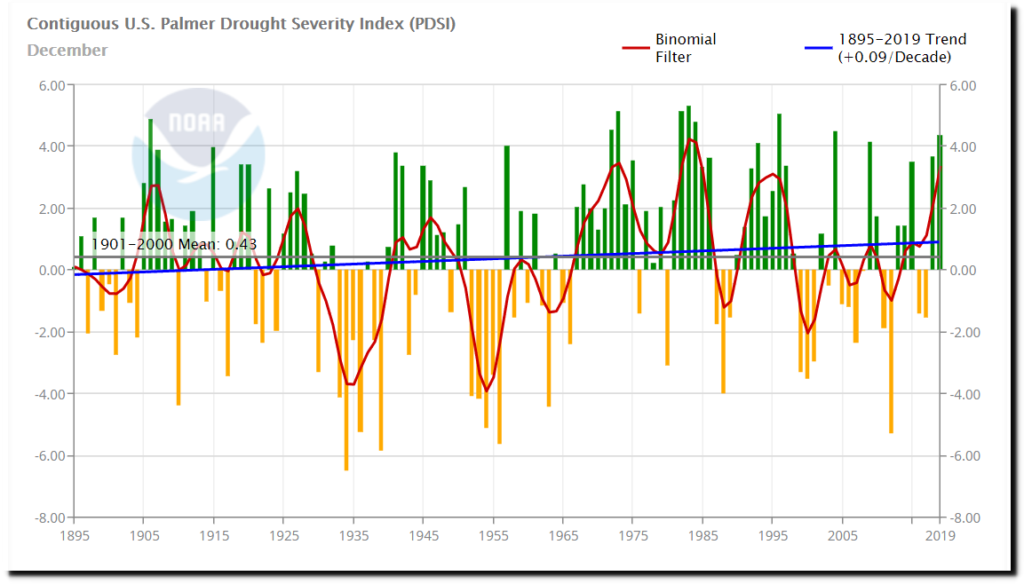
Climate at a Glance | National Centers for Environmental Information (NCEI)

One year after Hansen made his forecasts, scientists at NOAA set the record straight.

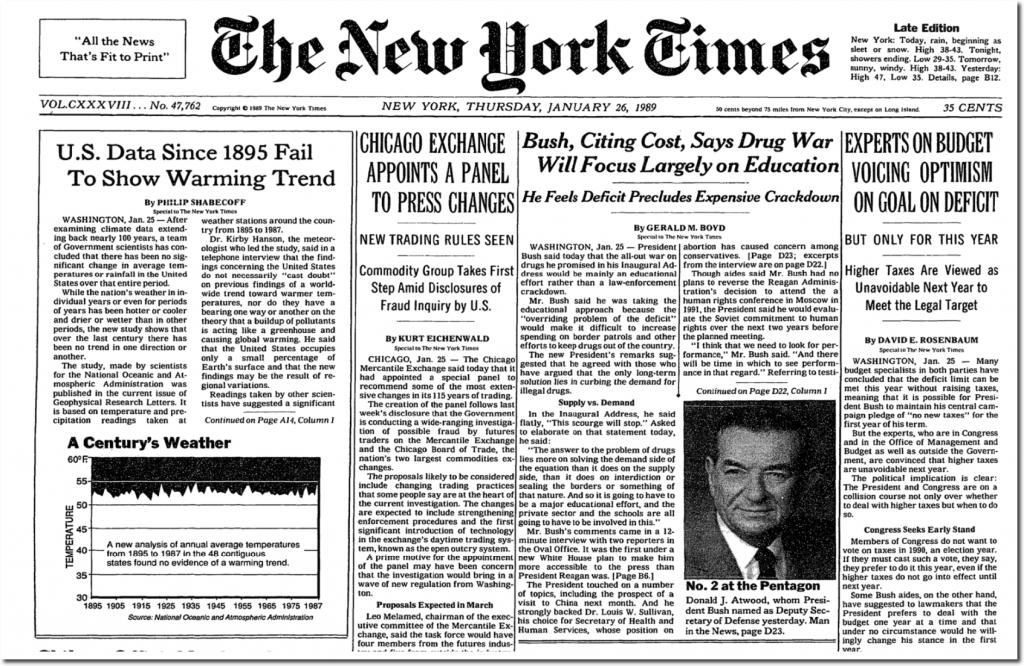
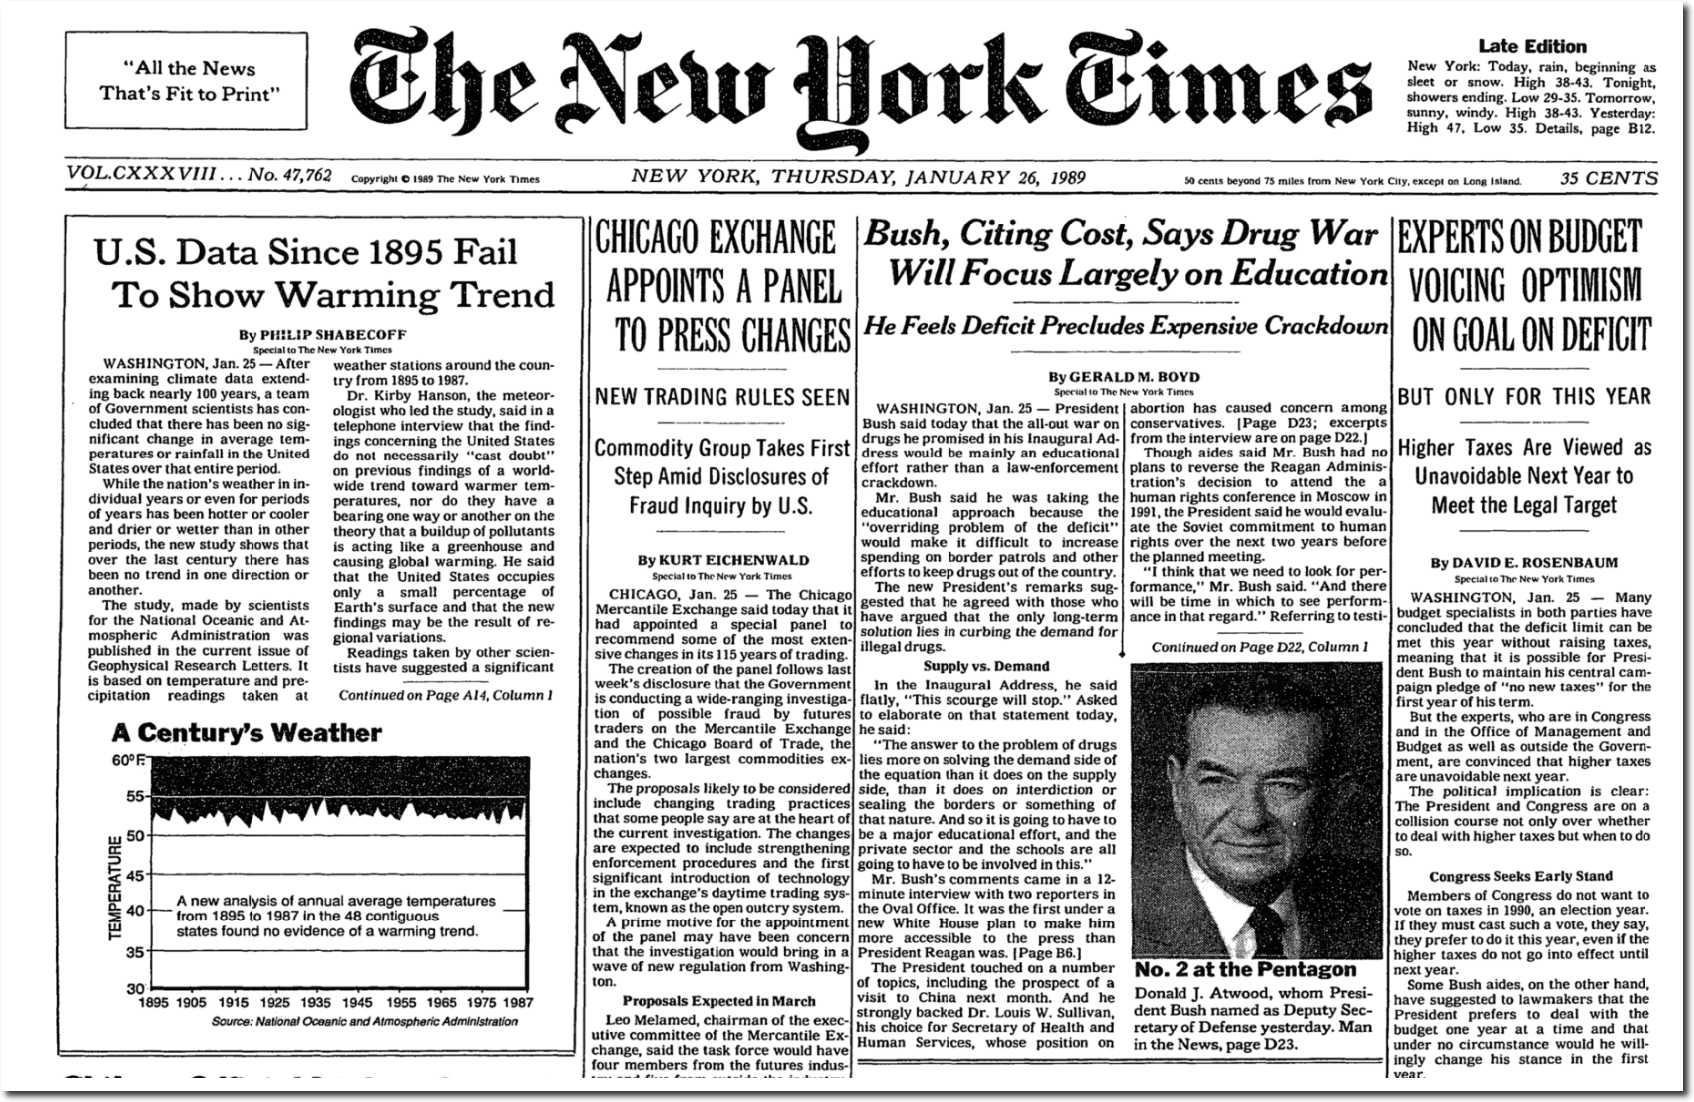
U.S. Data Since 1895 Fail To Show Warming Trend

“After examining climate data extending back nearly 100 years, a team of Government scientists has concluded that there has been no significant change in average temperatures or rainfall in the United States over that entire period.

While the nation’s weather in individual years or even for periods of years has been hotter or cooler and drier or wetter than in other periods, the new study shows that over the last century there has been no trend in one direction or another.

The study, made by scientists for the National Oceanic and Atmospheric Administration was published in the current issue of Geophysical Research Letters. It is based on temperature and precipitation readings taken at weather stations around the country from 1895 to 1987.”
U.S. Data Since 1895 Fail To Show Warming Trend – NYTimes.com

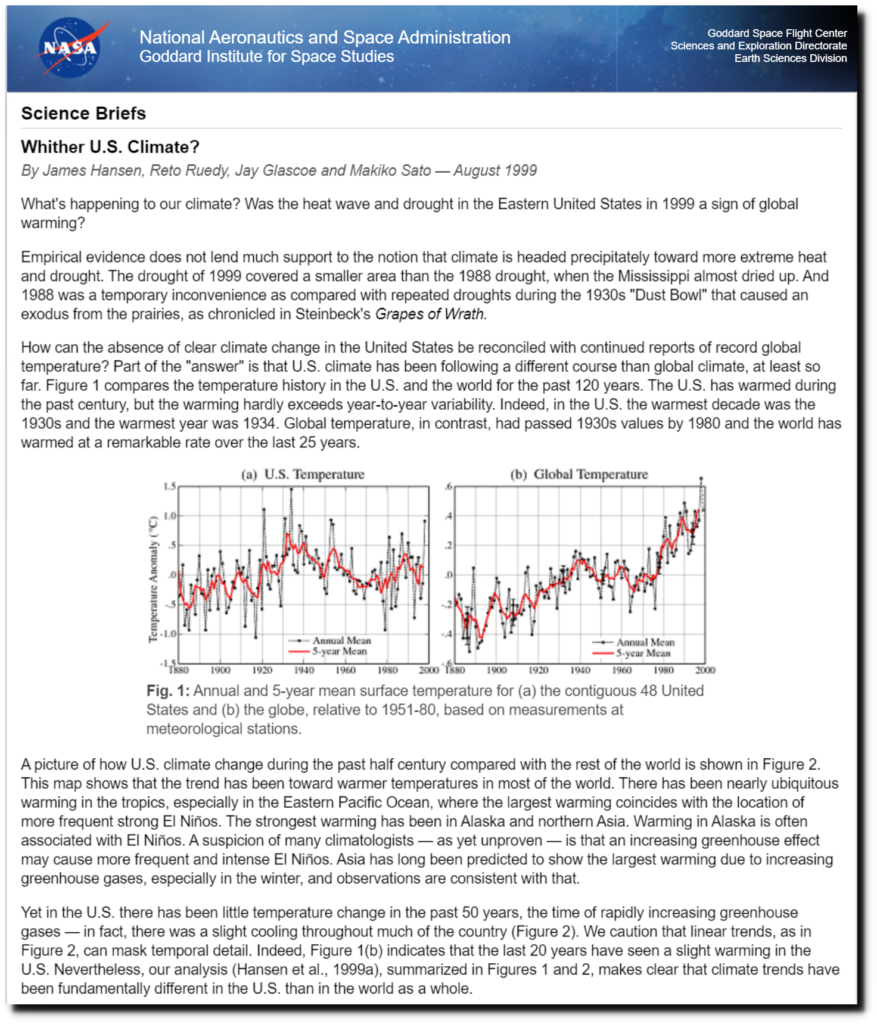
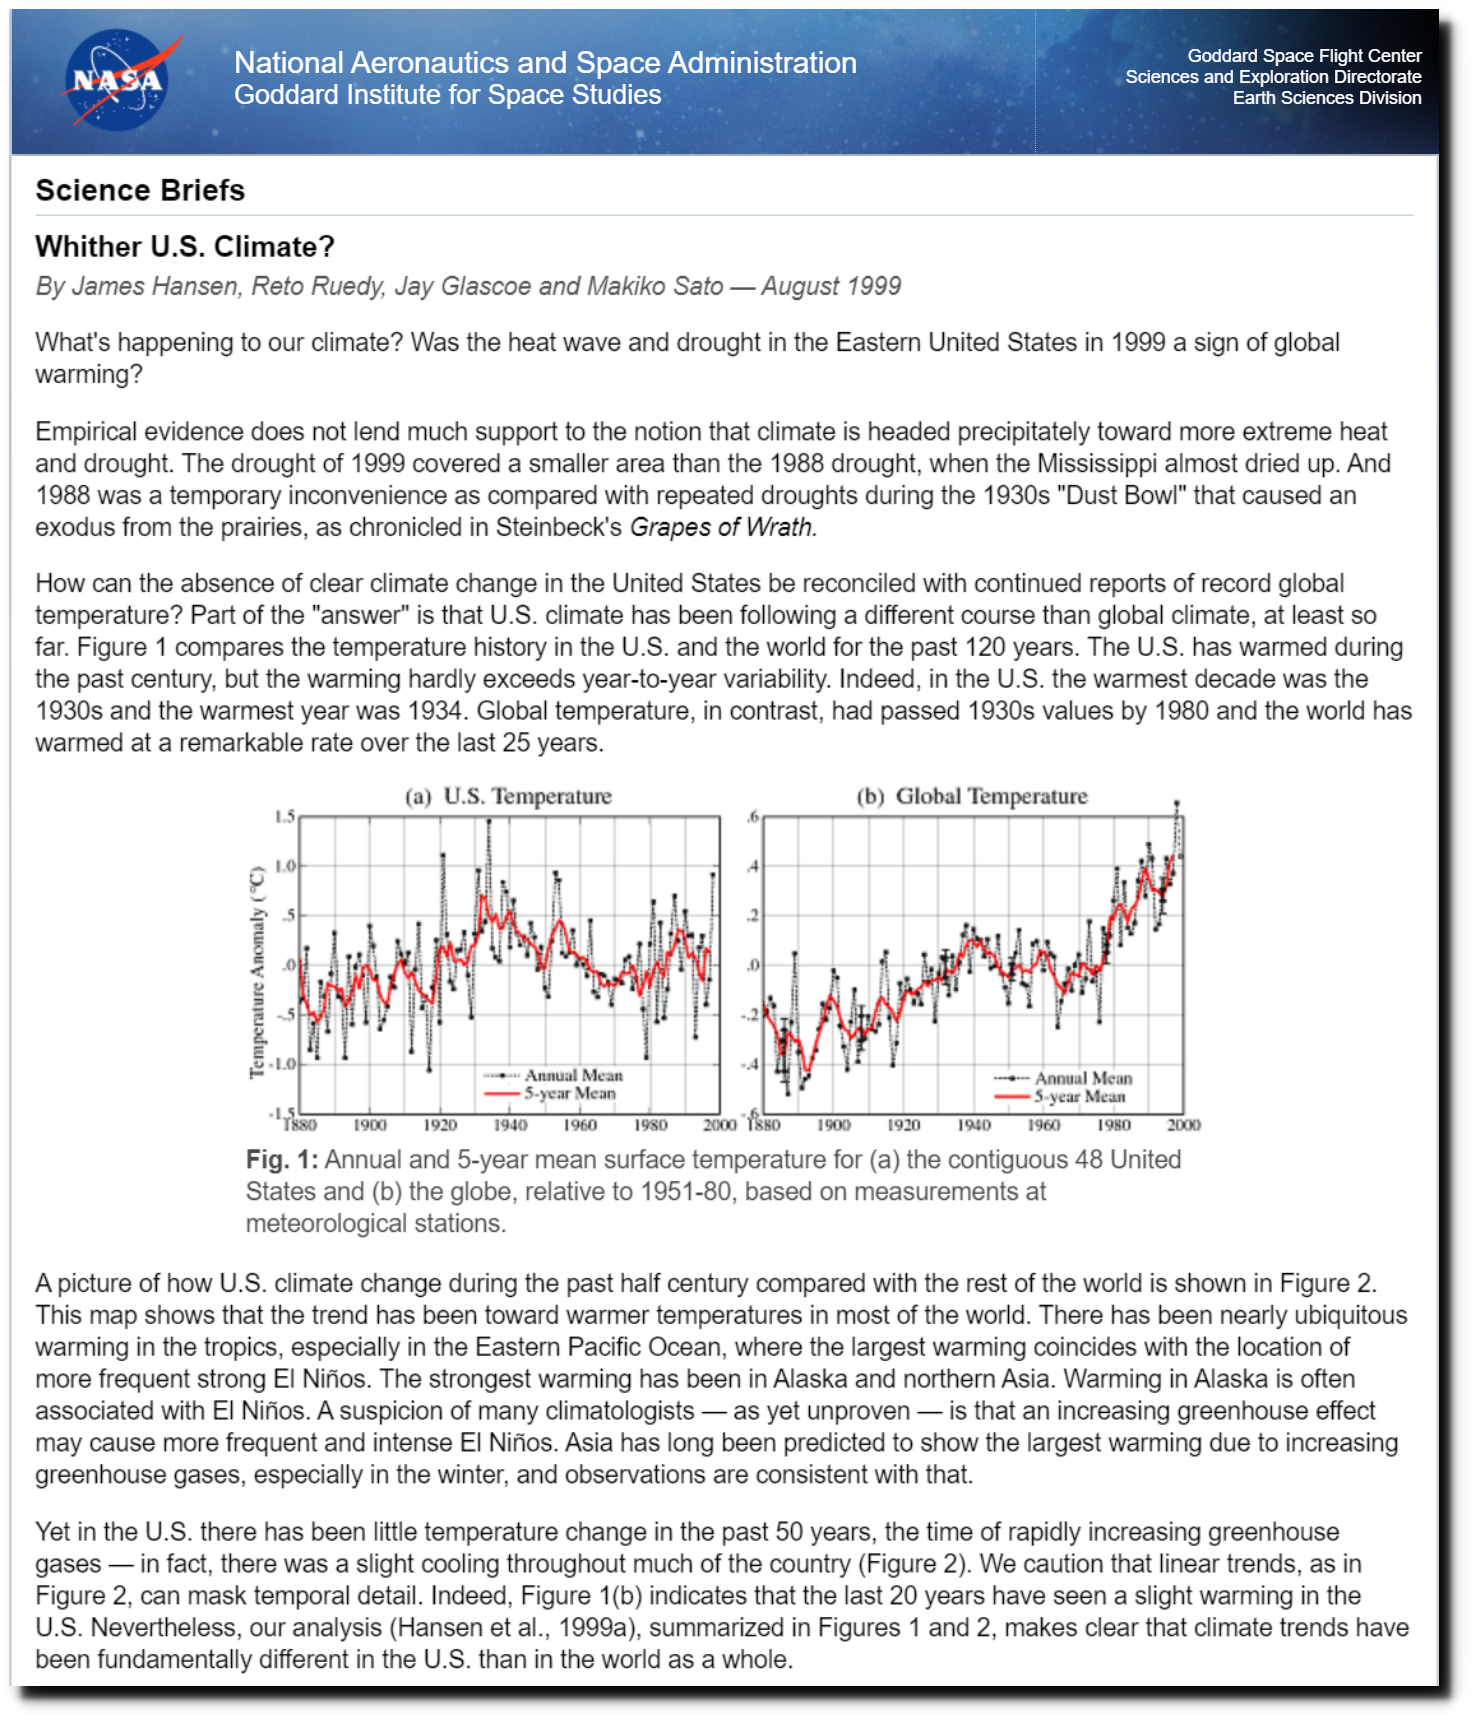
Ten years later, Hansen was upset that the US wasn’t warming as he predicted and the droughts weren’t occurring.

Empirical evidence does not lend much support to the notion that climate is headed precipitately toward more extreme heat and drought. The drought of 1999 covered a smaller area than the 1988 drought, when the Mississippi almost dried up. And 1988 was a temporary inconvenience as compared with repeated droughts during the 1930s “Dust Bowl” that caused an exodus from the prairies, as chronicled in Steinbeck’s Grapes of Wrath.

The U.S. has warmed during the past century, but the warming hardly exceeds year-to-year variability. Indeed, in the U.S. the warmest decade was the 1930s and the warmest year was 1934.
NASA GISS: Science Briefs: Whither U.S. Climate?

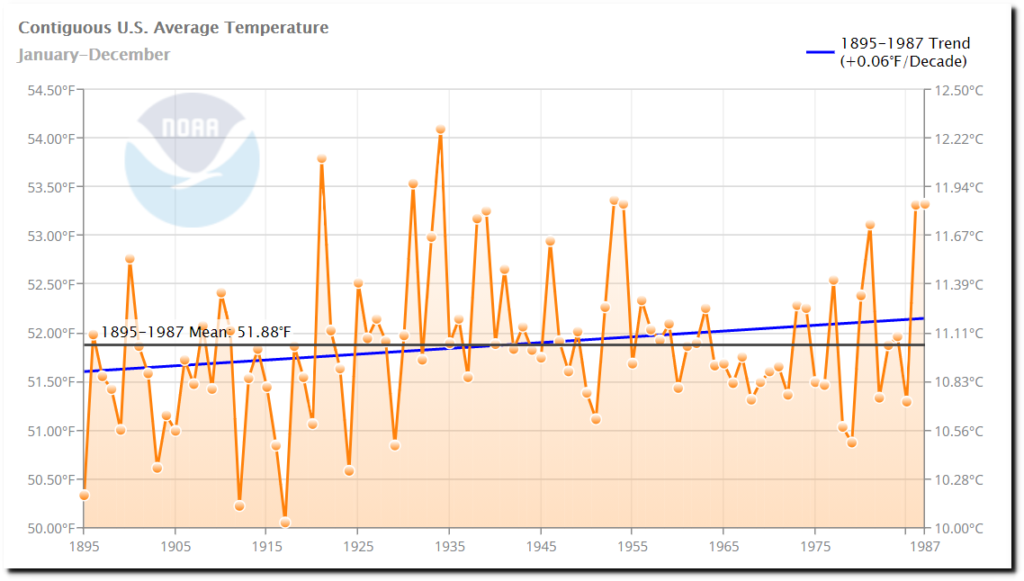
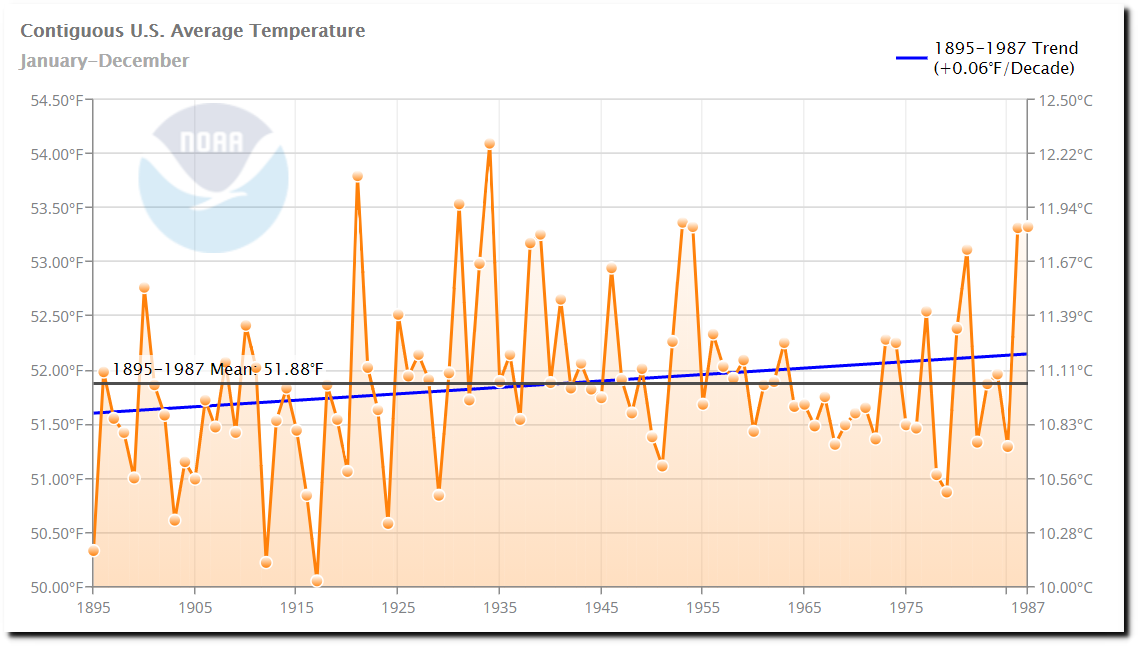
So Hansen and NOAA got together and altered the US temperature record. NOAA now shows a warming trend from 1895 to 1987.
Climate at a Glance | National Centers for Environmental Information (NCEI)

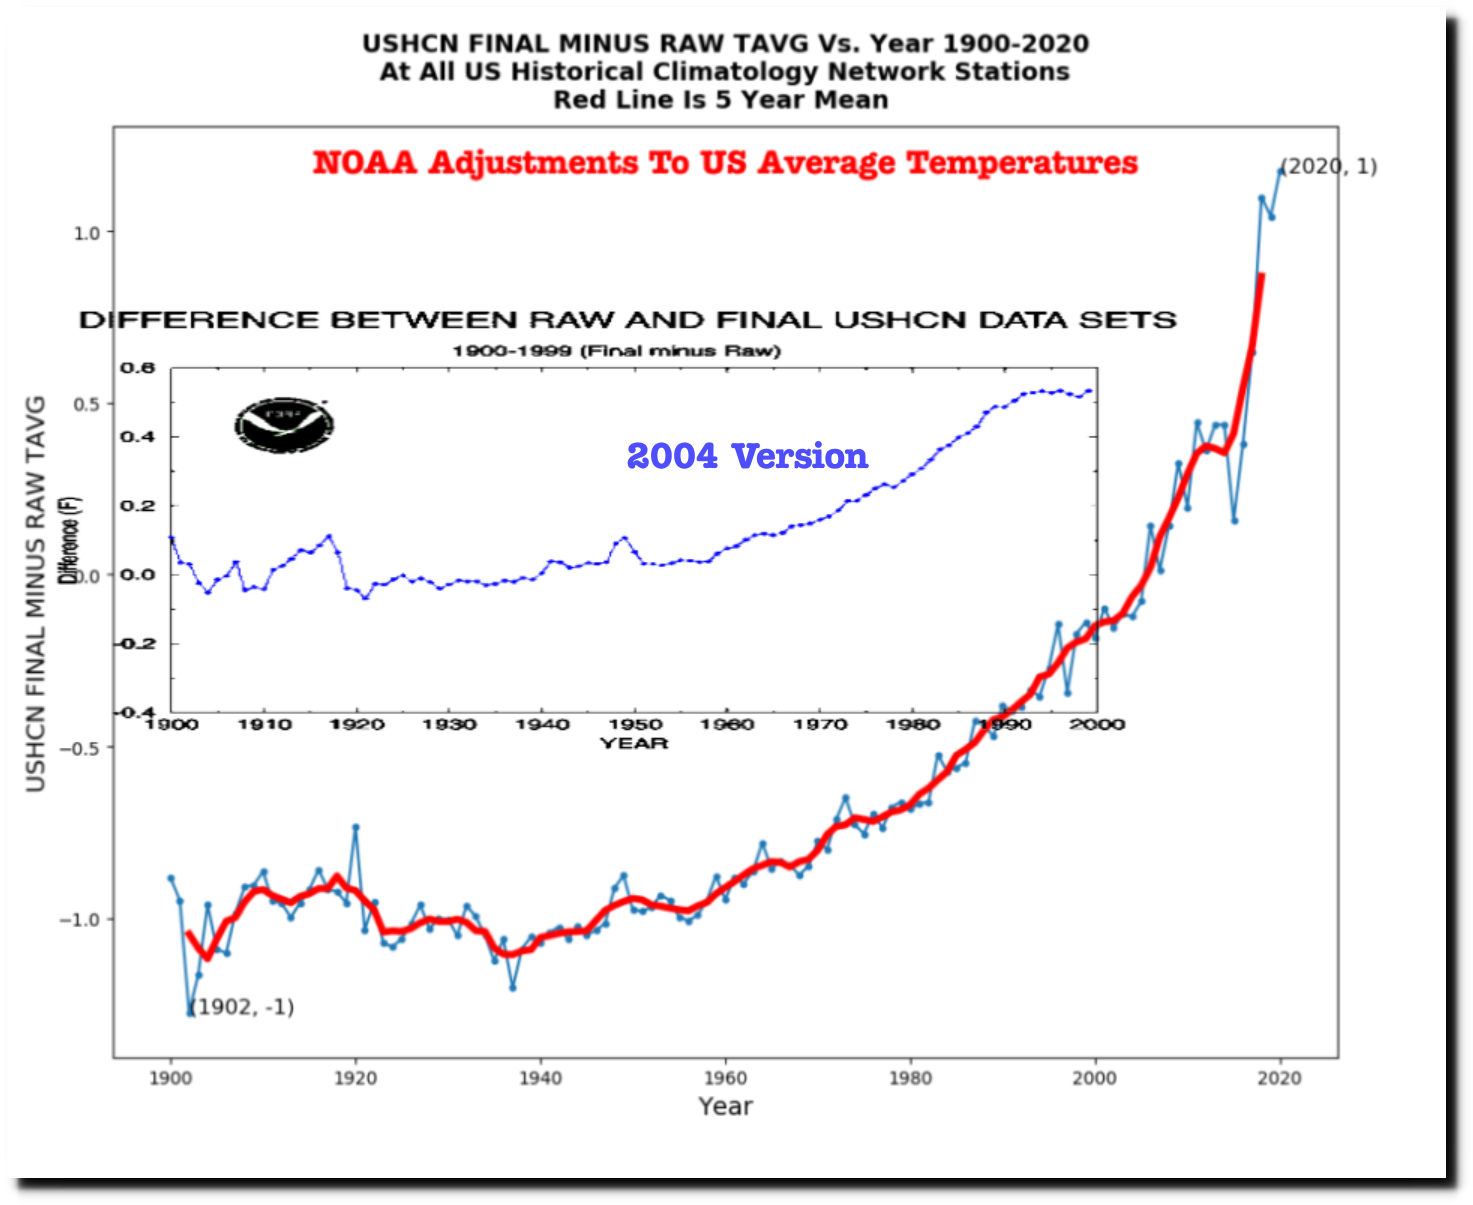
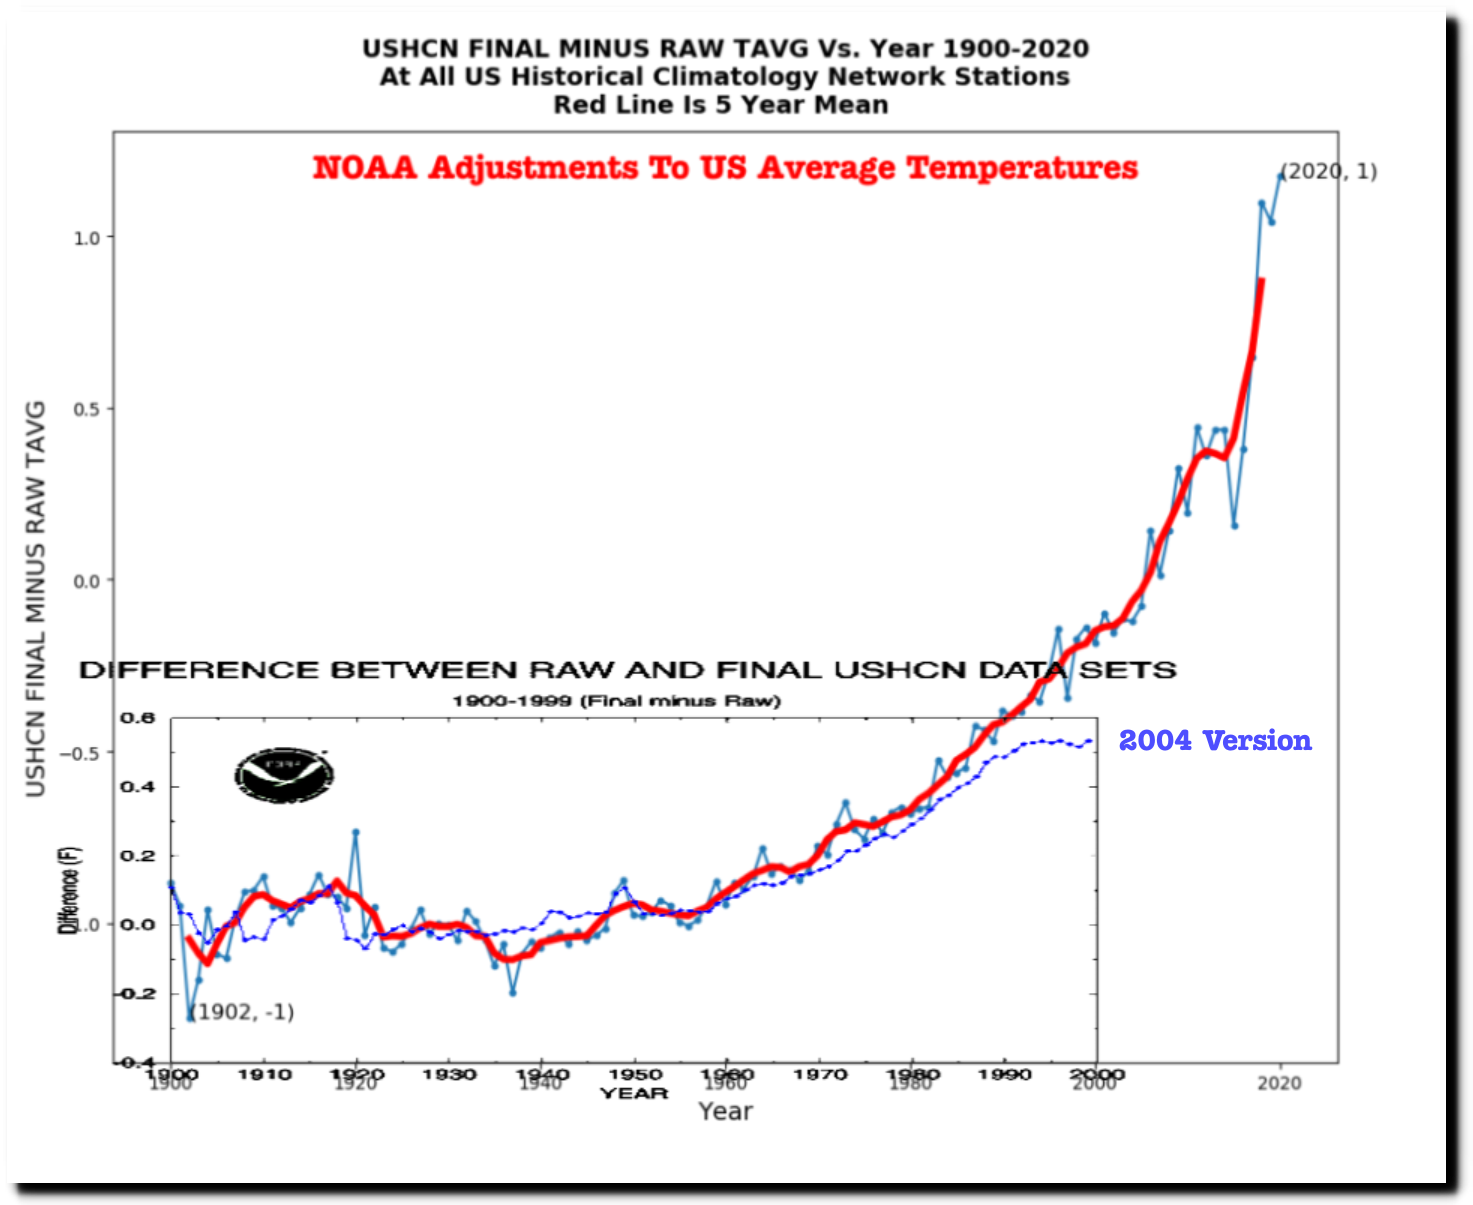
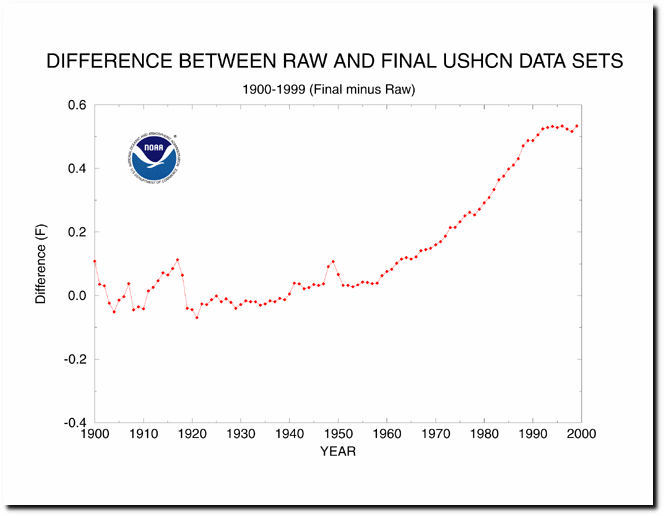
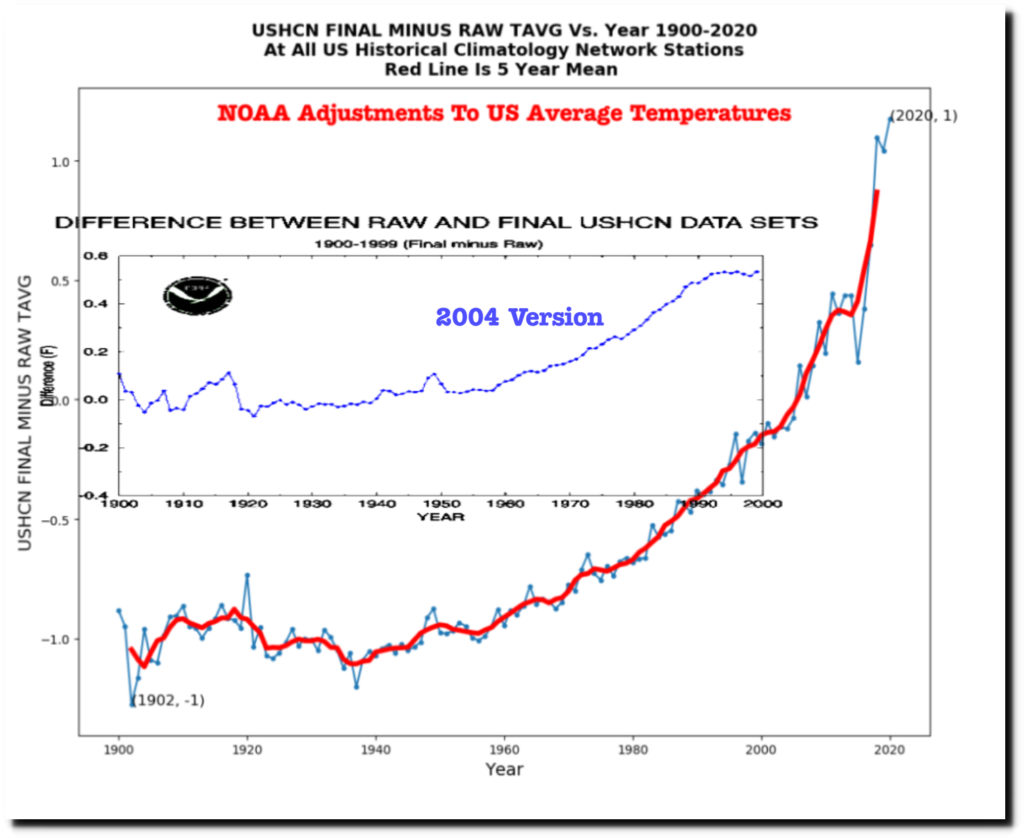
In 2004, NOAA showed that they were altering US temperatures by 0.5F since the year 1900, with no further charges after 1990.
Wayback Machine

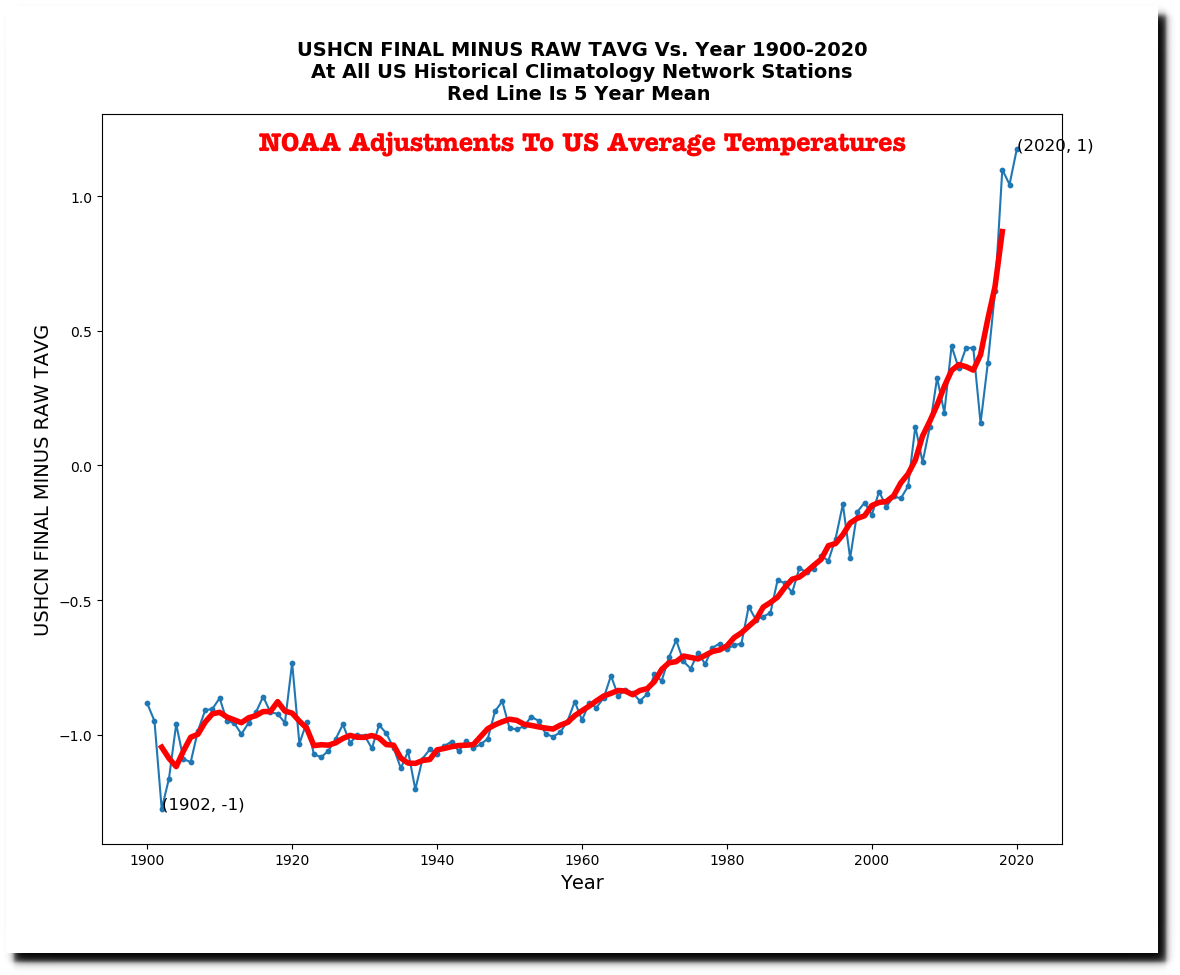
But now they are altering the data by more than two degrees Fahrenheit.
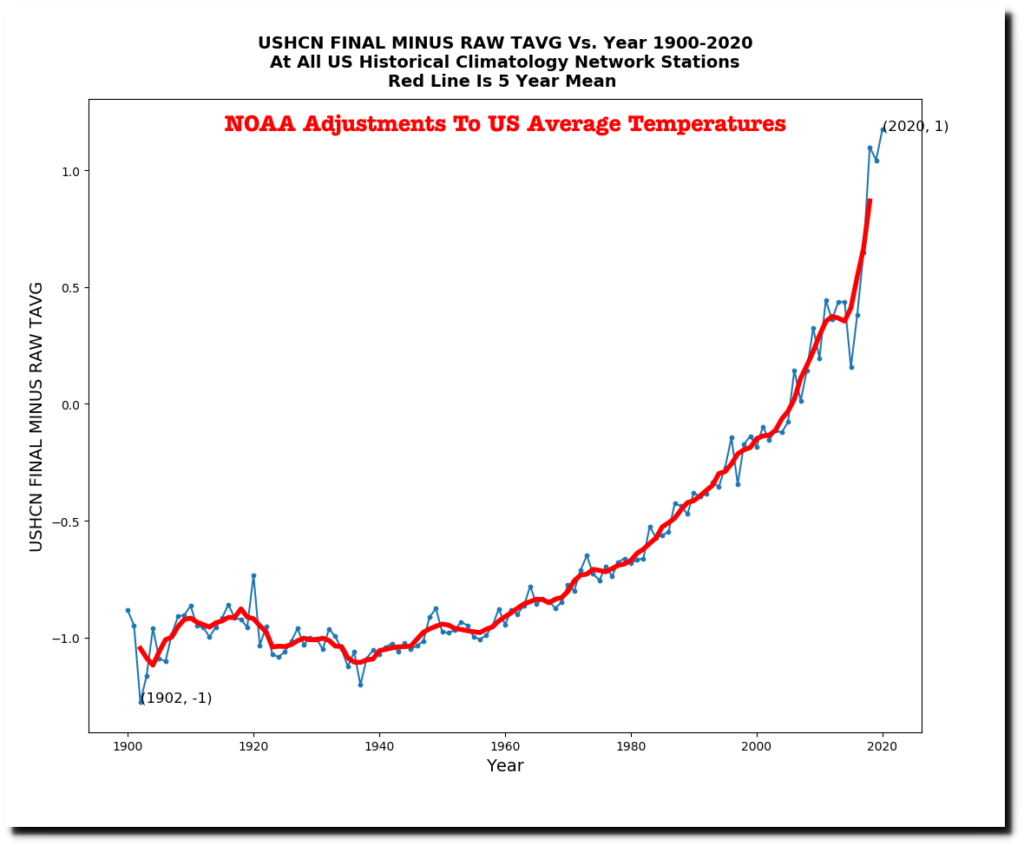
ftp://ftp.ncdc.noaa.gov/pub/data/ushcn/v2.5/

The graph below compares the 2004 adjustments in blue, to the current adjustments in red.
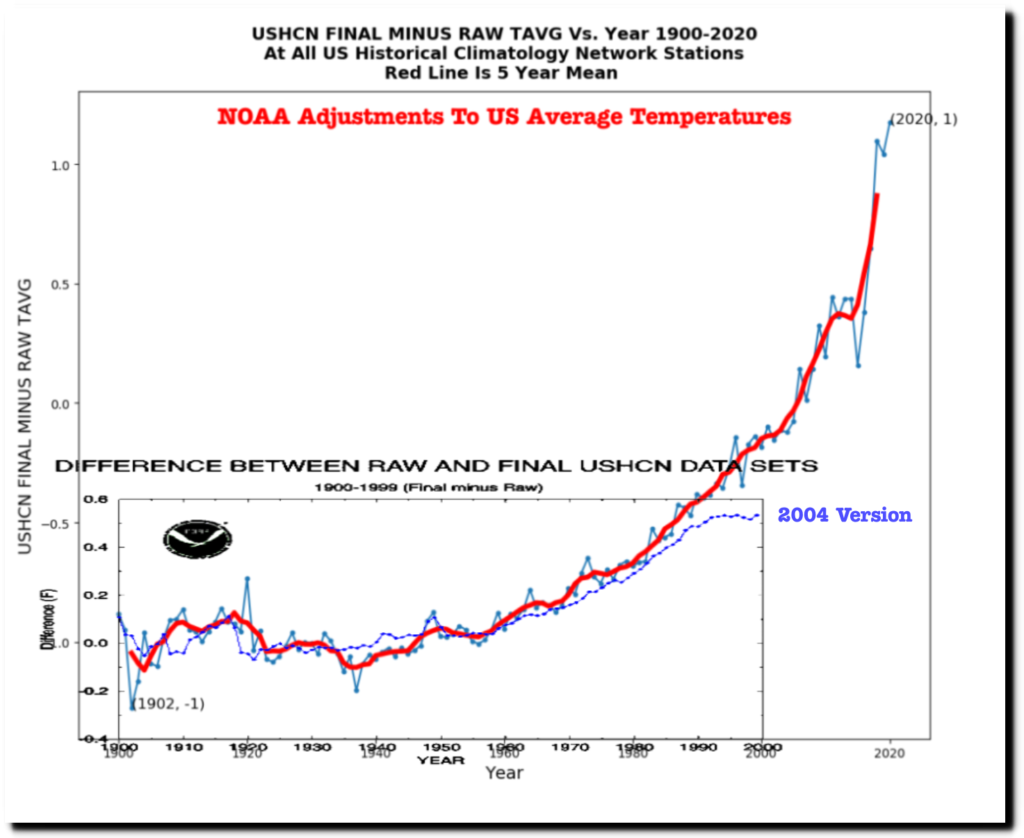
And the next graph normalizes the two sets of adjustments along the Y-Axis. There has been a huge increase in the amount of data tampering for years since 1990, which makes no sense because the data should be stabilizing after 1990, as in the 2004 version of the adjustments.
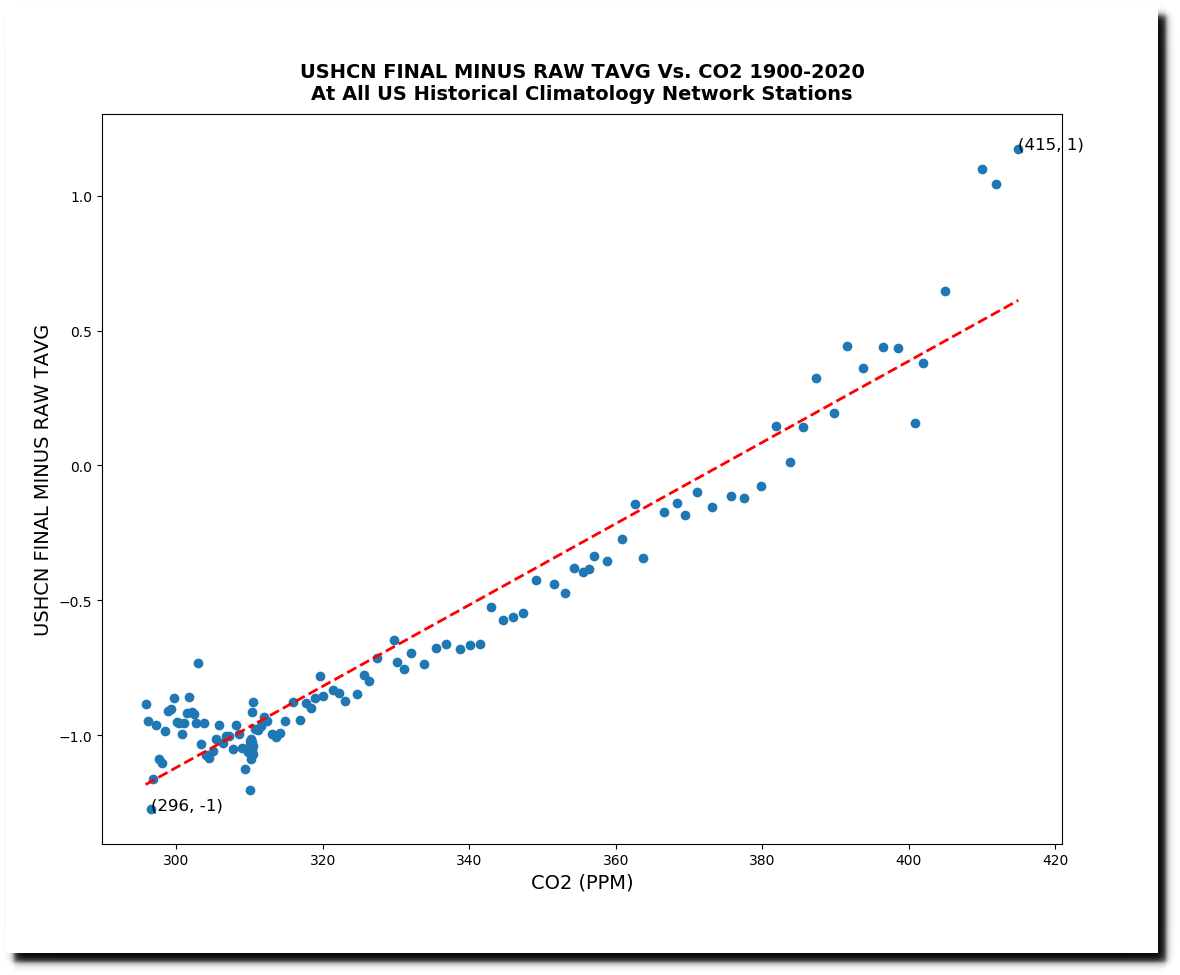
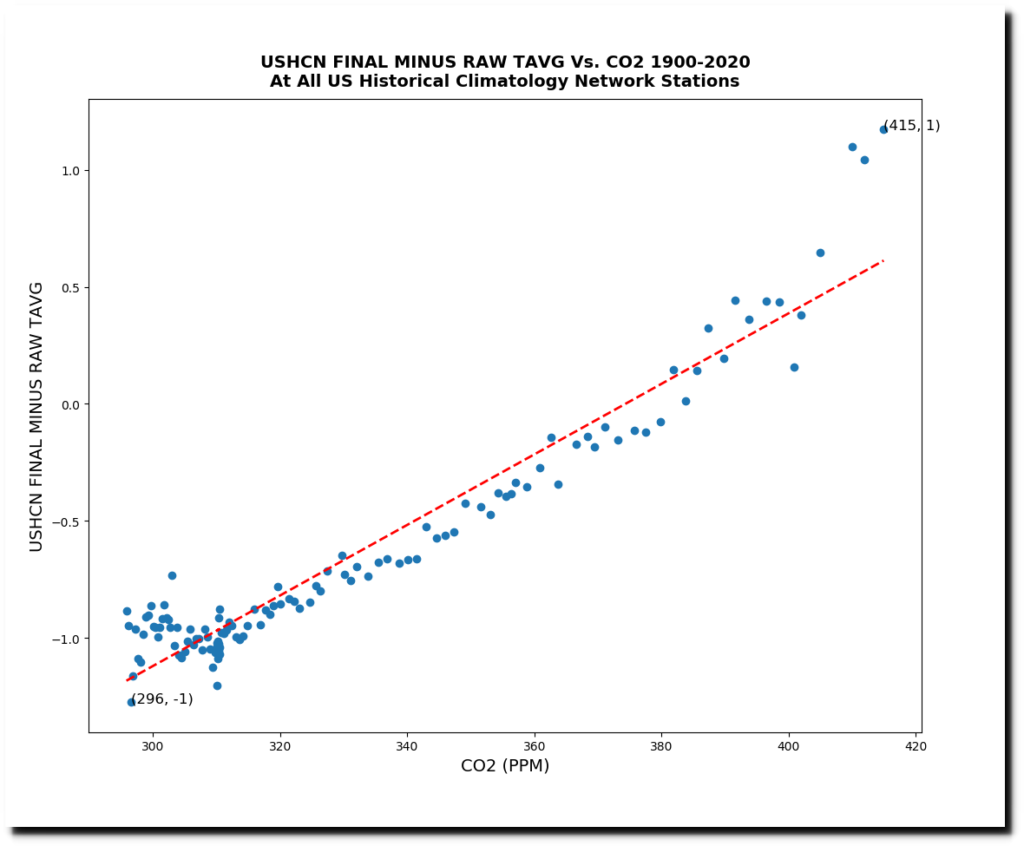
The NOAA adjustments trend very closely with the amount of carbon dioxide in the atmosphere, or at least they did until three years ago, when there was a huge increase in the amount of tampering. Data is being altered to match global warming theory.
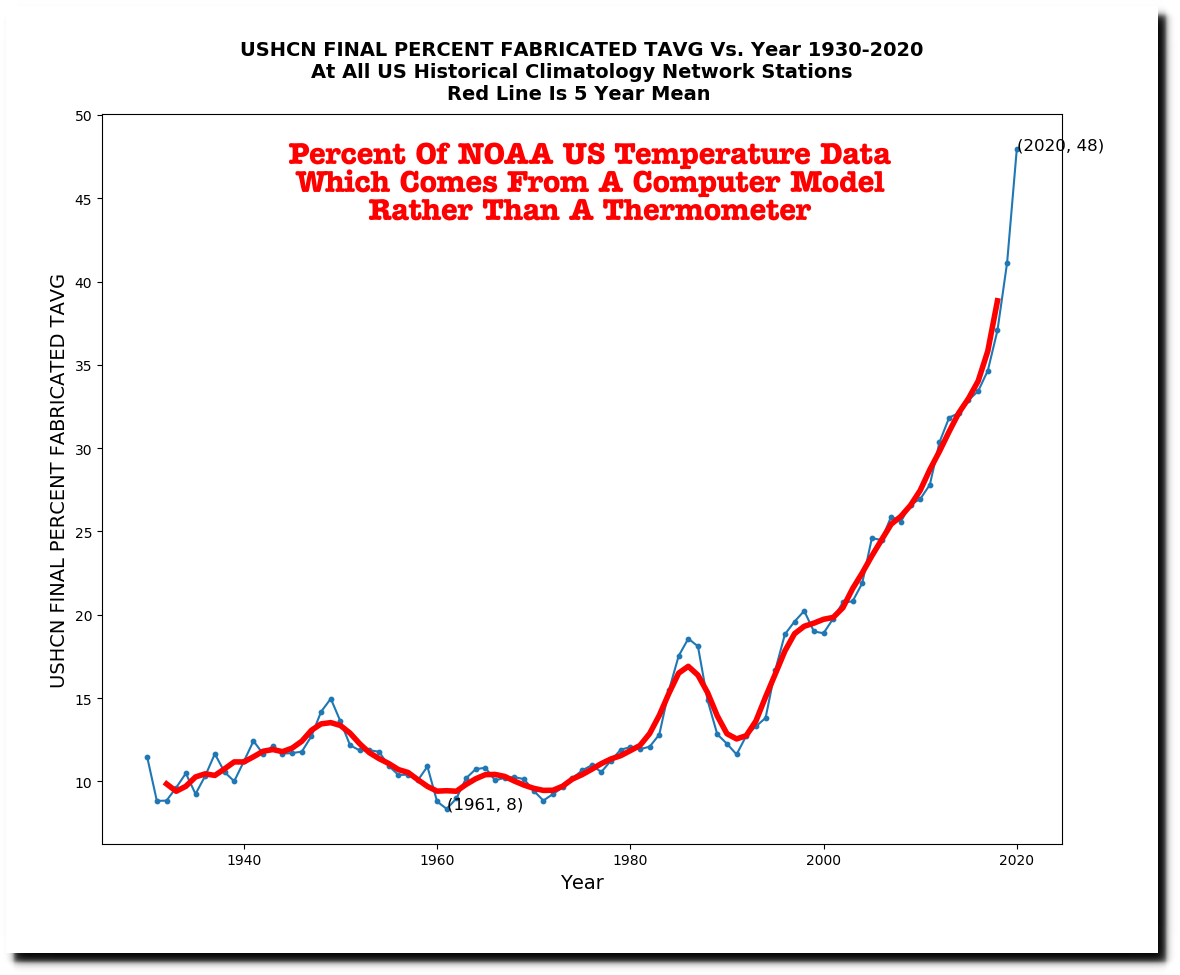
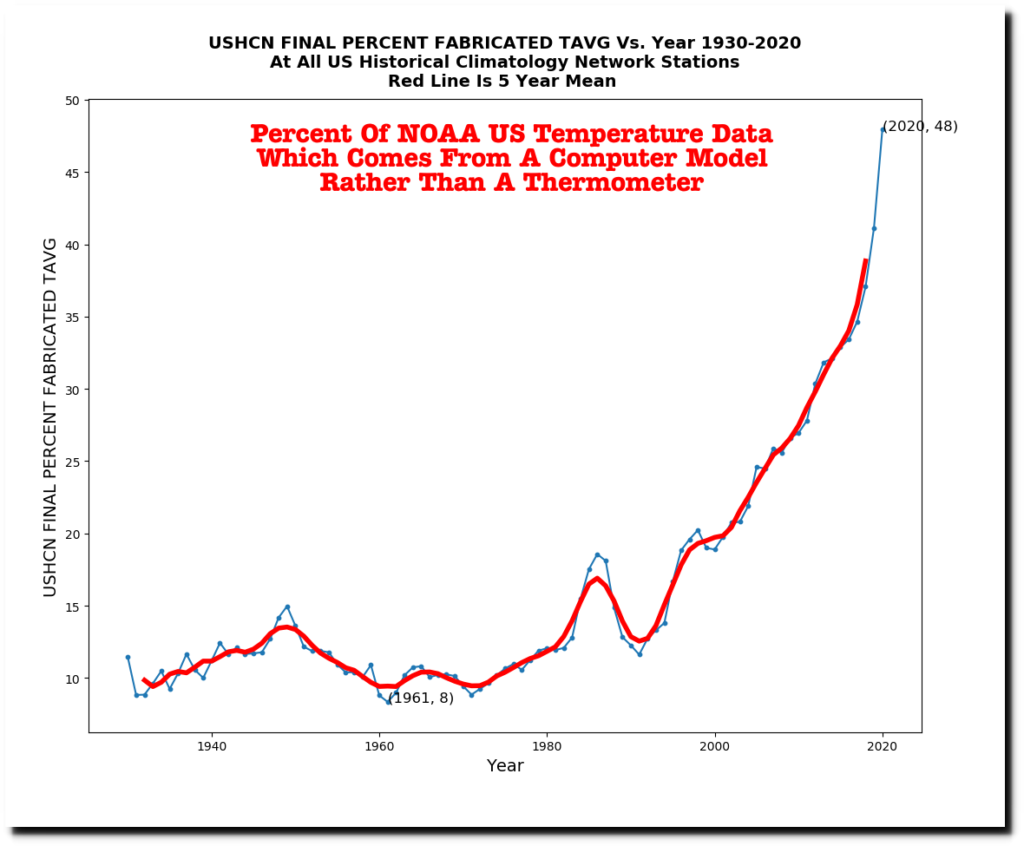
NOAA fabricates missing data using a computer model, and last year almost 50% of their monthly US temperature data was fabricated.
This is the data for Brewton, Alabama. If the data is estimated rather than measured, it is marked with an “E” – All twelve months of 2020 were marked with an E.

ftp://ftp.ncdc.noaa.gov/pub/data/ushcn/v2.5/ushcn.tavg.latest.FLs.52j.tar.gz

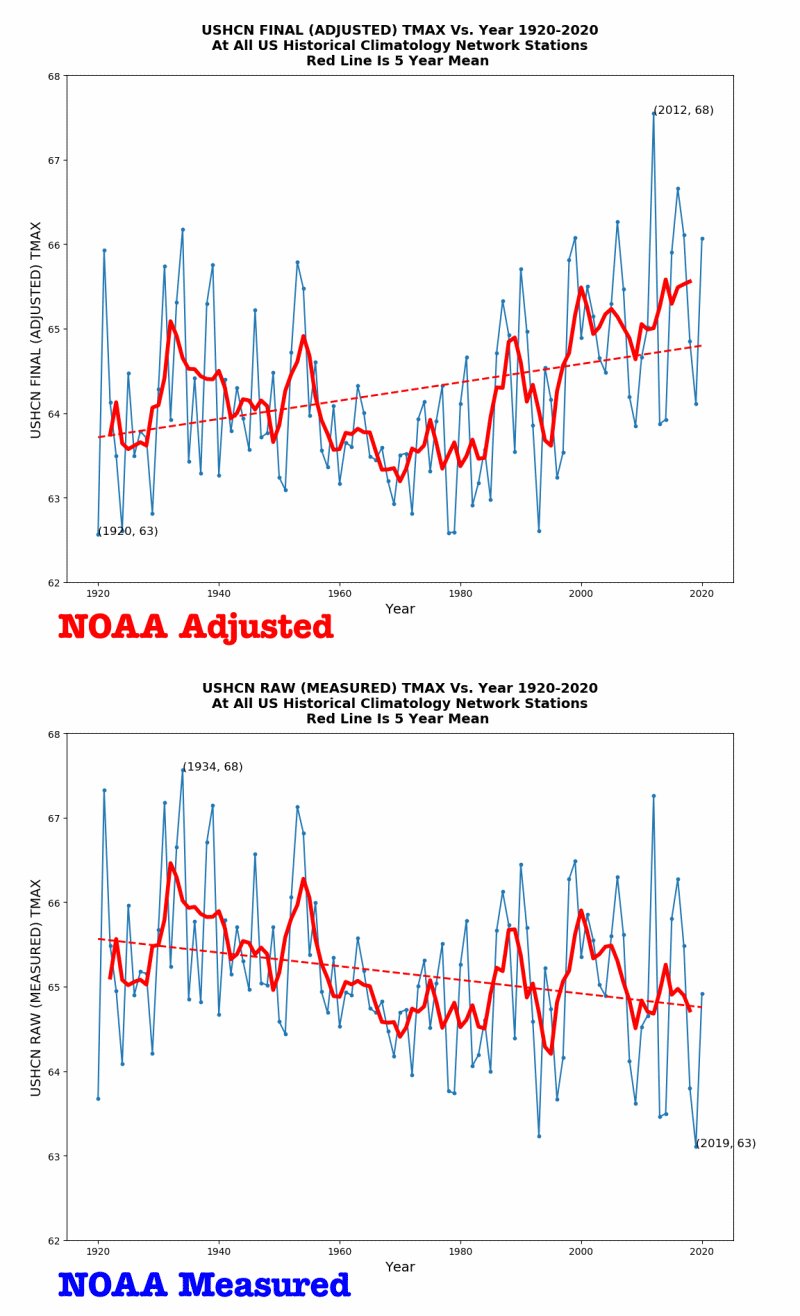
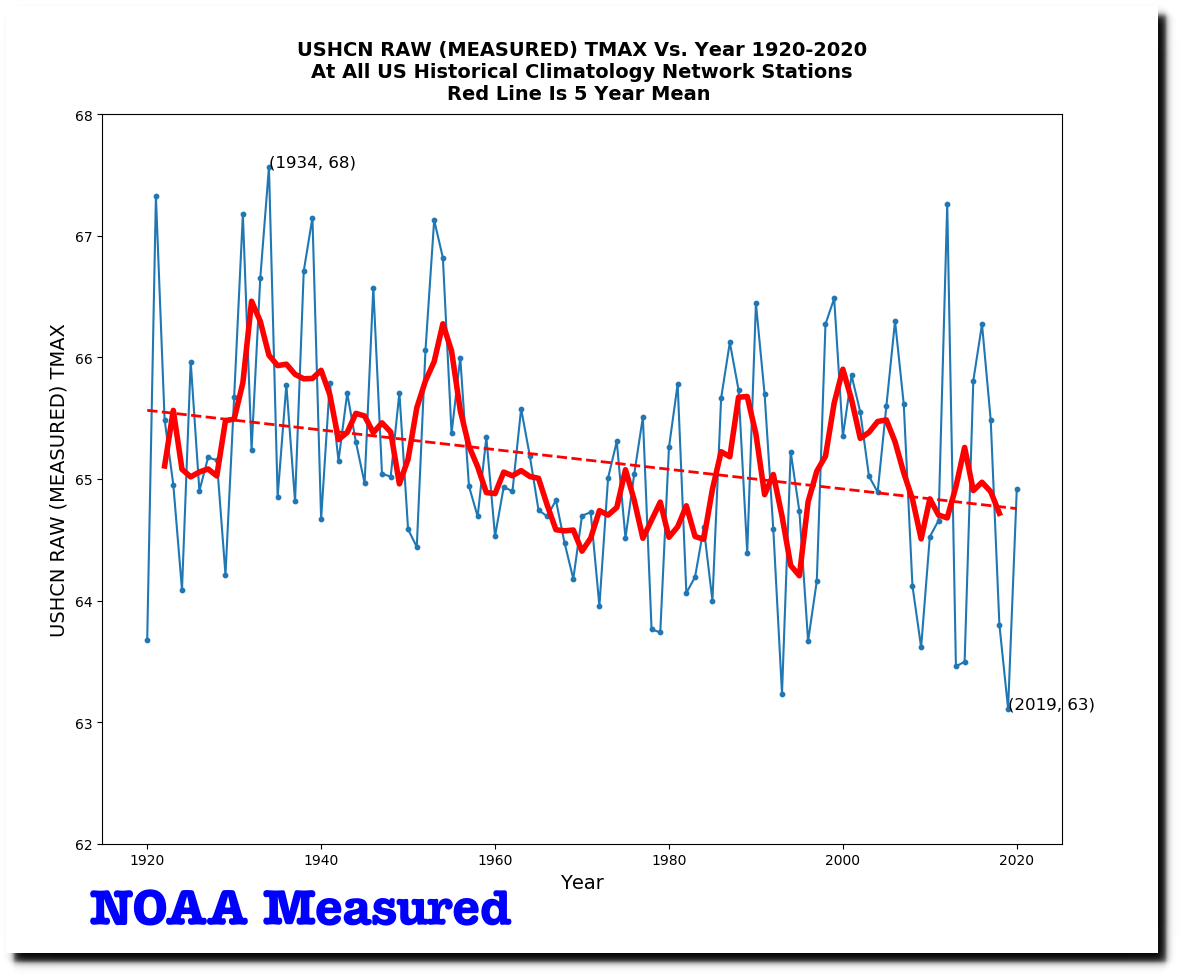
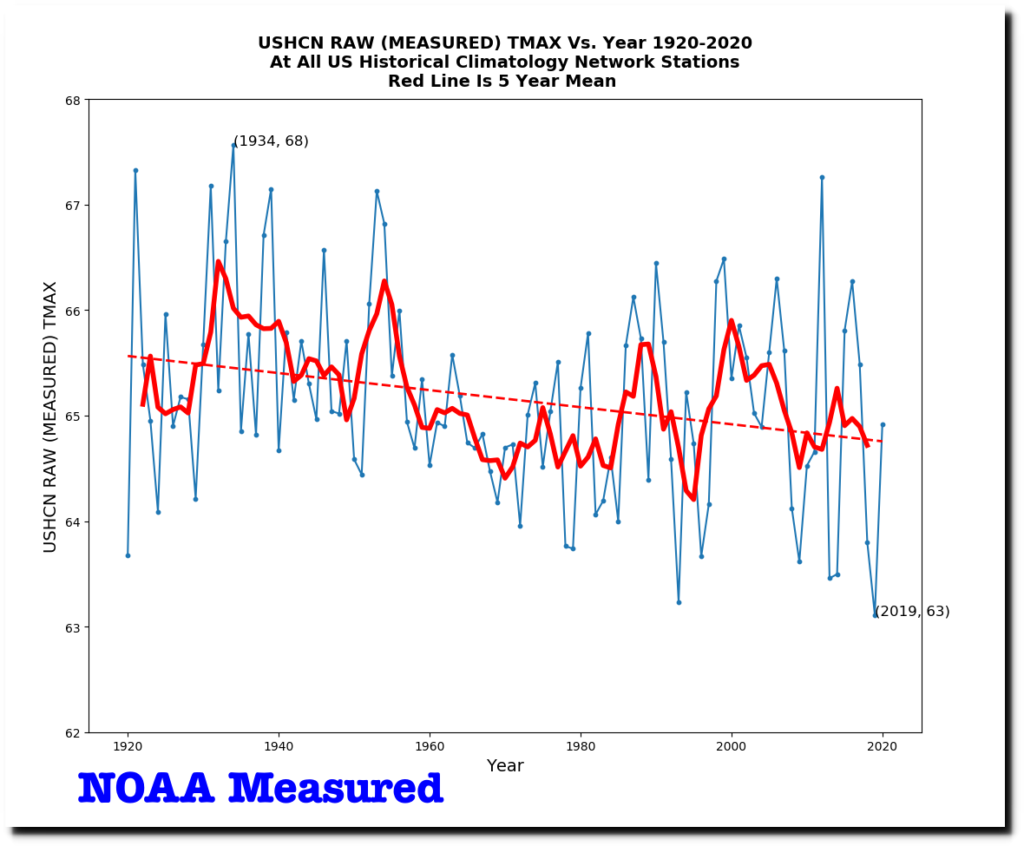
The current data tampering is huge. The measured daily maximum temperature data for the US shows a strong cooling trend.
ftp://ftp.ncdc.noaa.gov/pub/data/ushcn/v2.5/

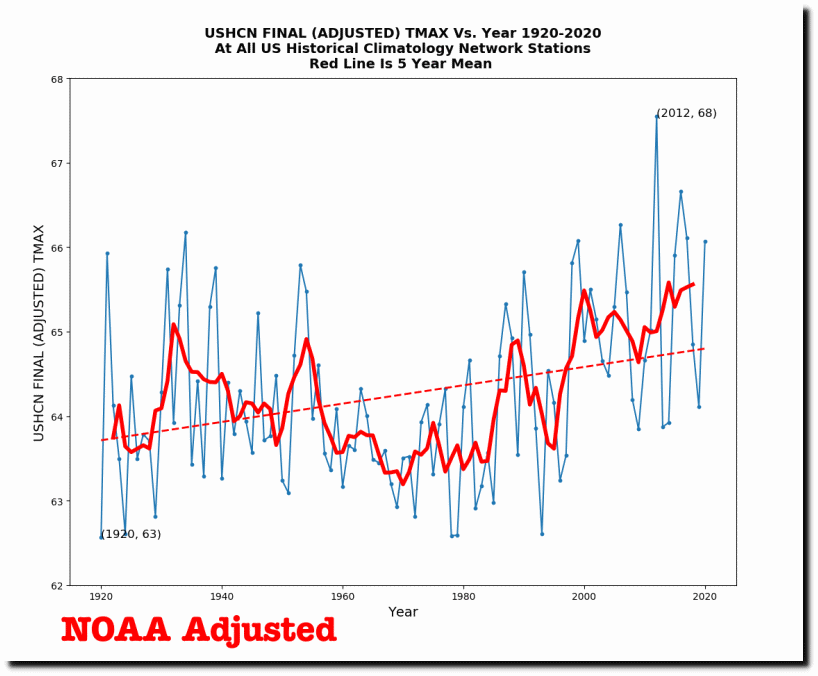
But the adjusted data shows a strong warming trend.
Official US temperature graphs are not in the least credible.

Posted in Uncategorized | Leave a comment

The World’s Leading Climate Expert

Thirty-five years ago, NASA’s James Hansen predicted 4-6 degrees warming for the US from 1958 to 2020, and that the number of (typo in the article) 90 degree days at Omaha and Washington DC would more than double.
12 Jun 1986, Page 12 – The Evening Times at Newspapers.com

The actual average temperature increase in the US from 1958 to 2020 was less than one degree.

The closest currently operational USHCN station to Omaha is at Logan, Iowa. The number of 90 degree days there peaked in 1894 and 1936 (83) and have been declining sharply ever since.

The closest currently operational USHCN station in Virginia to Washington DC is at Purcellville.  The number of 90 degree days there peaked in 1911 (96) and 1930 (89) and have been declining sharply ever since.
In 1988, Hansen’s drought forecasts exactly inverted reality.
“Dr. James E. Hansen, director of the Goddard Institute for Space Studies, who presented recent data compiled from computer models, said that predicted regional effects of global warming show that the chances of summer drought in the low and middle latitudes would be 1 in 3 by the year 2030, as against 1 in 20 in the 1950’s.”

FEROCIOUS STORMS AND DROUGHT SEEN – The New York Times

During the 1950’s the US was in drought most of the time, but droughts have been much less common over the past 60 years.

Climate at a Glance | National Centers for Environmental Information (NCEI)

Posted in Uncategorized | Leave a comment

What Could Possibly Go Wrong?

Posted in Uncategorized | Leave a comment

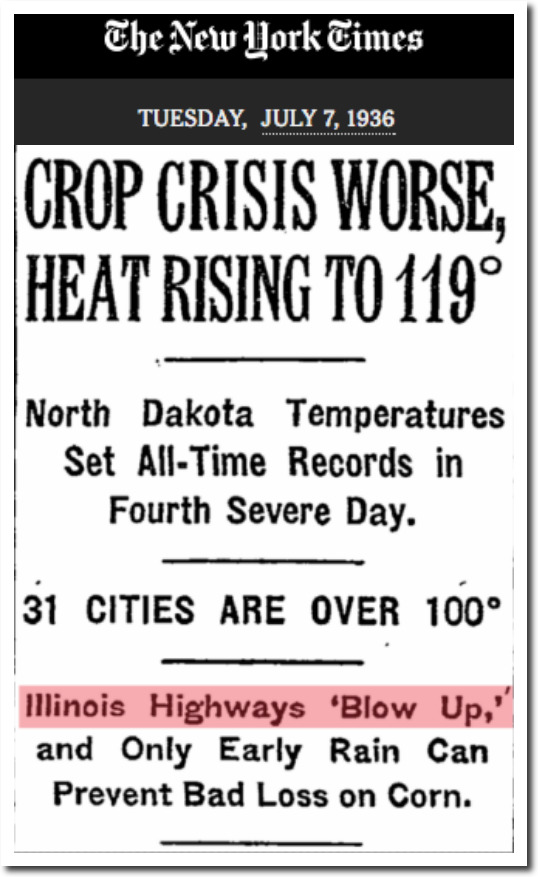
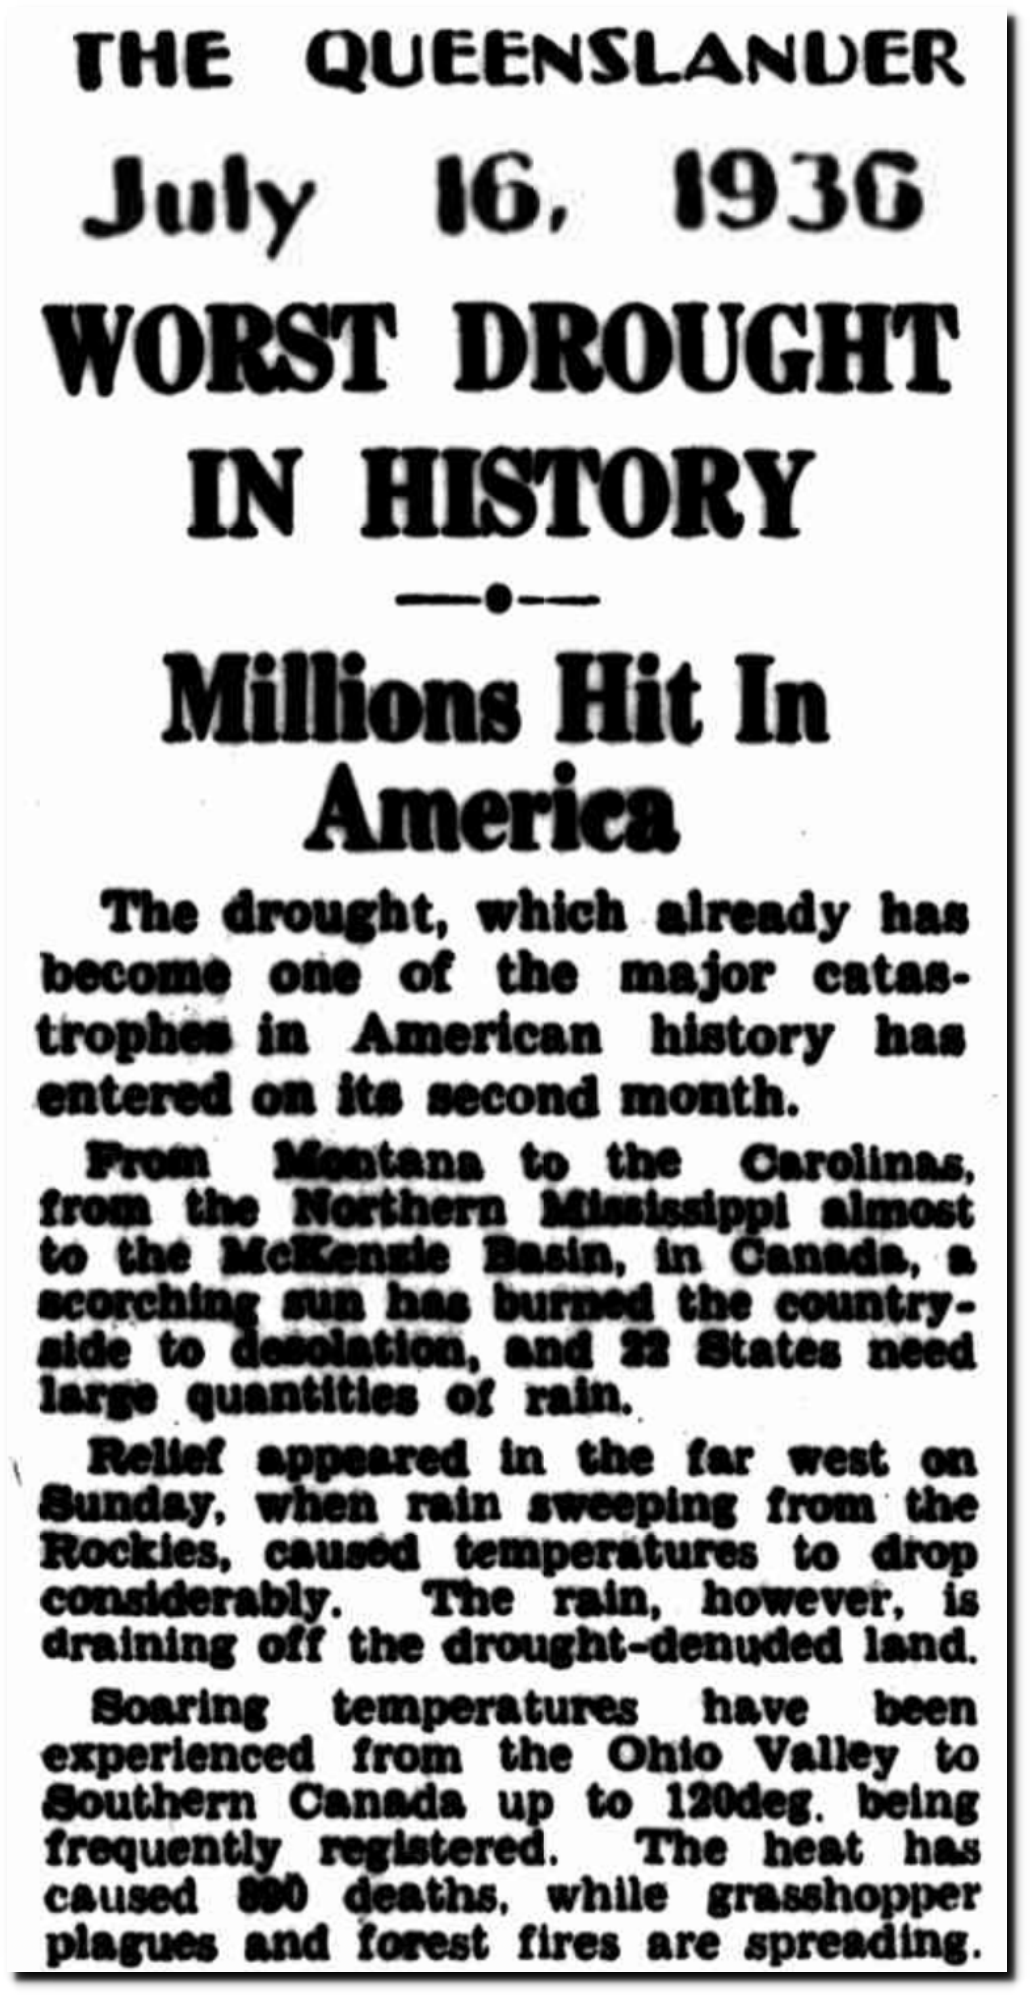
Restoring The Pleasant Climate Of 310 PPM CO2

Wayback Machine

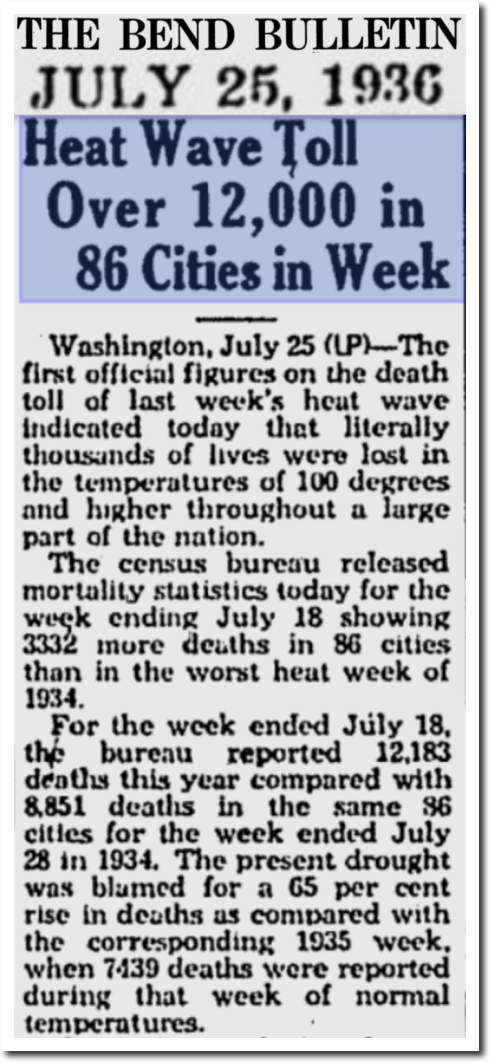
The Bulletin – Google News Archive Search

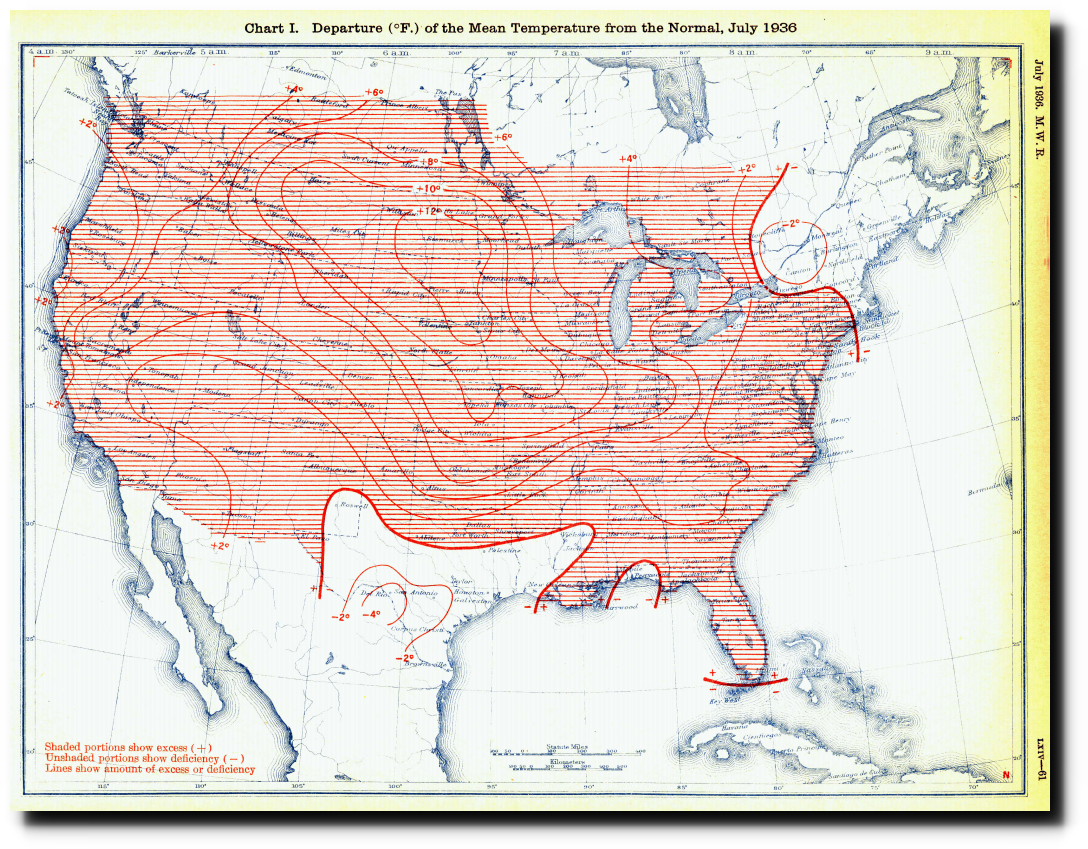
TimesMachine: July 7, 1936 – NYTimes.com

16 Jul 1936 – WORST DROUGHT IN HISTORY – Trove

Posted in Uncategorized | Leave a comment

The Symptoms Of Global Cooling

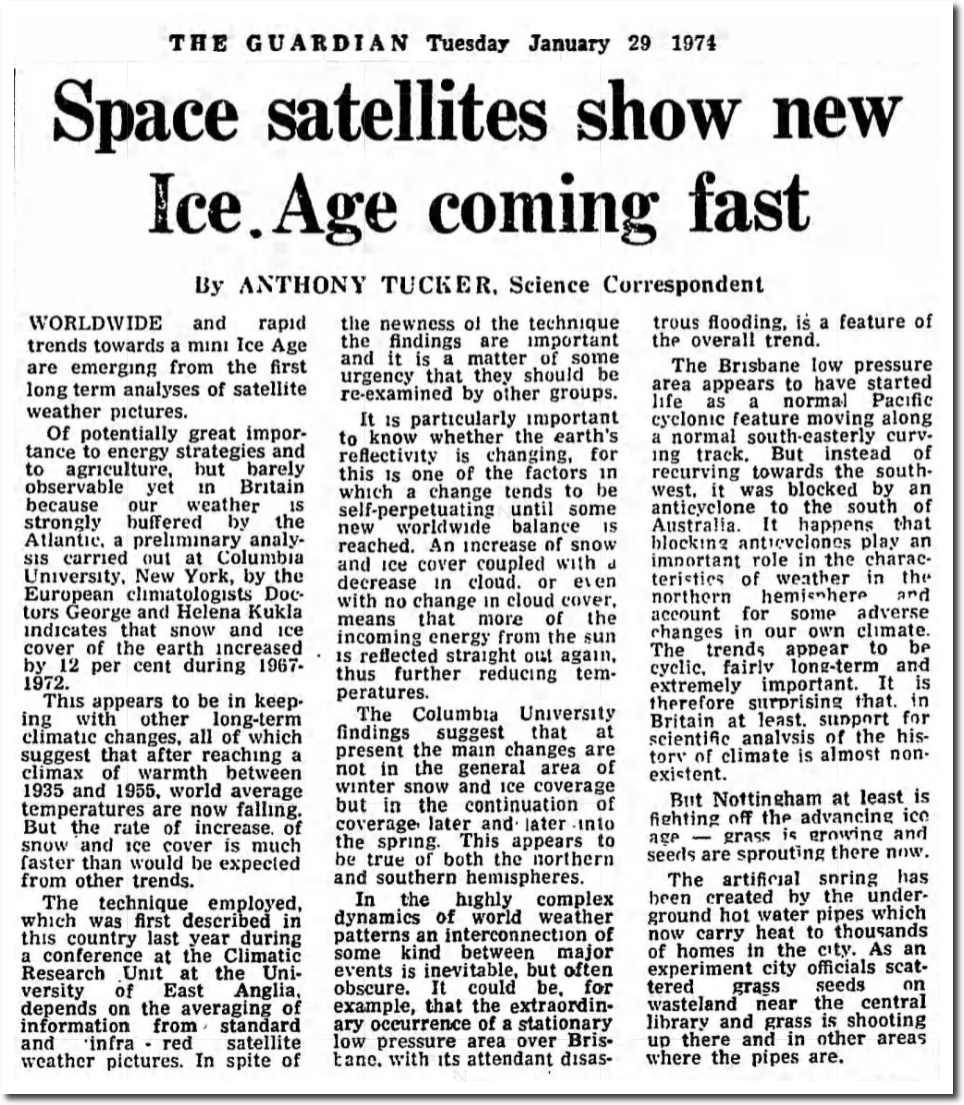
In 1974, global temperatures were plummeting and snow and ice cover was rapidly increasing.

29 Jan 1974, 5 – The Guardian at Newspapers.com

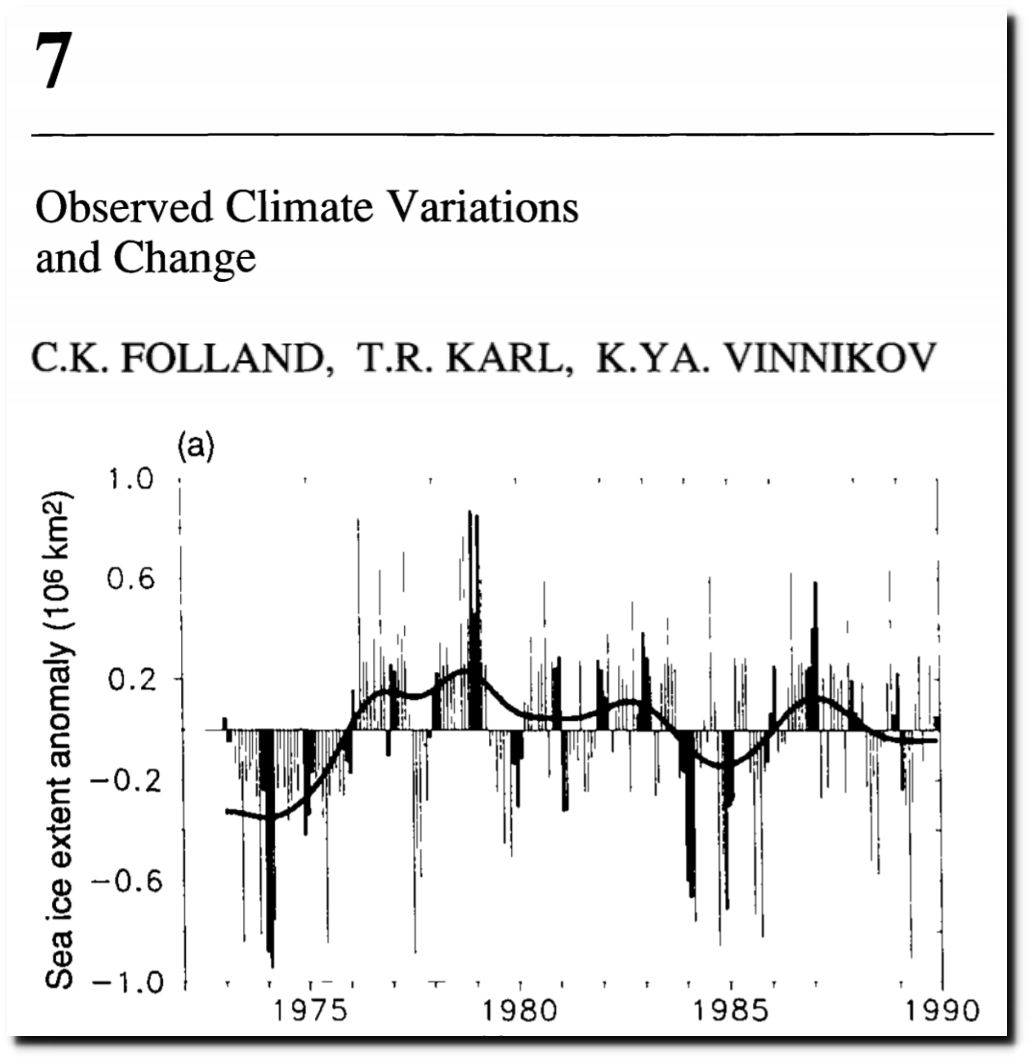
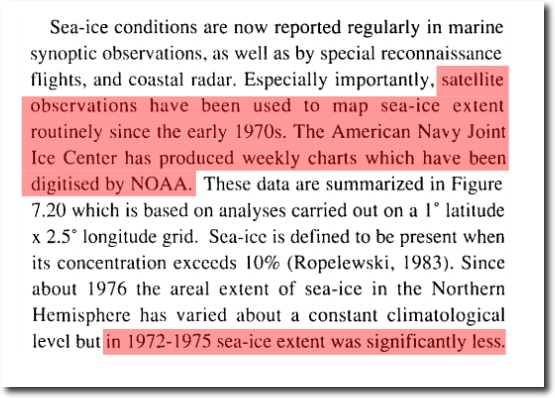
In the 1990 IPCC Report, a large increase in Arctic sea ice was observed from 1974 to the peak in 1979.

1990 IPCC Report

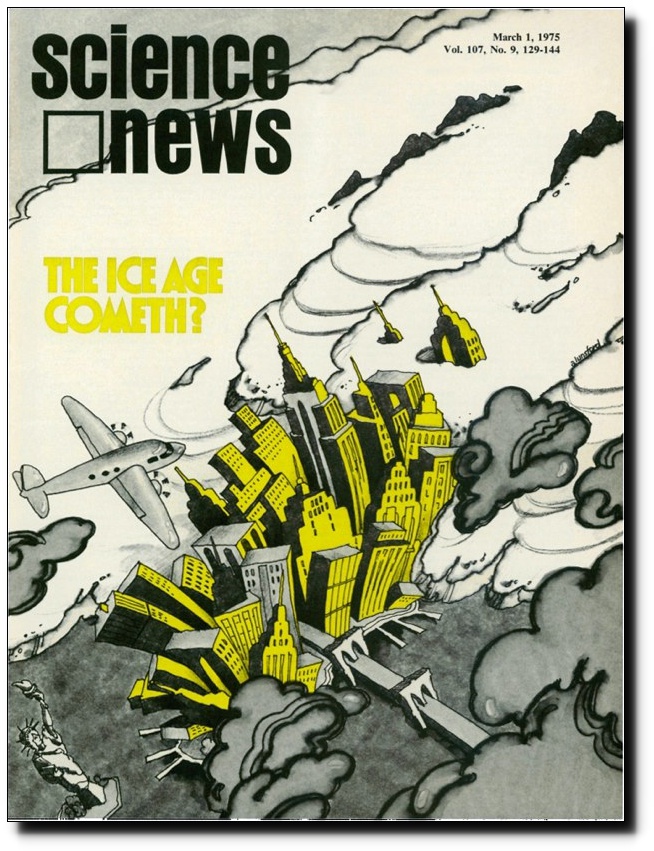
The National Academy of Sciences reported a sharp cooling trend which began about 1940.

March 1, 1975 | Science News

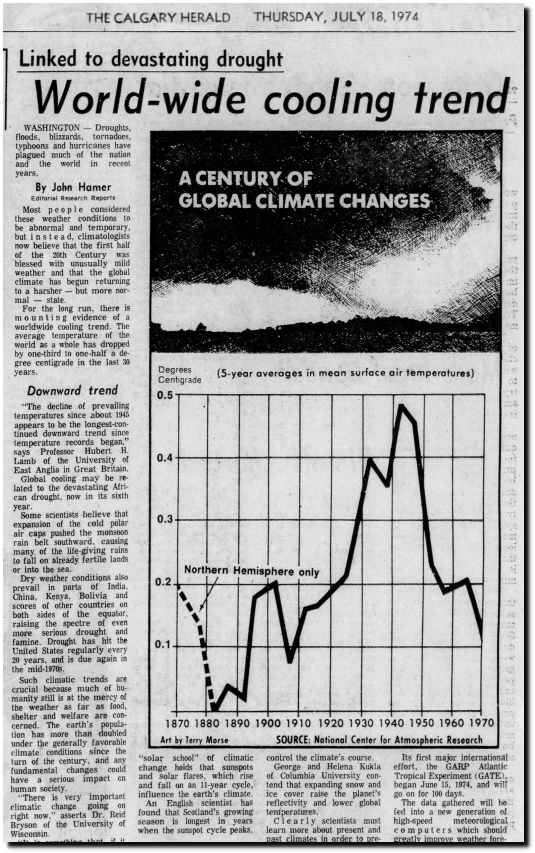
The National Center For Atmospheric Research (NCAR) showed the same cooling trend.

18 Jul 1974, 5 – Calgary Herald at Newspapers.com

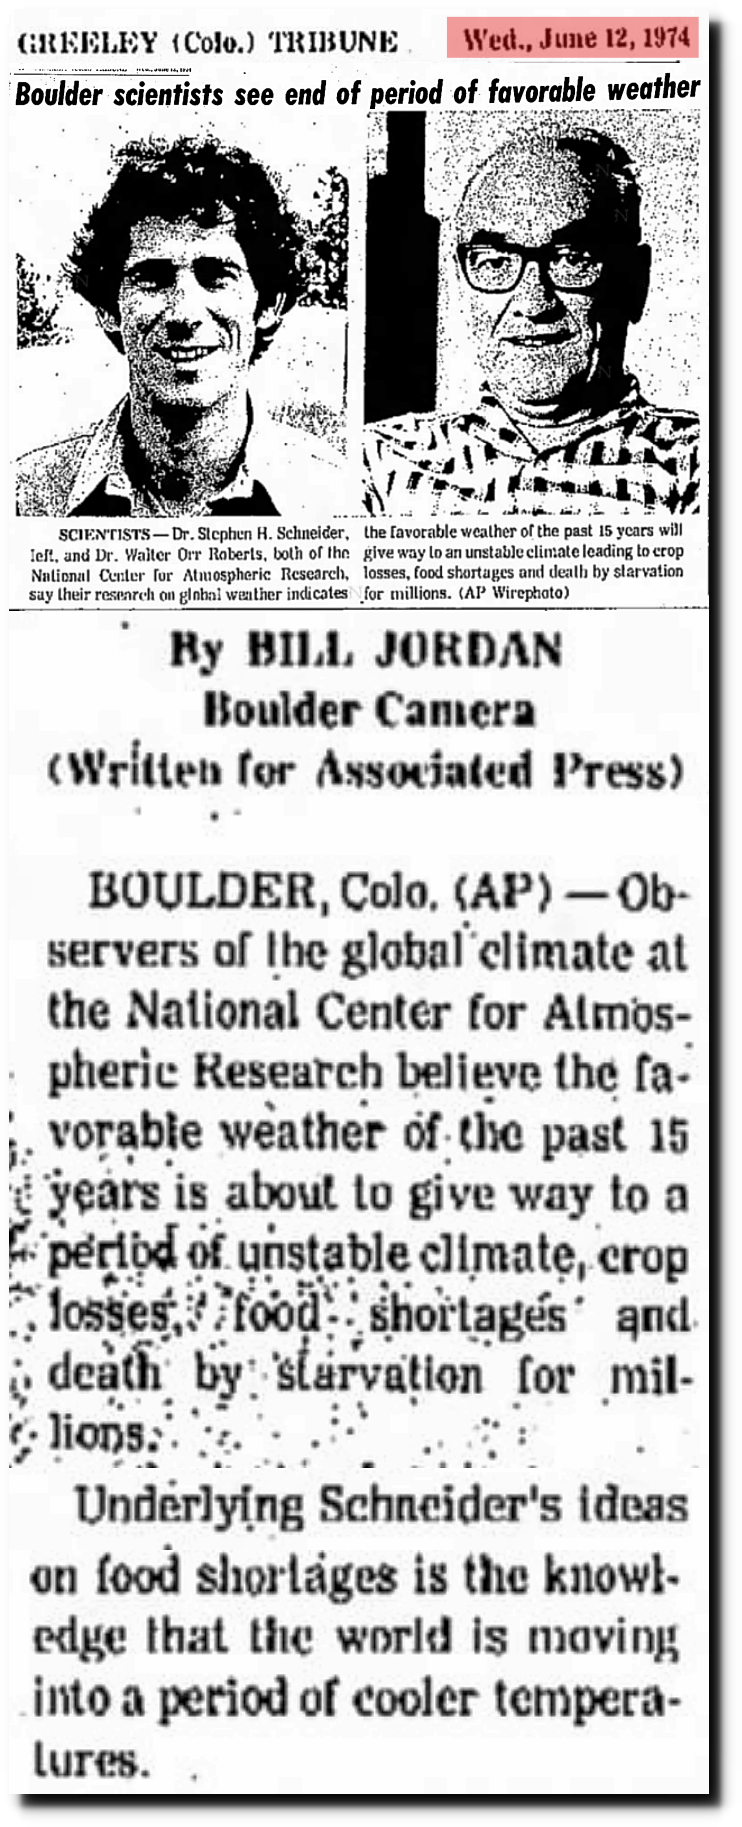
The director and most famous scientist at NCAR said global cooling was going to cause and unstable climate and food shortages.

12 Jun 1974, Page 20 – at Newspapers.com

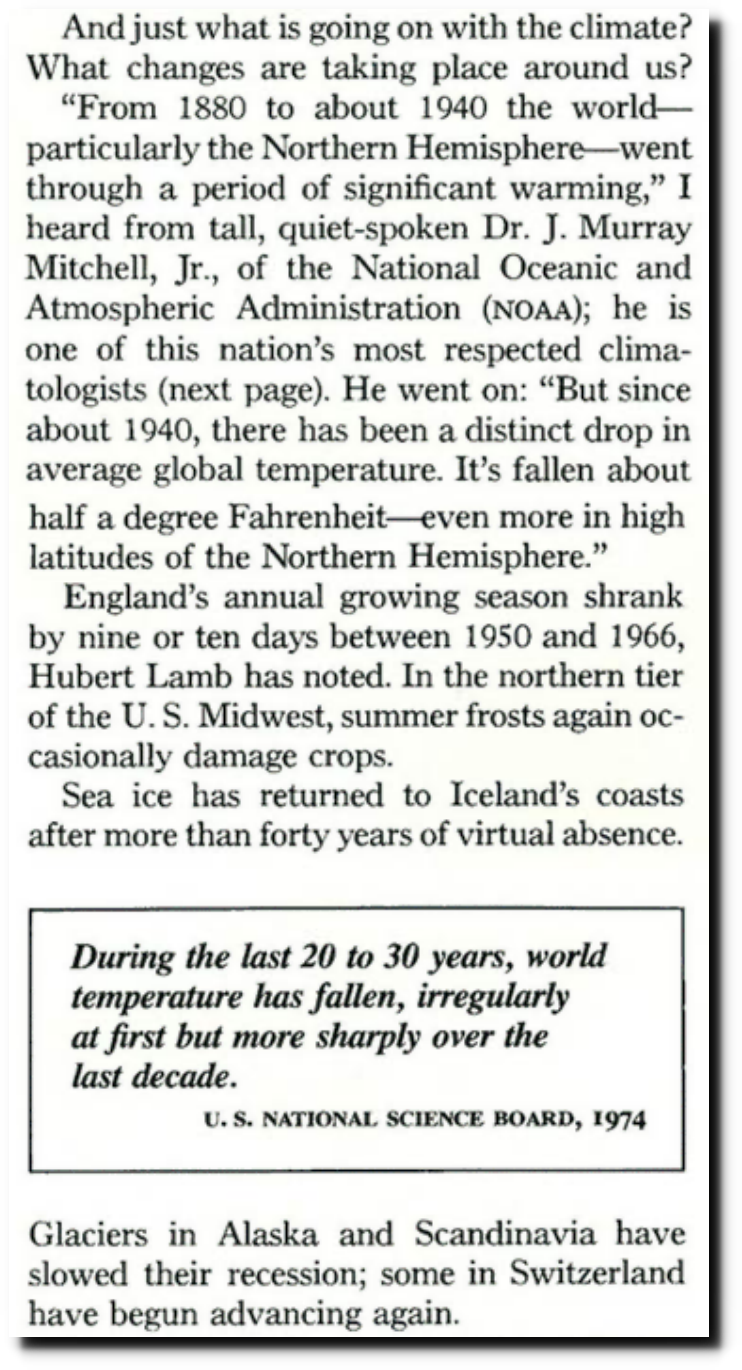
Growing seasons were getting shorter and sea ice was blocking Iceland’s ports.

The National Geographic Archive | November 1976 | page 1

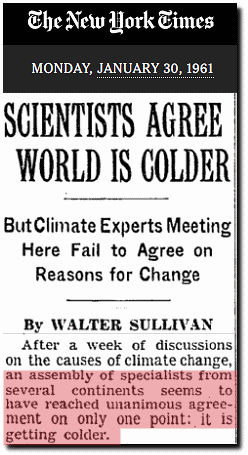
By 1961, there was a unanimous consensus of scientists that earth was cooling.

January 30, 1961 – NYTimes

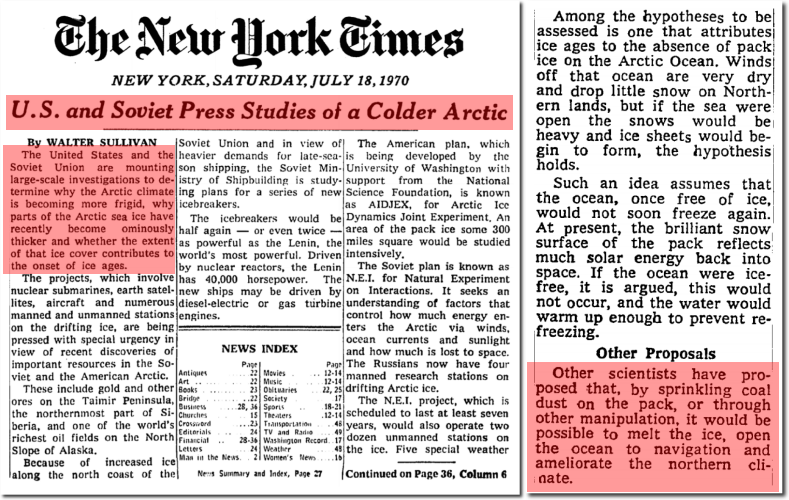
The US and Soviet Union were worried about a new ice age, and scientists wanted to melt the Arctic.

“The United States and the Soviet Union are mounting large?scale investigations to determine why the Arctic climate is becoming more frigid, why parts of the Arctic sea ice have recently become ominously thicker and whether the extent of that ice cover contributes to the onset of ice ages.”

“Other scientists have proposed that, by sprinkling coal dust on the pack, or through other manipulation, it would be possible to melt the ice, open the ocean to navigation and ameliorate the northern climate.”

U.S. and Soviet Press Studies of a Colder Arctic – The New York Times

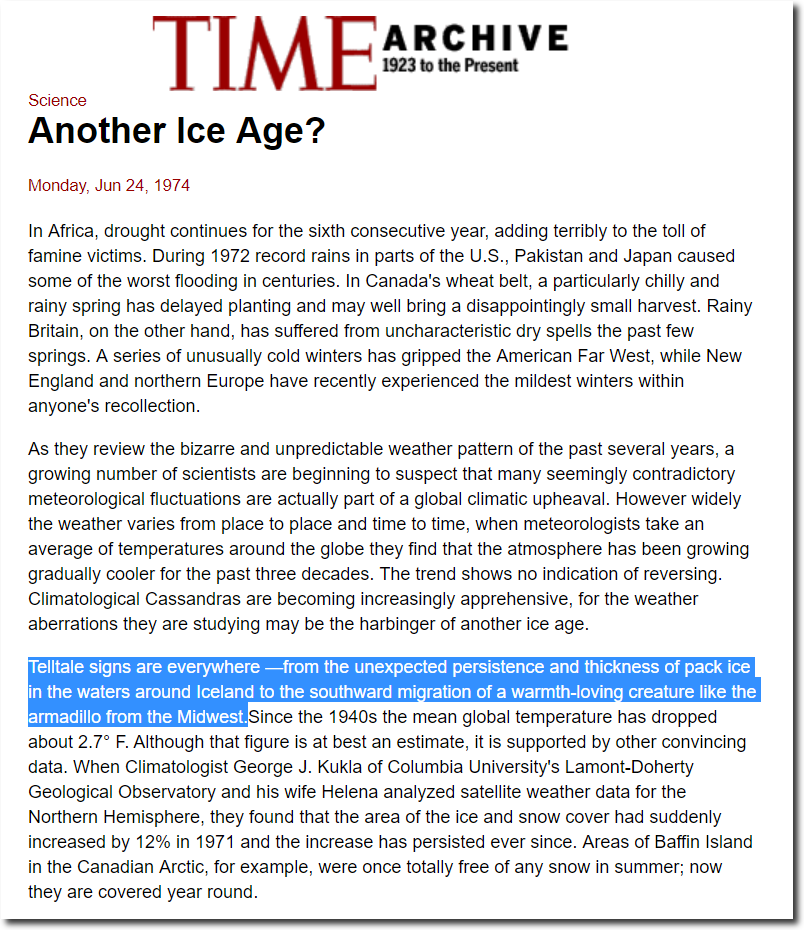
Scientists blamed every kind of extreme weather on global cooling.

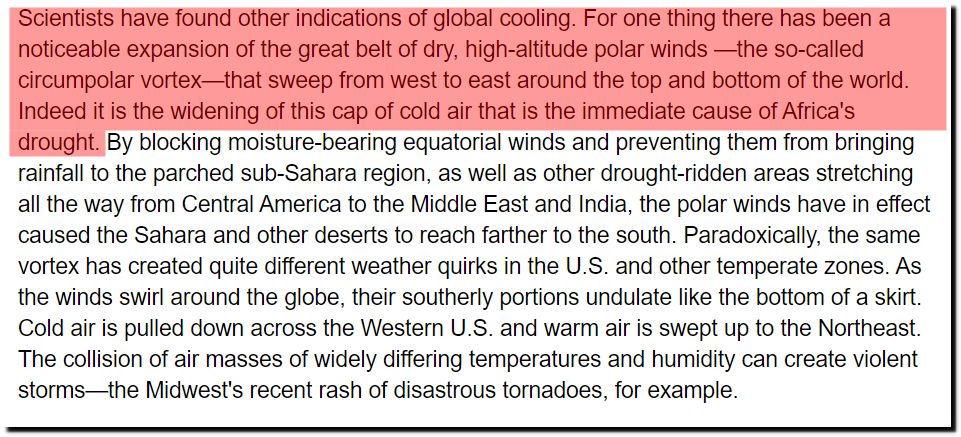
Scientists blamed the Polar Vortex on global cooling, which they now blame on global warming.

TIME Magazine Archive Article — Another Ice Age? — Jun. 24, 1974

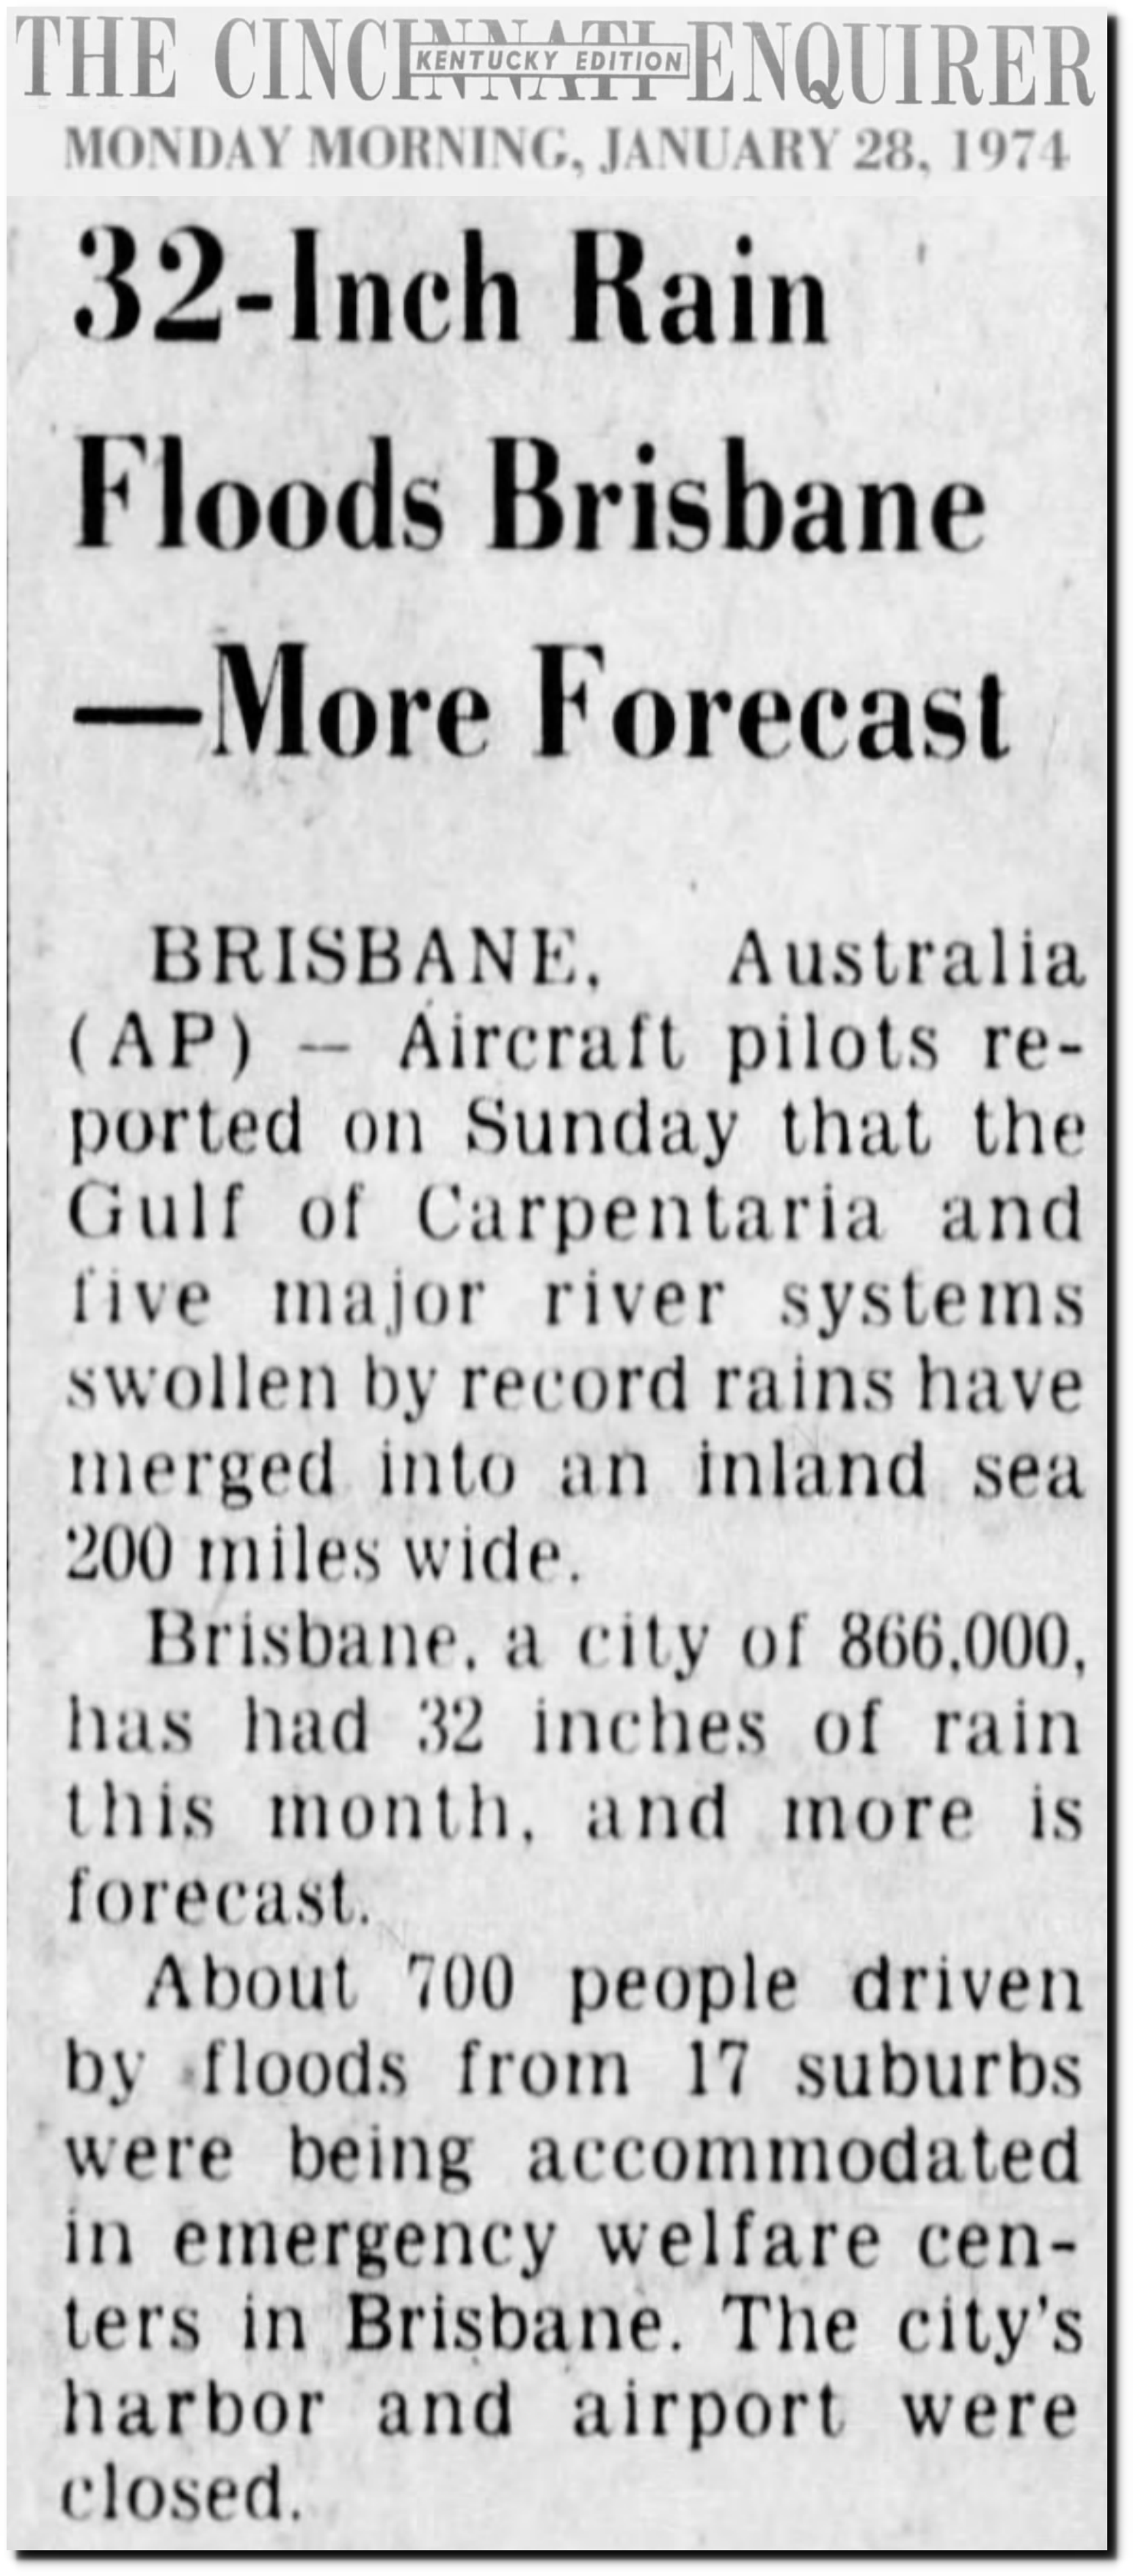
So what was the weather like in 1974?  Record rain in Brisbane in January.

28 Jan 1974, Page 12 – The Cincinnati Enquirer at Newspapers.com

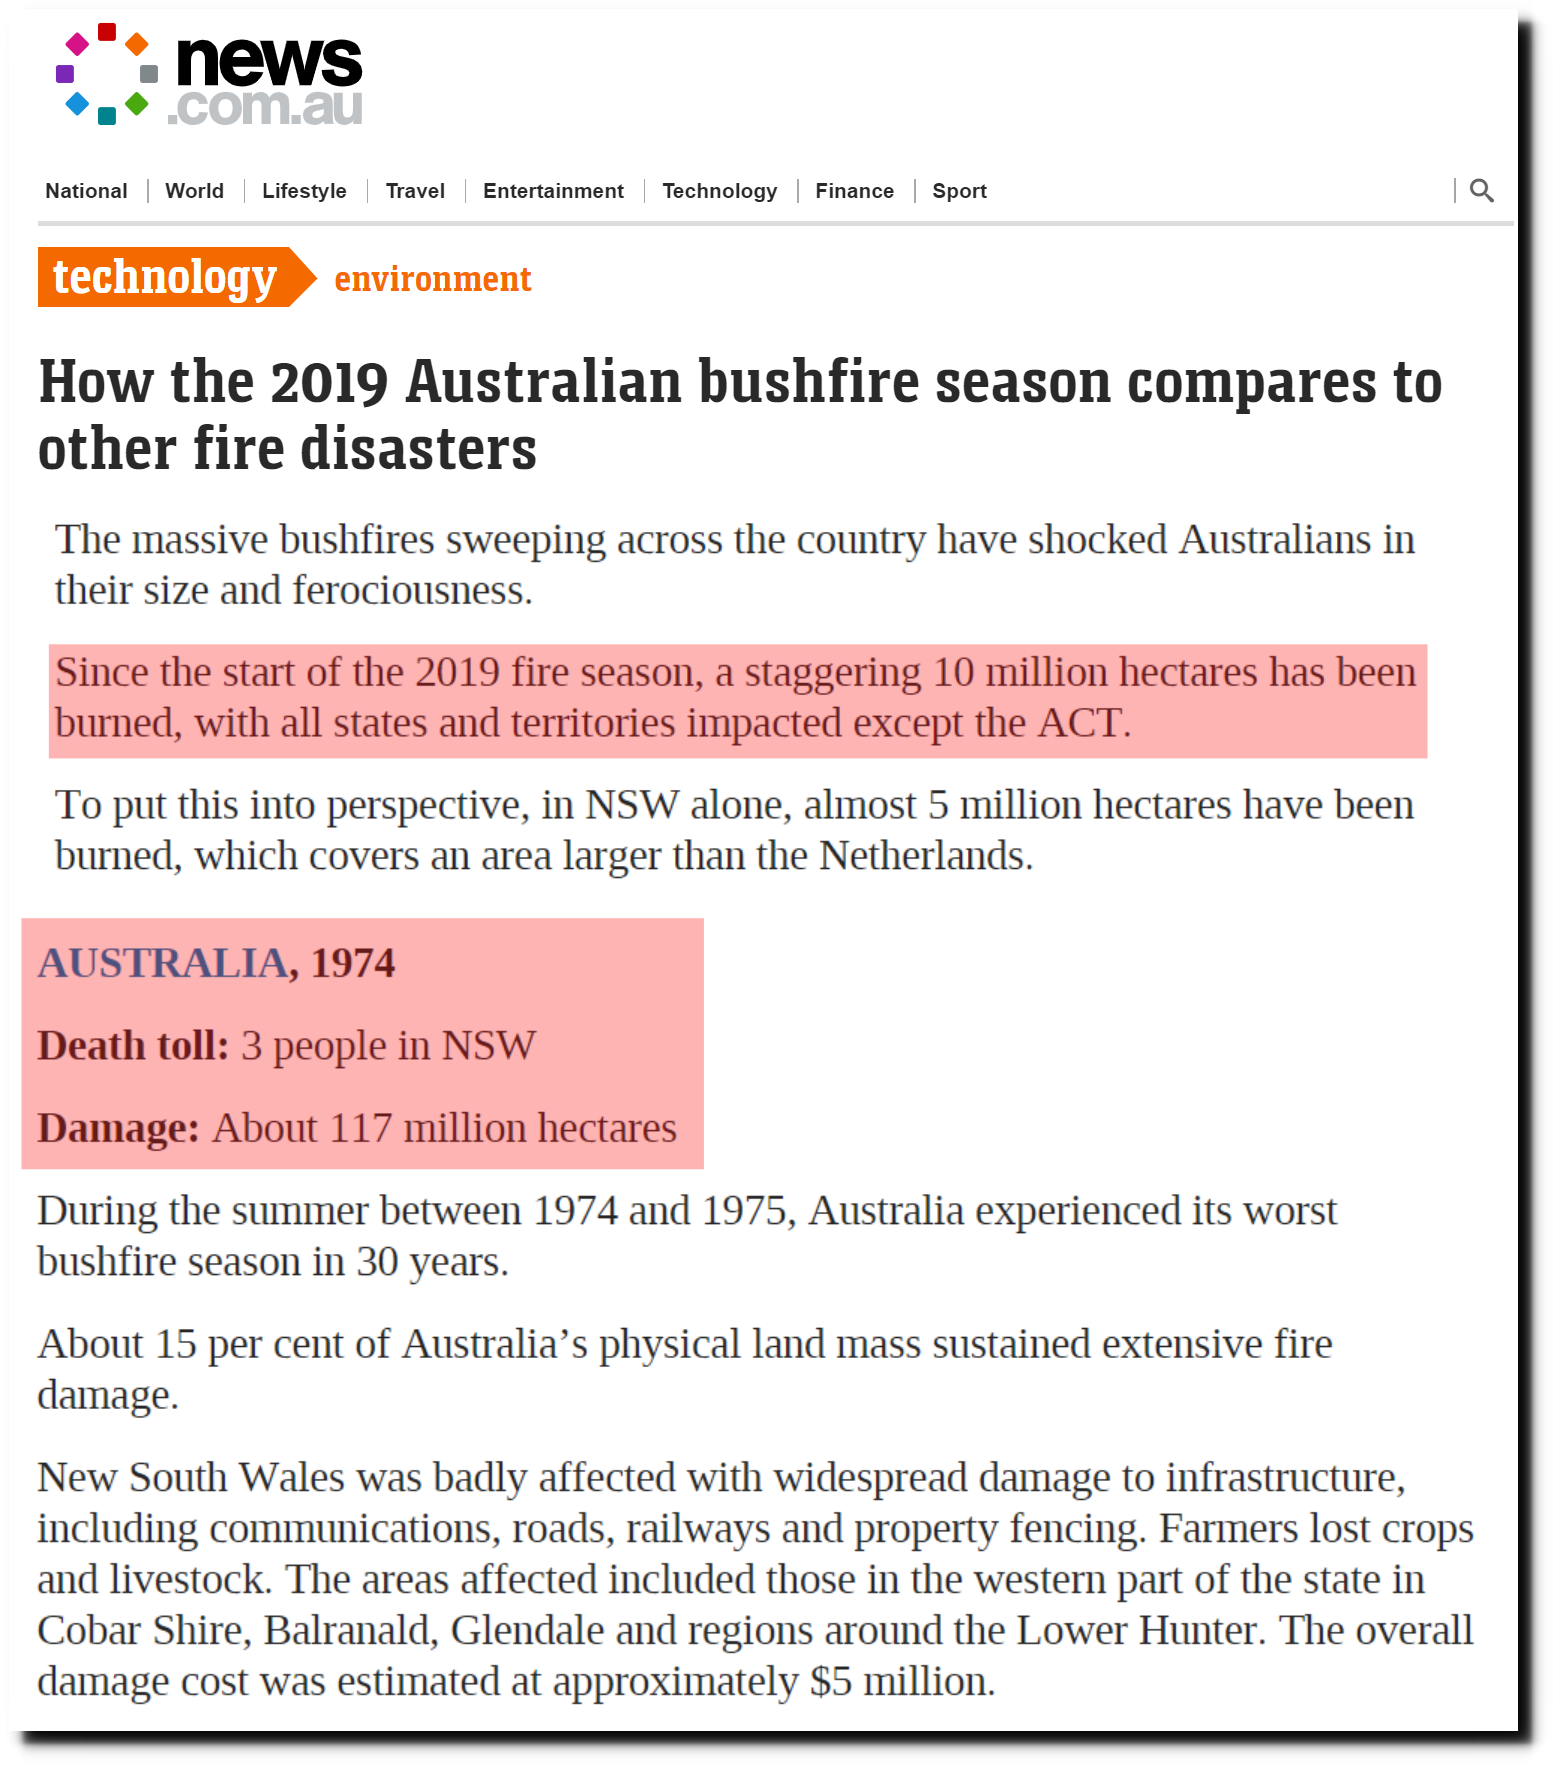
Australia’s worst fire season on record, with fifteen percent of the country burning.

Australian bushfires: Why 2019 fire season is different from others

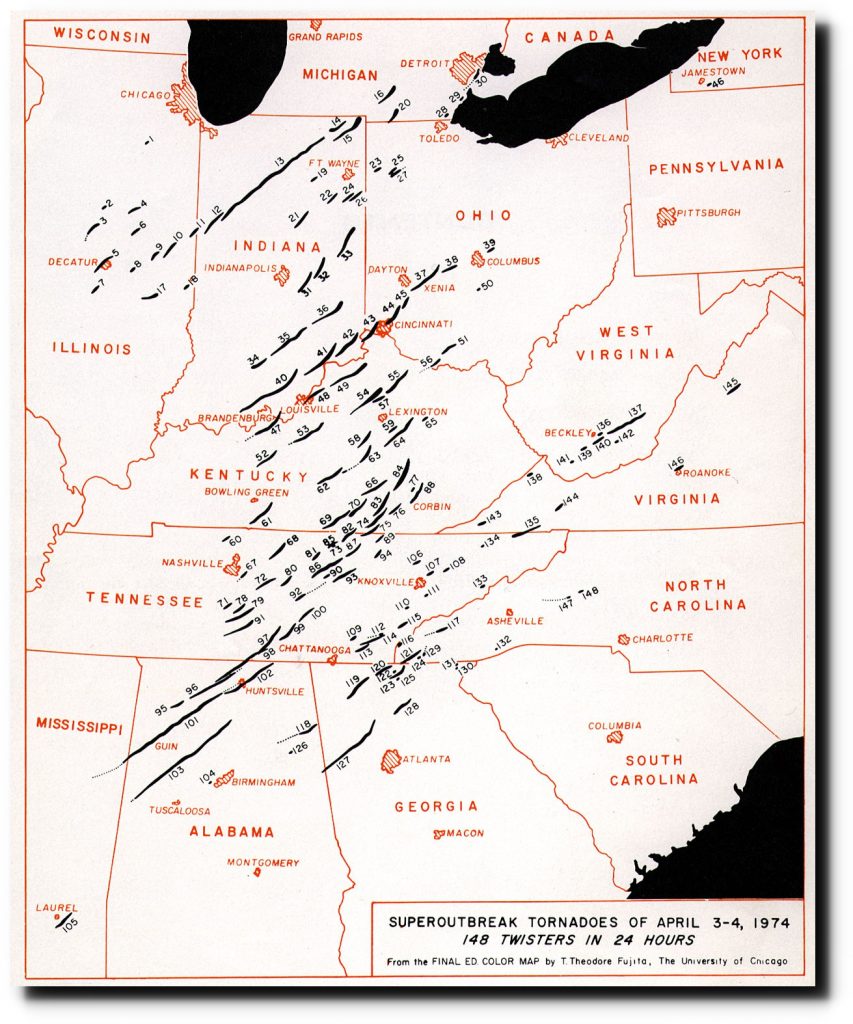
The largest tornado outbreak in US history occurred during April, 1974

List of tornadoes in the 1974 Super Outbreak – Wikipedia

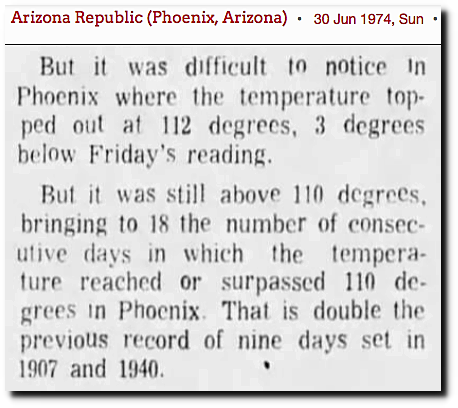
Phoenix had their longest heatwave over 110 degrees – eighteen consecutive days during June.

30 Jun 1974, Page 31 – Arizona Republic at Newspapers.com

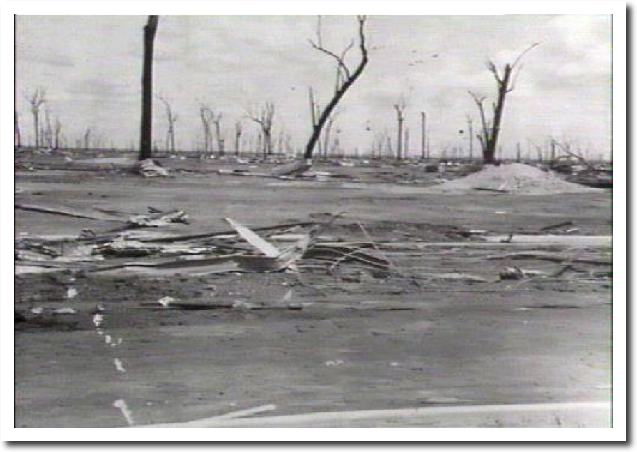
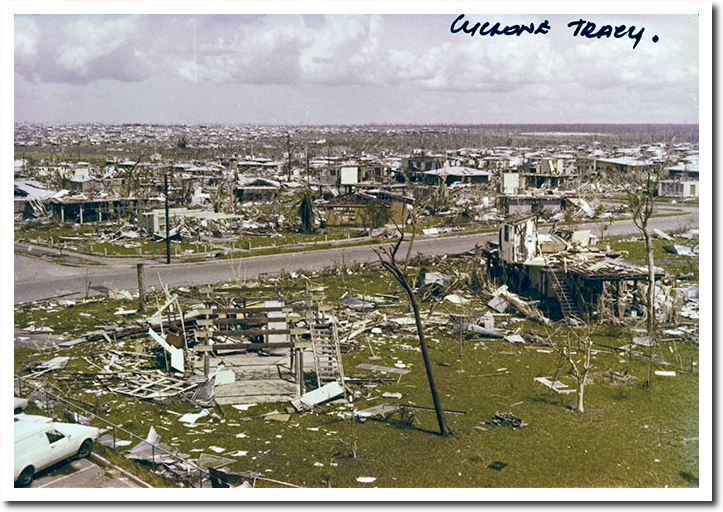
On Christmas Day 1974, Darwin was destroyed by Cyclone Tracy. The city was uninhabitable for a year.

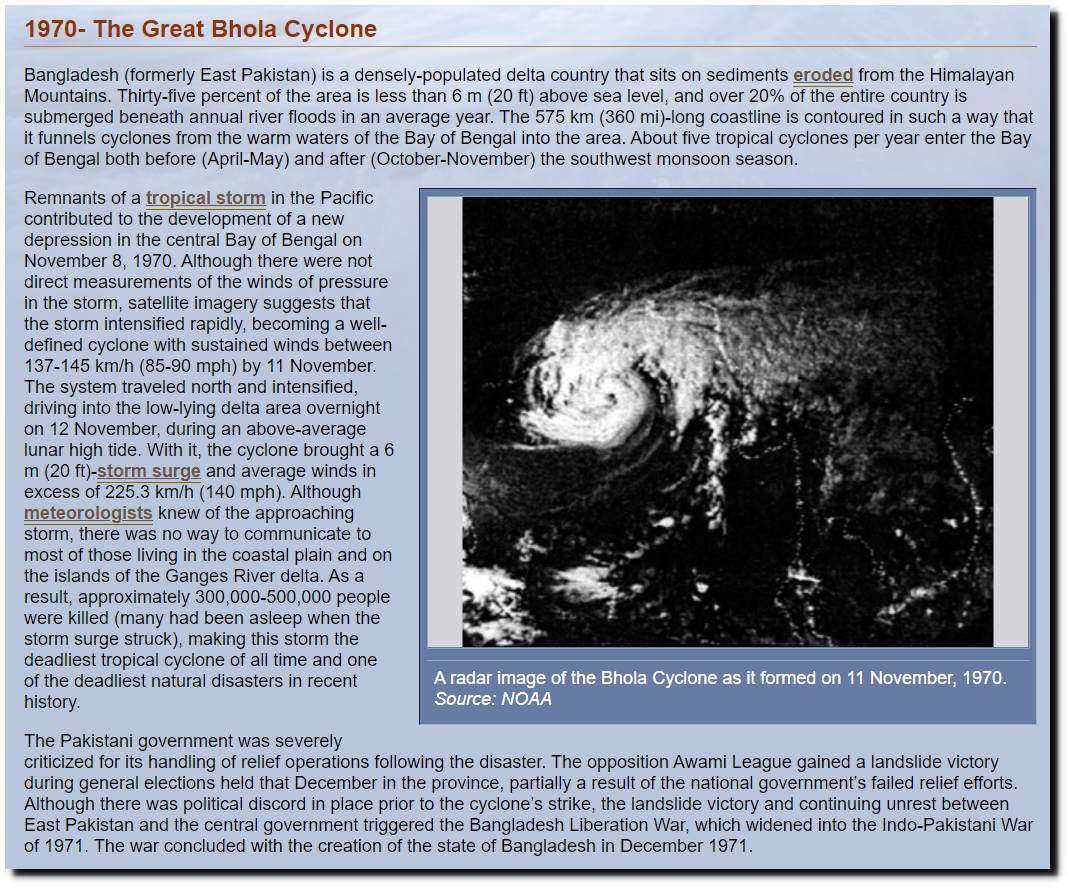
And this came four years after the deadliest cyclone on record.

Hurricanes: Science and Society: 1970- The Great Bhola Cyclone

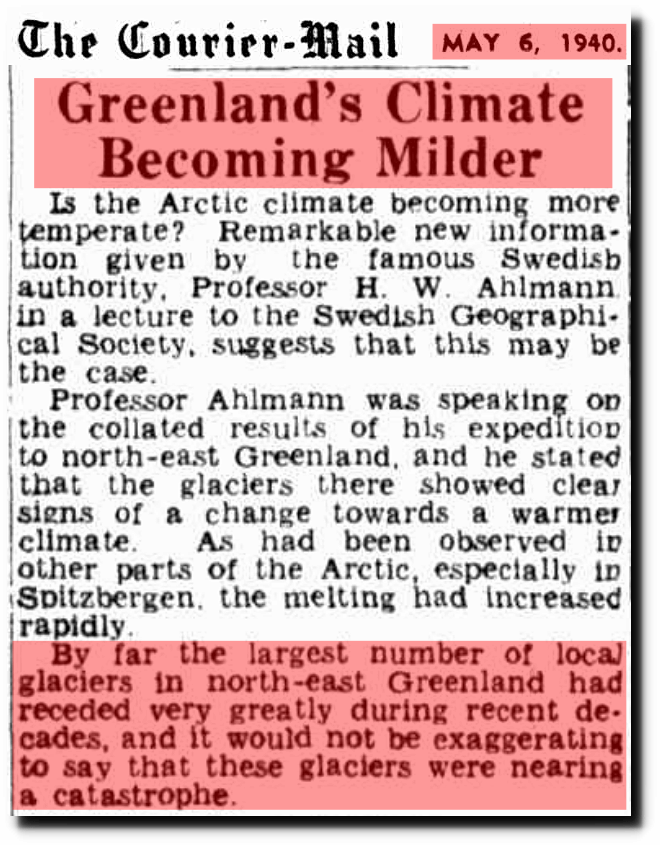
Temperatures were very warm around 1940, and Greenland glaciers were nearing catastrophe.

06 May 1940 – Greenland’s Climate Becoming Milder 

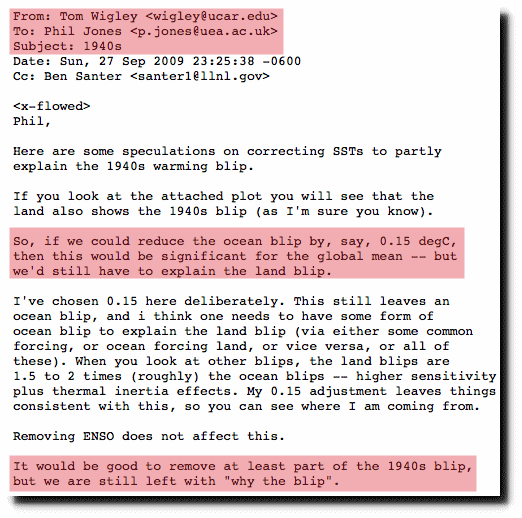
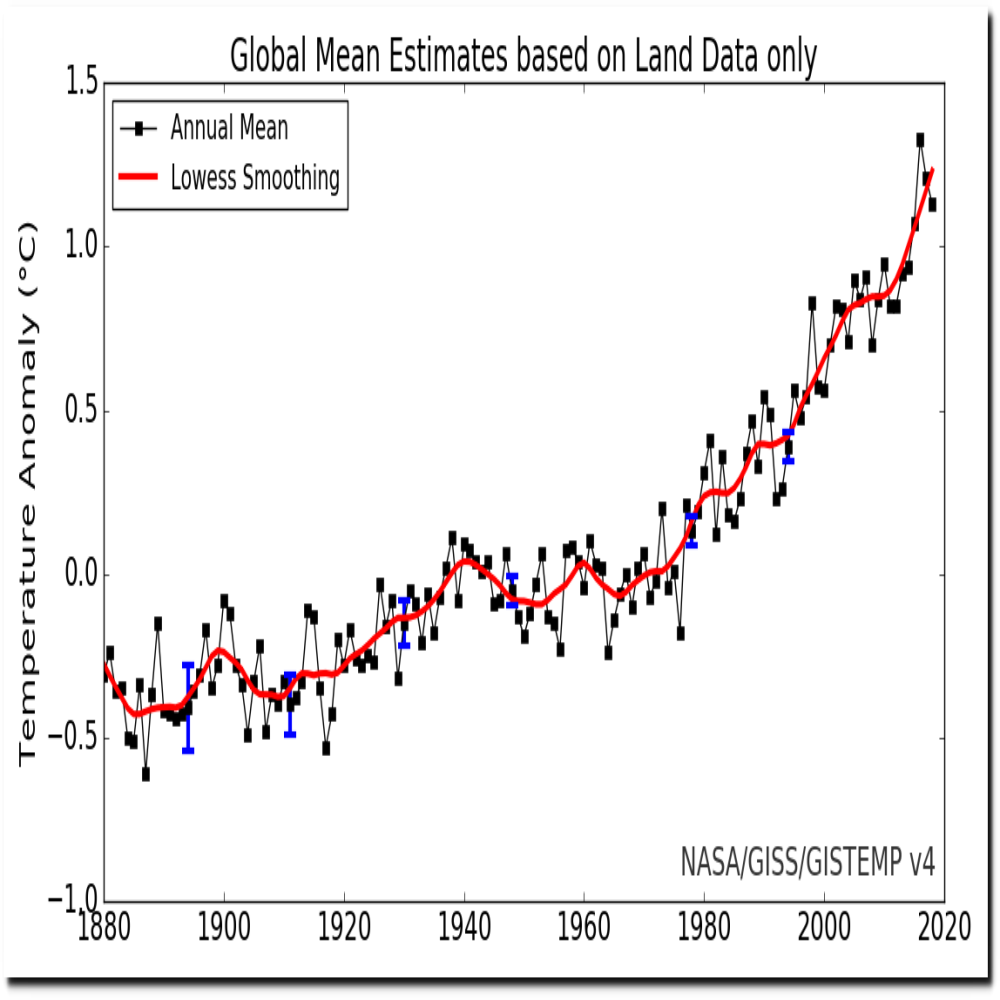
But climate scientists have come to the rescue, by erasing the 1940s warmth and subsequent global cooling.

di2.nu/foia/1254108338.txt

graph.png (1130×600)

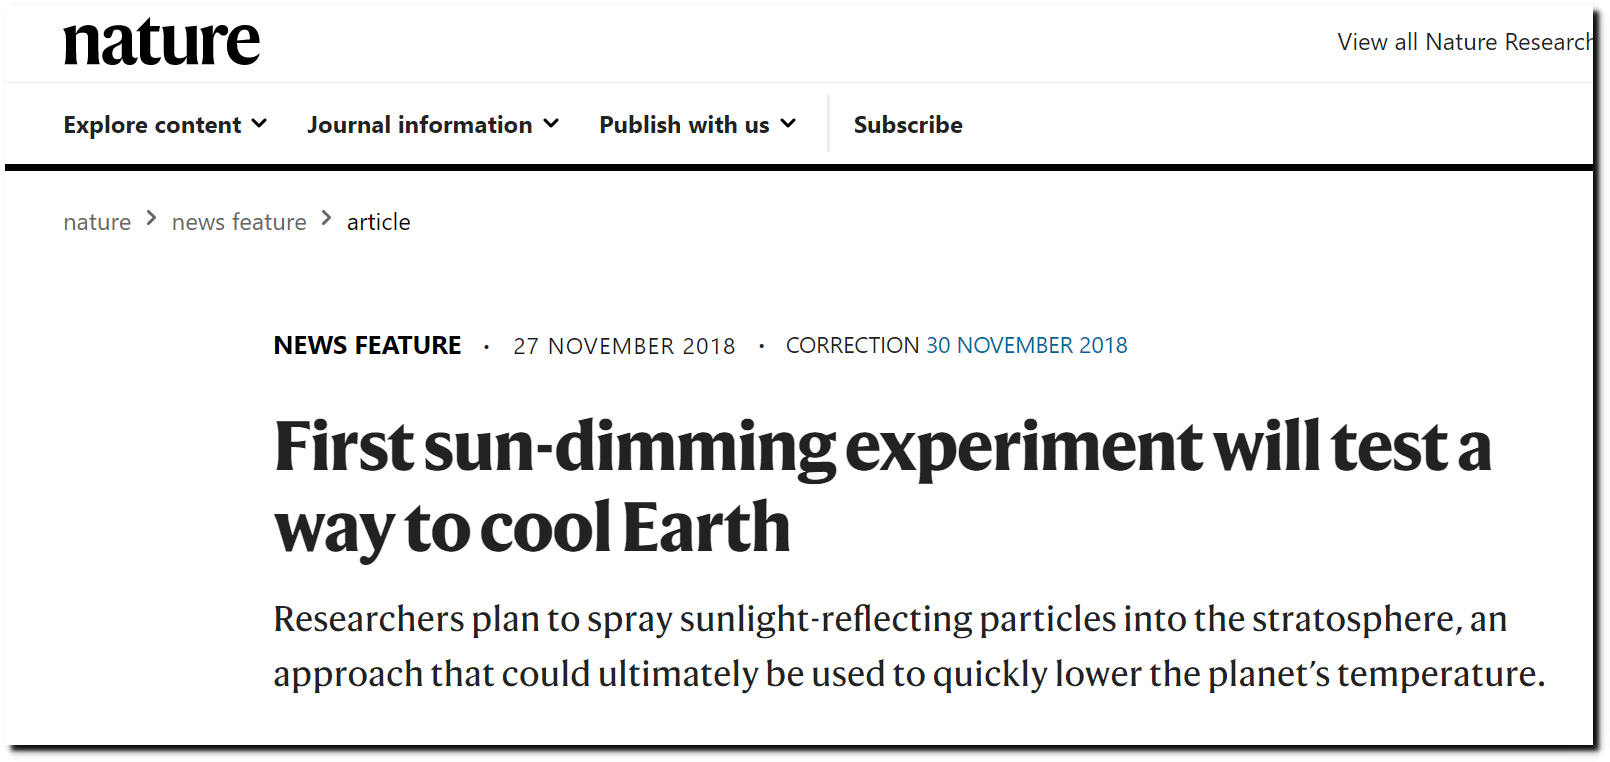
And they want to stop global warming by polluting the upper atmosphere.

First sun-dimming experiment will test a way to cool Earth

Posted in Uncategorized | Leave a comment