
Disrupting the Borg is expensive and time consuming!

Google Search
-
Recent Posts
- One Atomic Bomb Per Hour
- New Video : Analyzing Oil And Gas
- Is Antarctica Melting?
- High Speed Analysis And Visualization
- El Nino To The Rescue?
- Fake News Update
- Growth Of Antarctic Sea Ice
- 65 Years Of Progress!
- El Nino To The Rescue?
- Worst March Drought On Record
- ChartGL Process Control Demo
- The Biggest Money Laundering Scam
- Drought In The Headwaters Of Lake Powell
- Unrealistic Expectations Of Water Availability
- Did Bill Gates Do This?
- Worst March Drought On Record In The US
- The Real Hockey Stick Graph
- Analyzing The Western Water Crisis
- Gaslighting 1924
- “Why Do You Resist?”
- Climate Attribution Model
- Fact Checking NASA
- Fact Checking Grok
- Fact Checking The New York Times
- New Visitech Features
June 2026 M T W T F S S 1 2 3 4 5 6 7 8 9 10 11 12 13 14 15 16 17 18 19 20 21 22 23 24 25 26 27 28 29 30 Recent Comments
- Bob G on One Atomic Bomb Per Hour
- Bob G on One Atomic Bomb Per Hour
- Hank Phillips on One Atomic Bomb Per Hour
- Hank Phillips on One Atomic Bomb Per Hour
- Bob G on One Atomic Bomb Per Hour
- Bob G on One Atomic Bomb Per Hour
- Bob G on One Atomic Bomb Per Hour
- Bob G on One Atomic Bomb Per Hour
- Jack the Insider on One Atomic Bomb Per Hour
- Bob G on One Atomic Bomb Per Hour
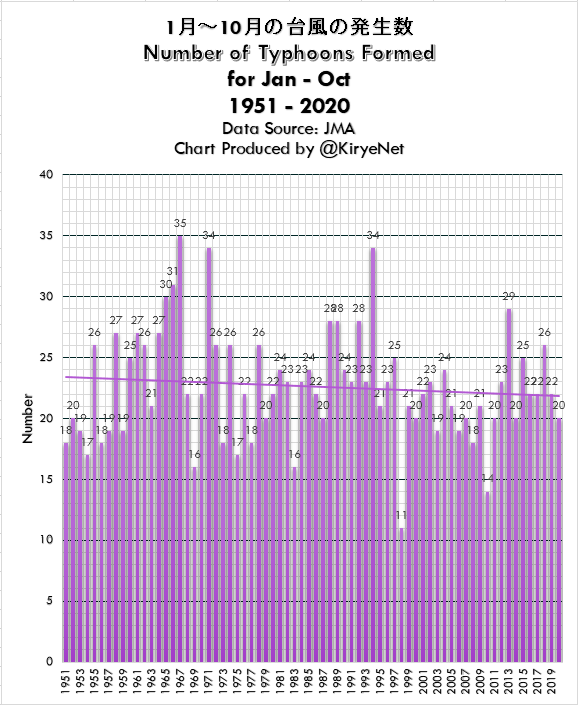
Number Of Typhoons Formed From January Through October Between 1951 And 2020
I checked the data for typhoons until October 31, 2020.
Looking at the data for October alone, the number of typhoons formed has been trending down since 1951.
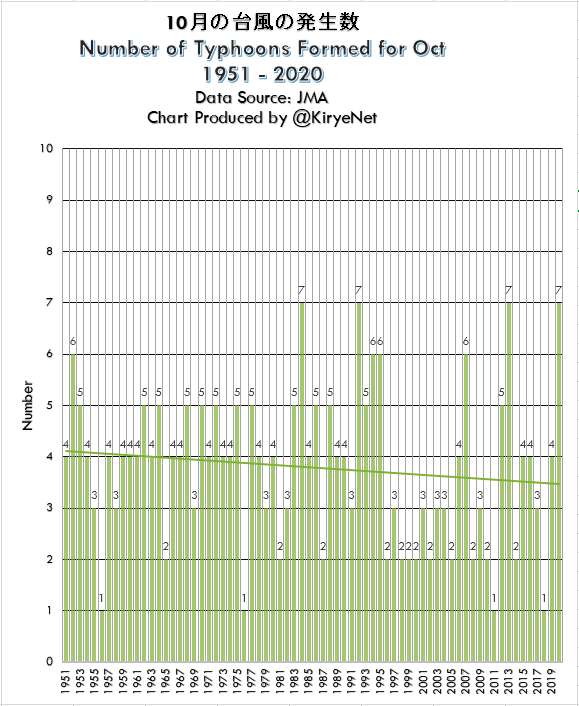
?Data Source: Japan Meteorological Agency (JMA)
The number of typhoons formed from January through October between 1951 and 2020 also shows a downward trend.
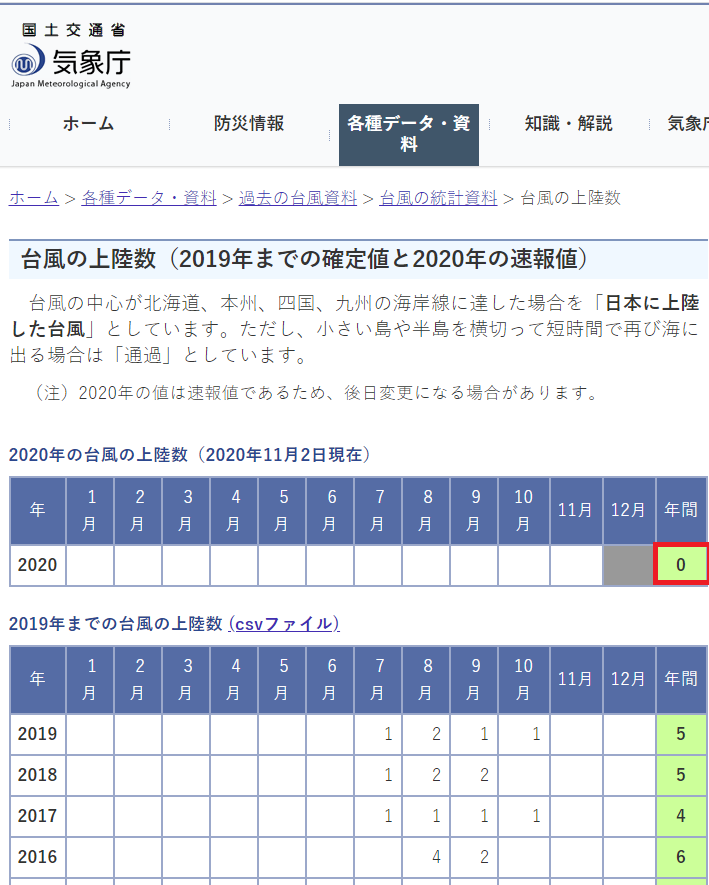
In addition, as November 2, 2020, the number of typhoons landing in Japan this year is still zero.
Posted in Uncategorized
Leave a comment