Climate Groundhog Day

Insanity: doing the same thing over and over again and expecting different results.

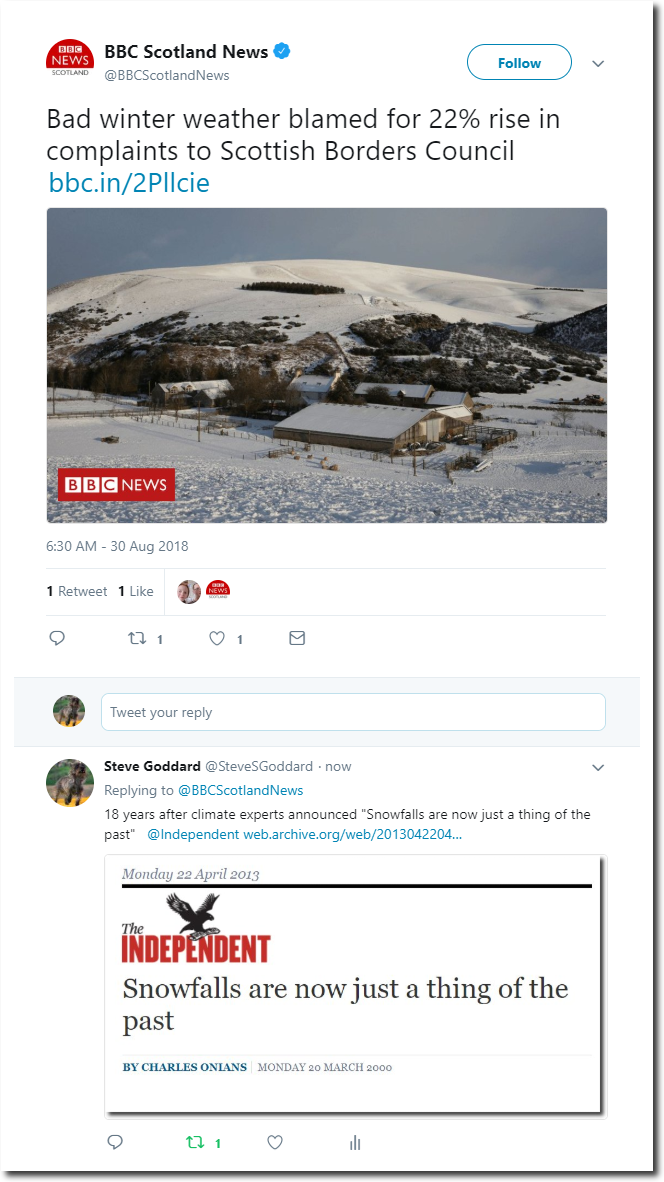
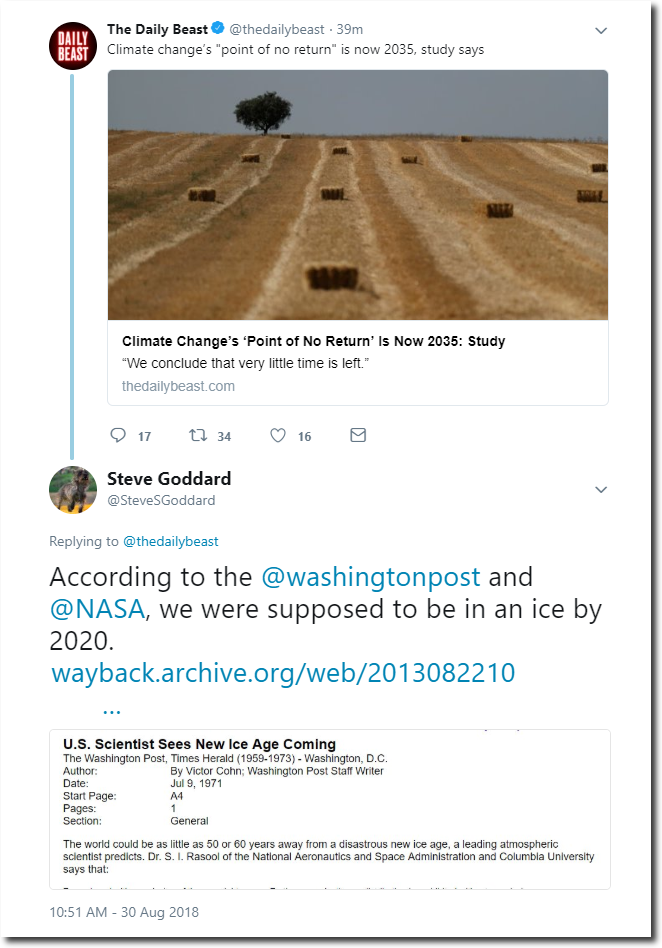
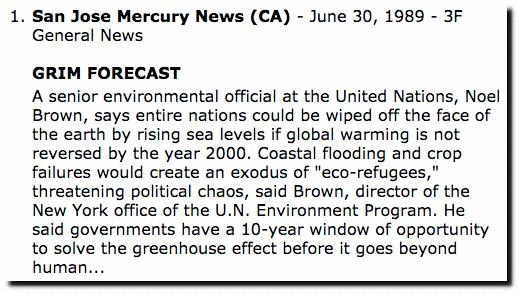
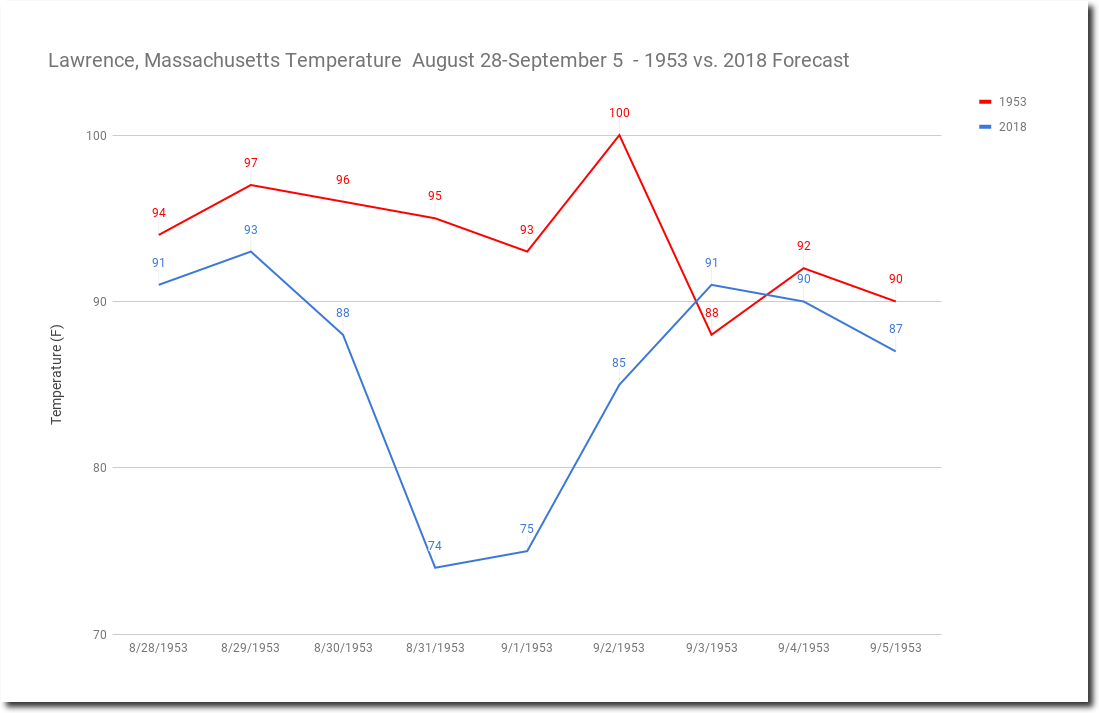
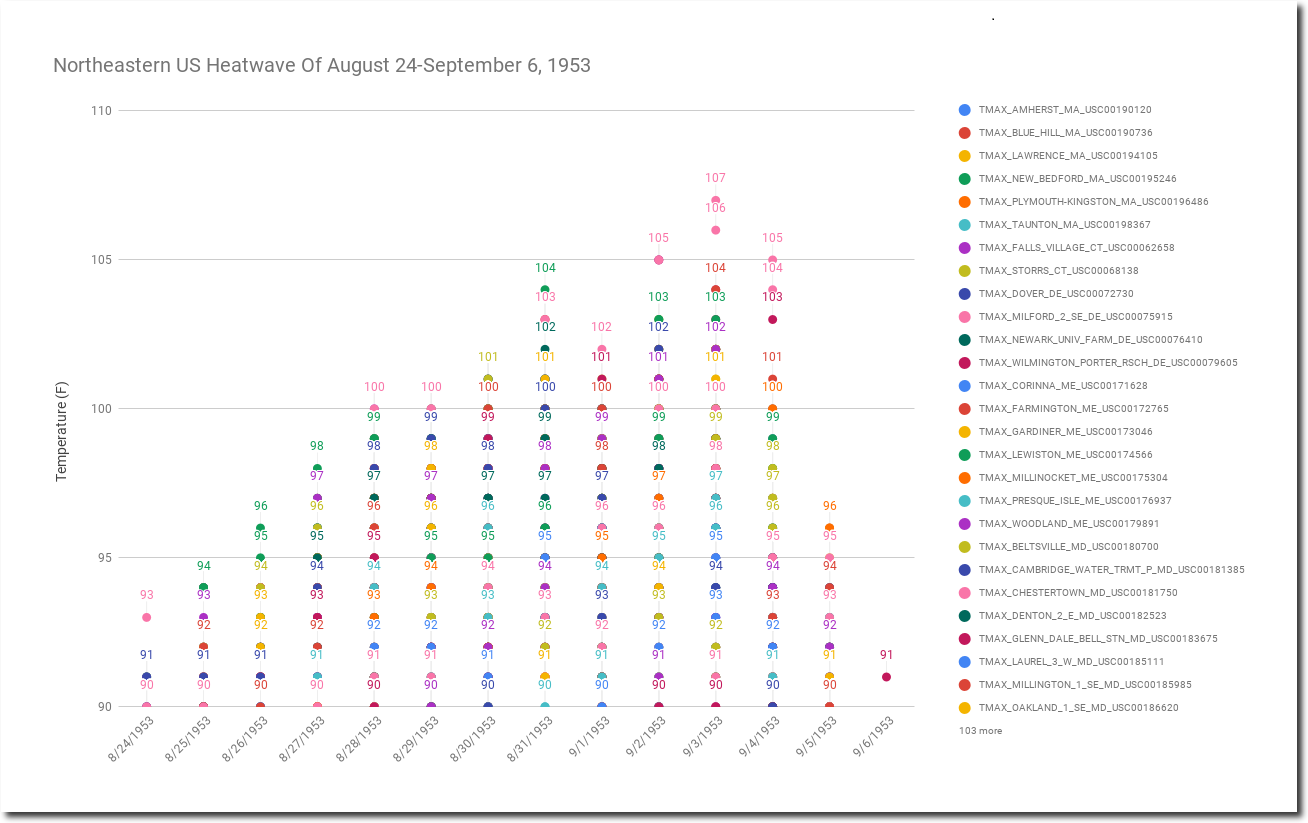
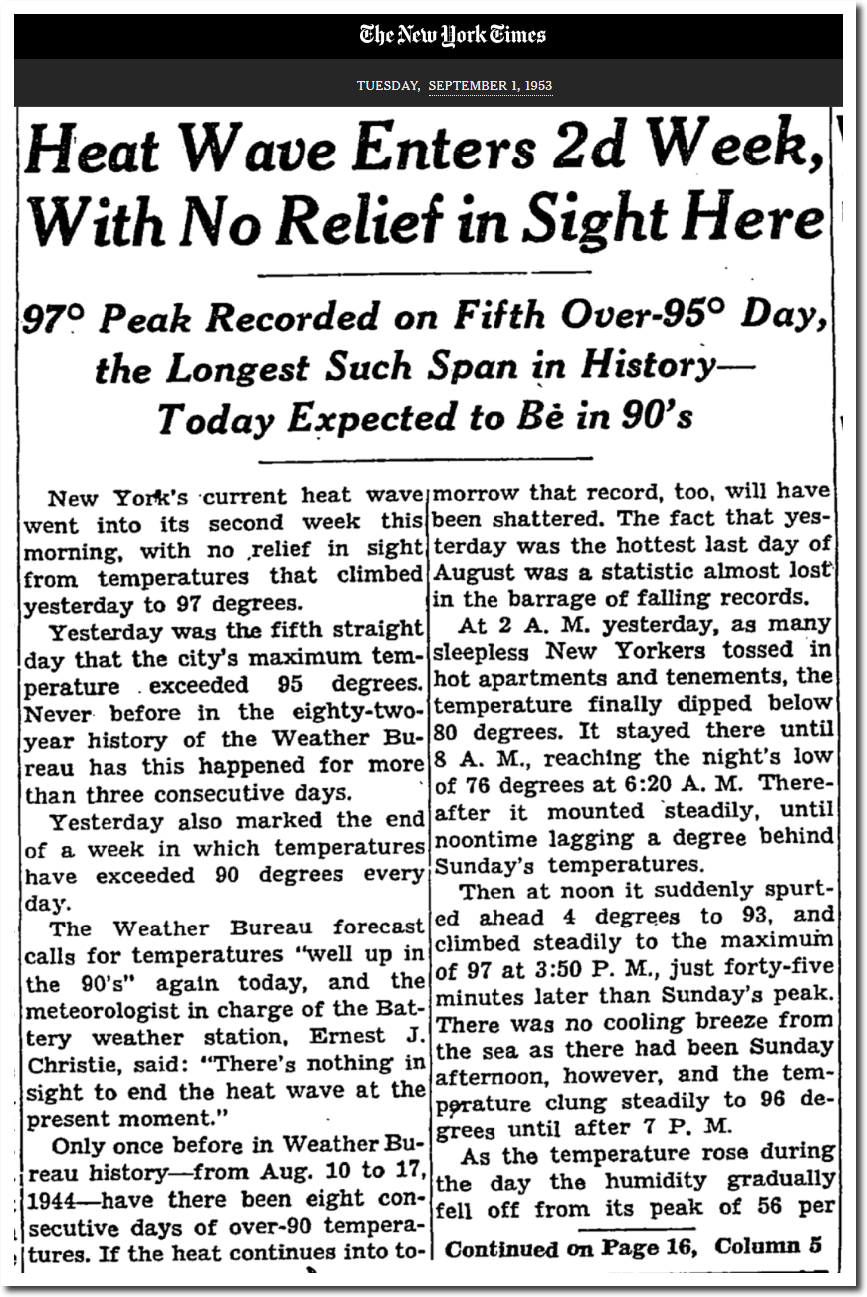
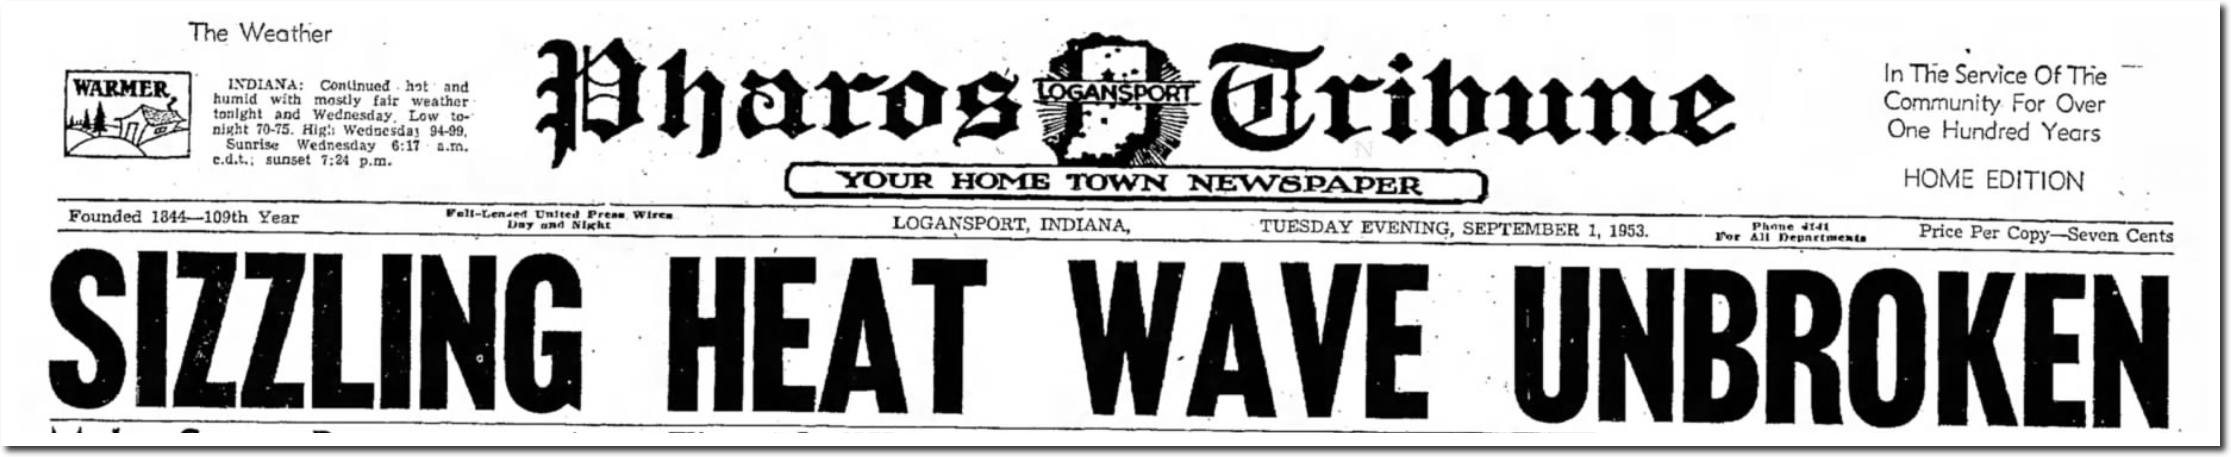
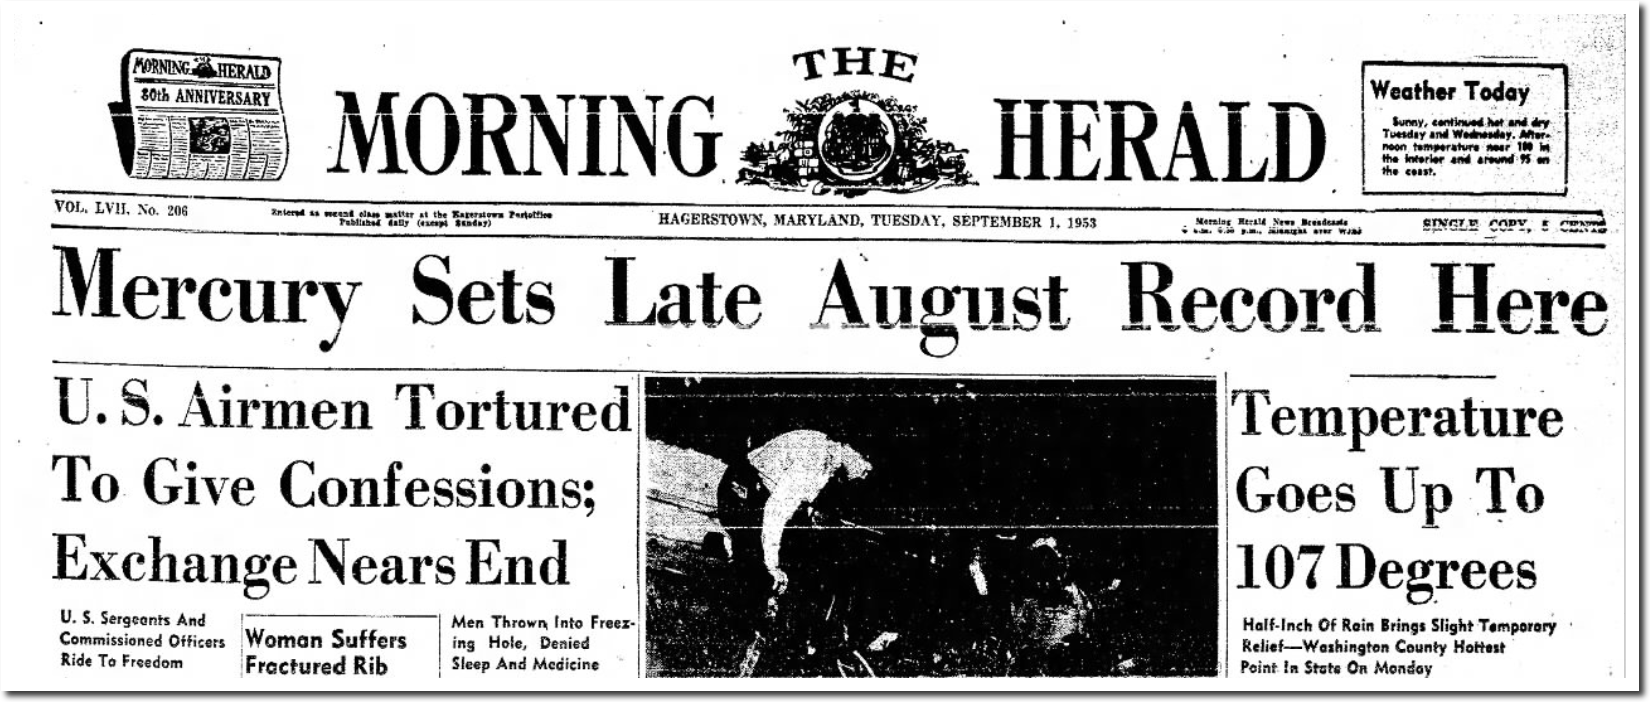
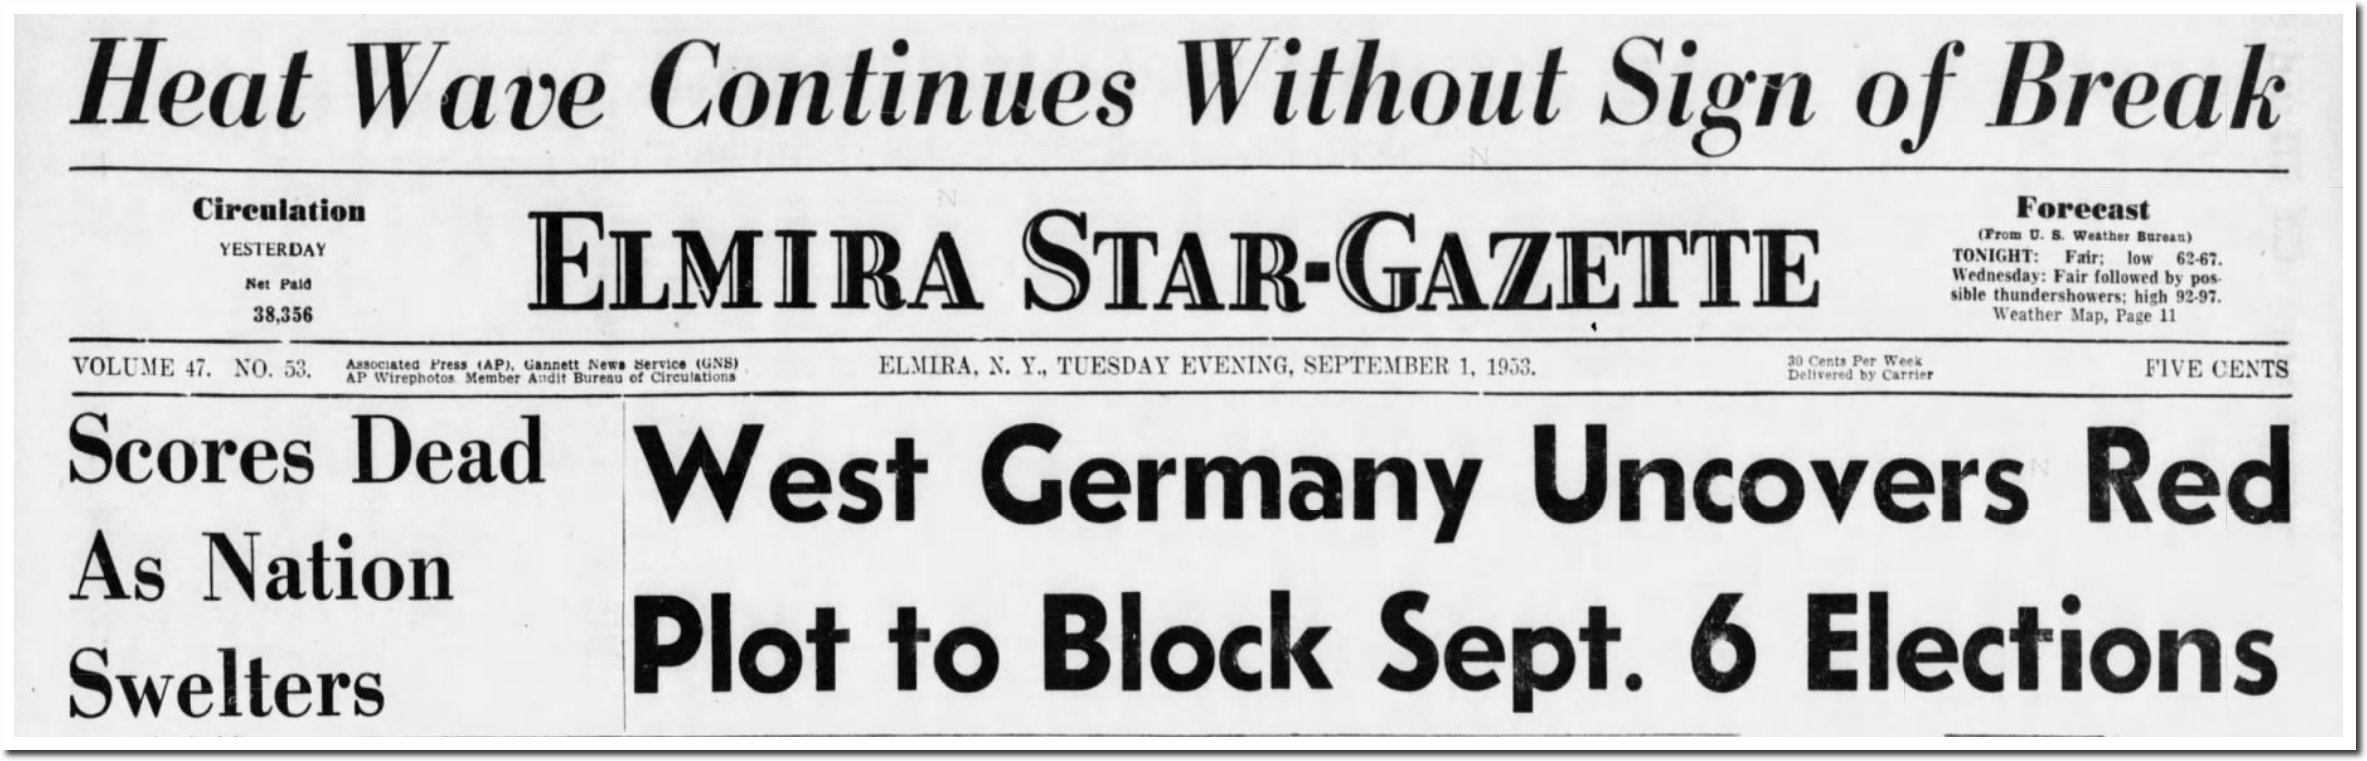
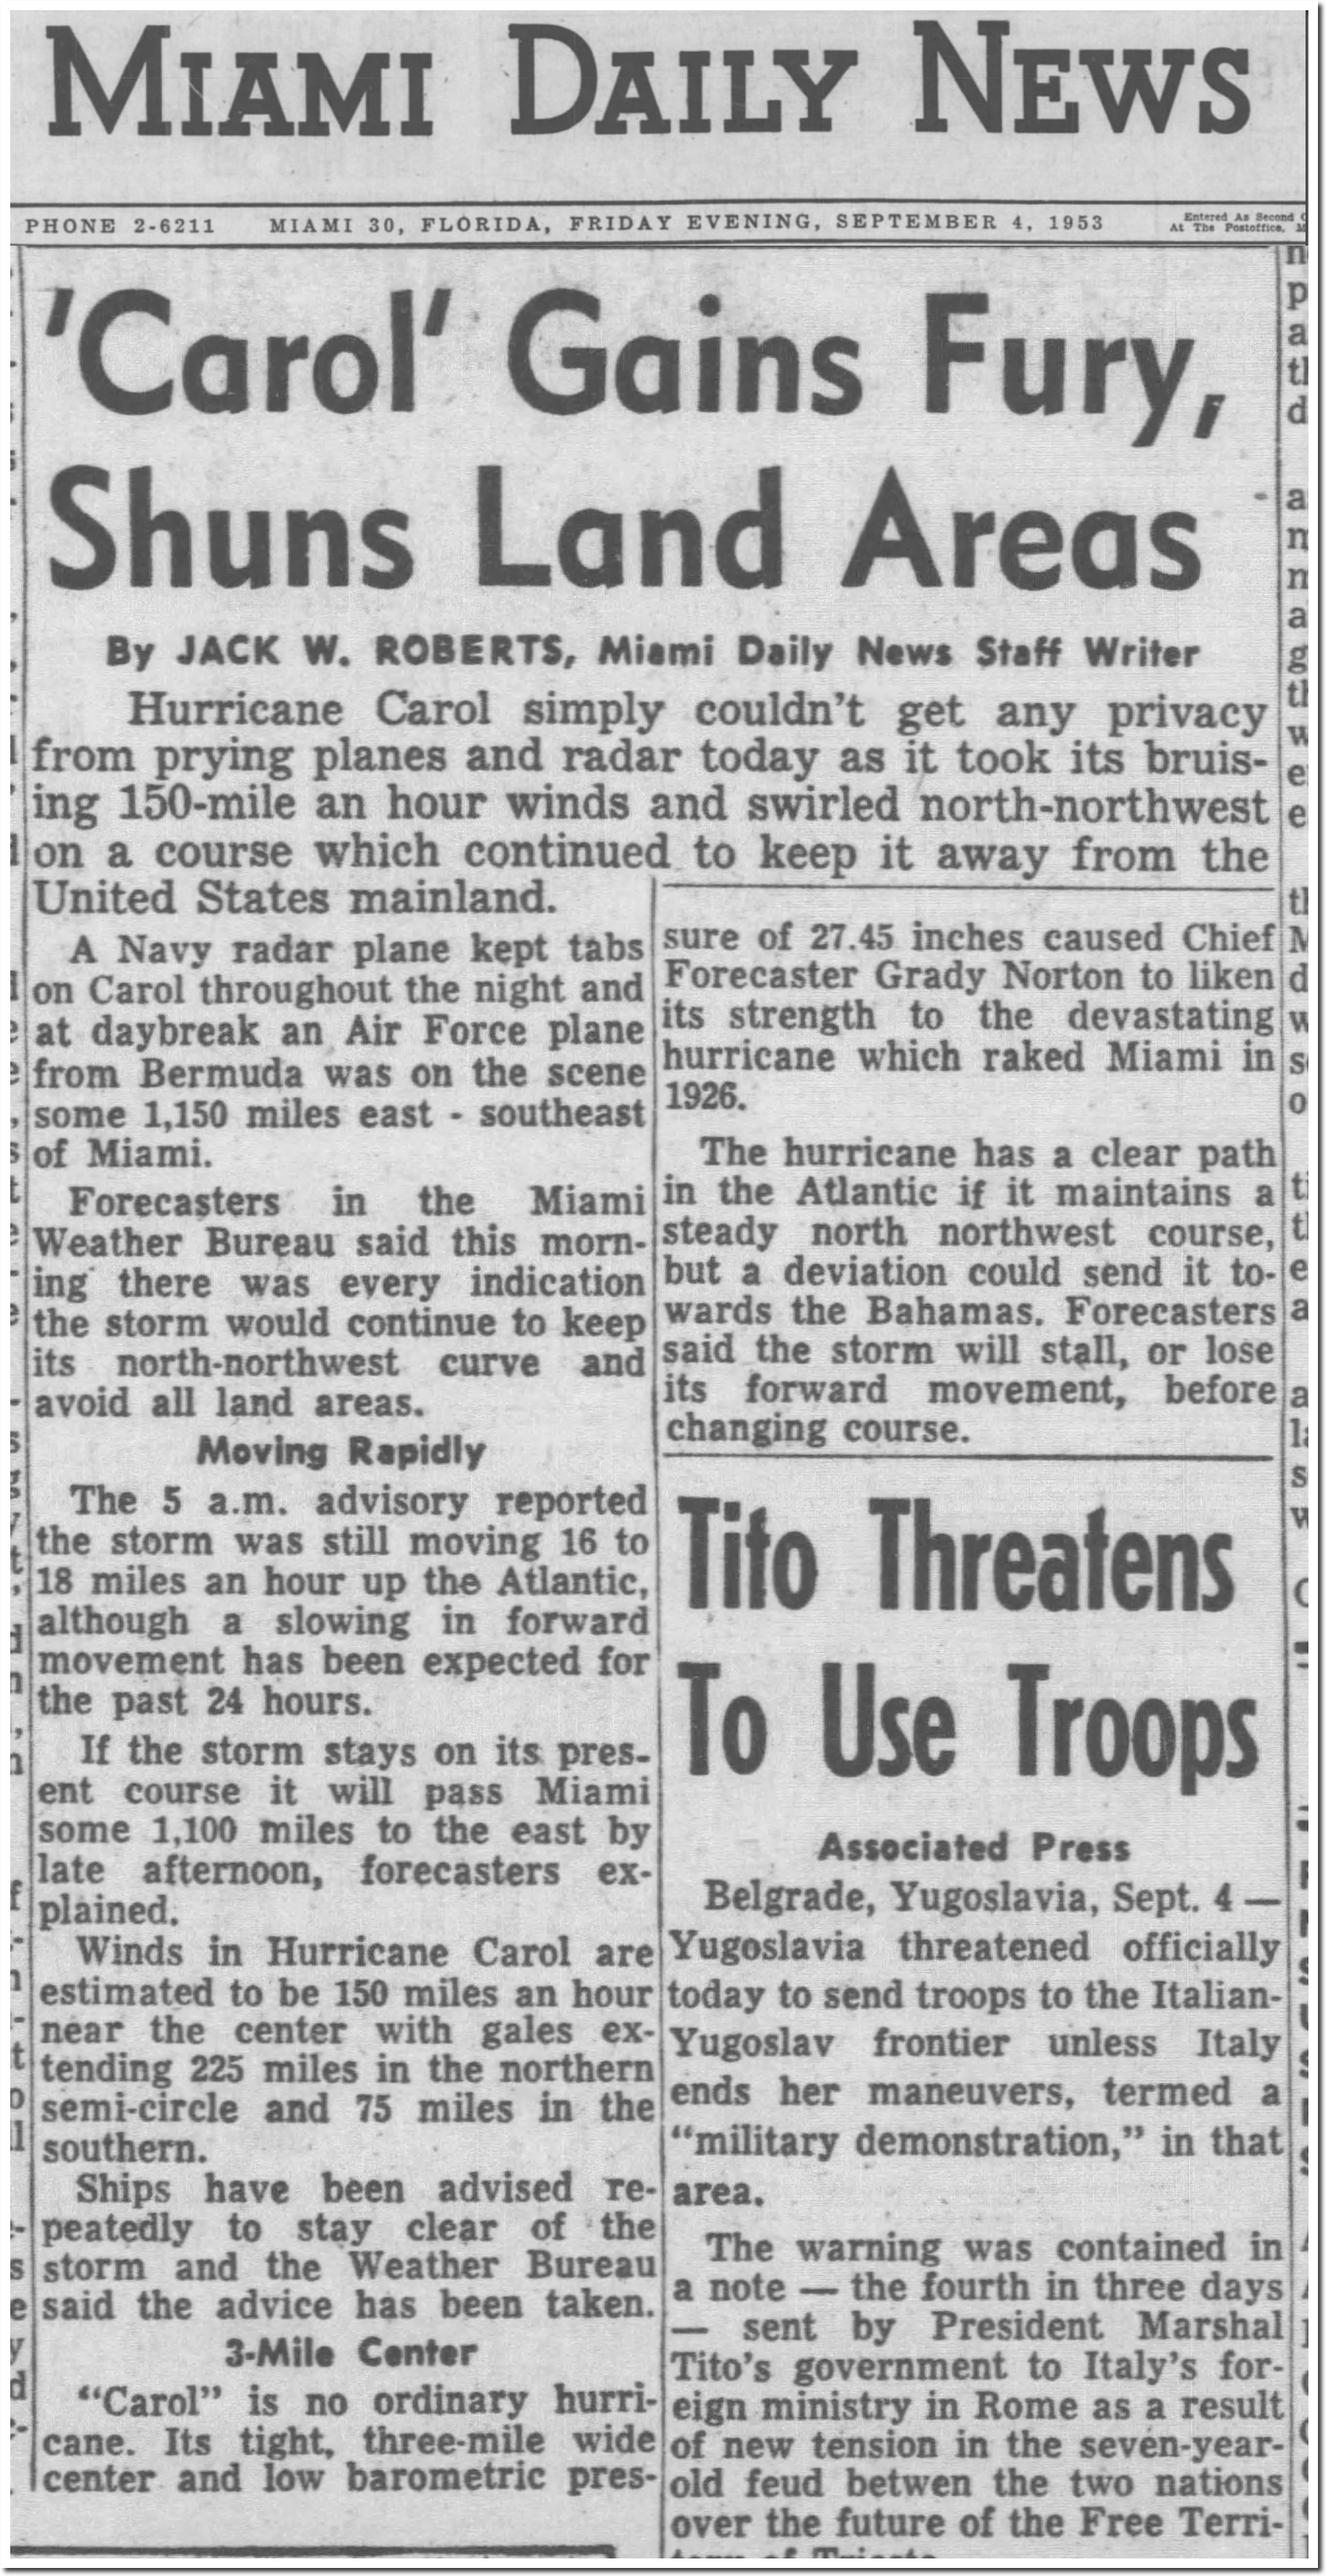
In the movie Groundhog Day, every morning Bill Murray wakes up and lives exactly the same day as he did before. That is the life of climate alarmists. Thirty years ago they said unless you stopped buying fossil fuels, New York would drown, Phoenix would melt in 115 degree weather, Hurricanes would batter the Gulf Coast, the farm belt would dry up, and forest fires would blacken “thousands of acres.”

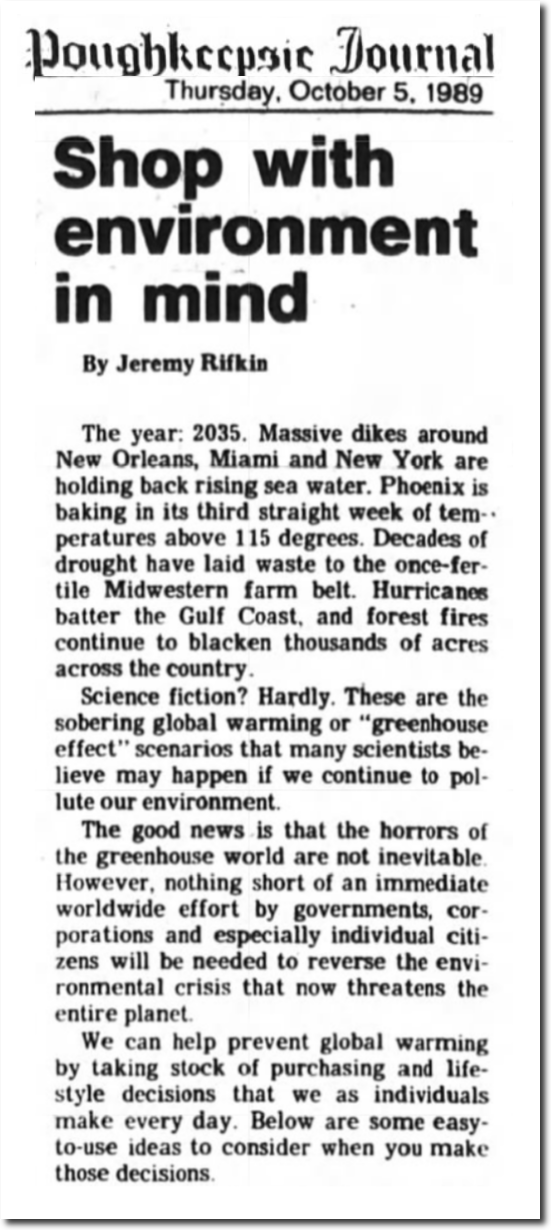
05 Oct 1989, Page 4A – Poughkeepsie Journal at Newspapers.com

Their evidence was based on blaming every bad weather event on on global warming.

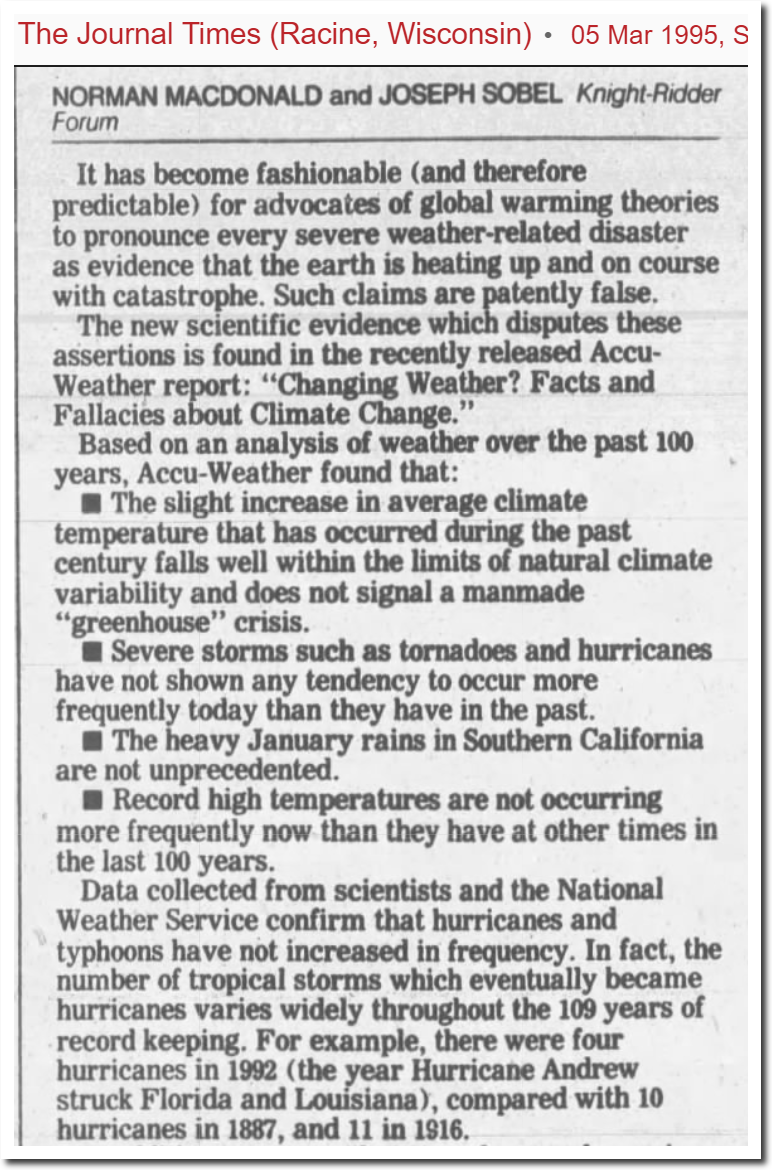
05 Mar 1995, 13 – The Journal Times at Newspapers.com

Nothing about their belief system has any basis in science, and they have been doing the same thing day after day for decades.

The corn belt is getting wetter, and year after year is seeing record crops.

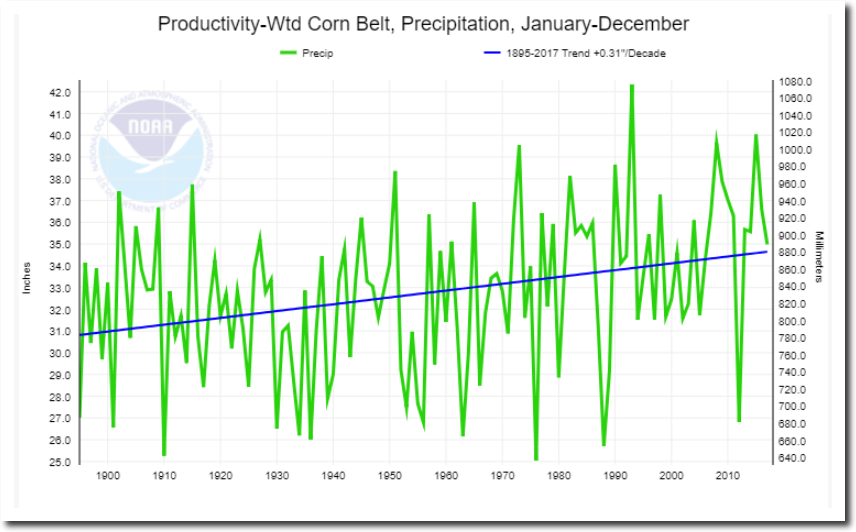
Climate at a Glance | National Centers for Environmental Information (NCEI)

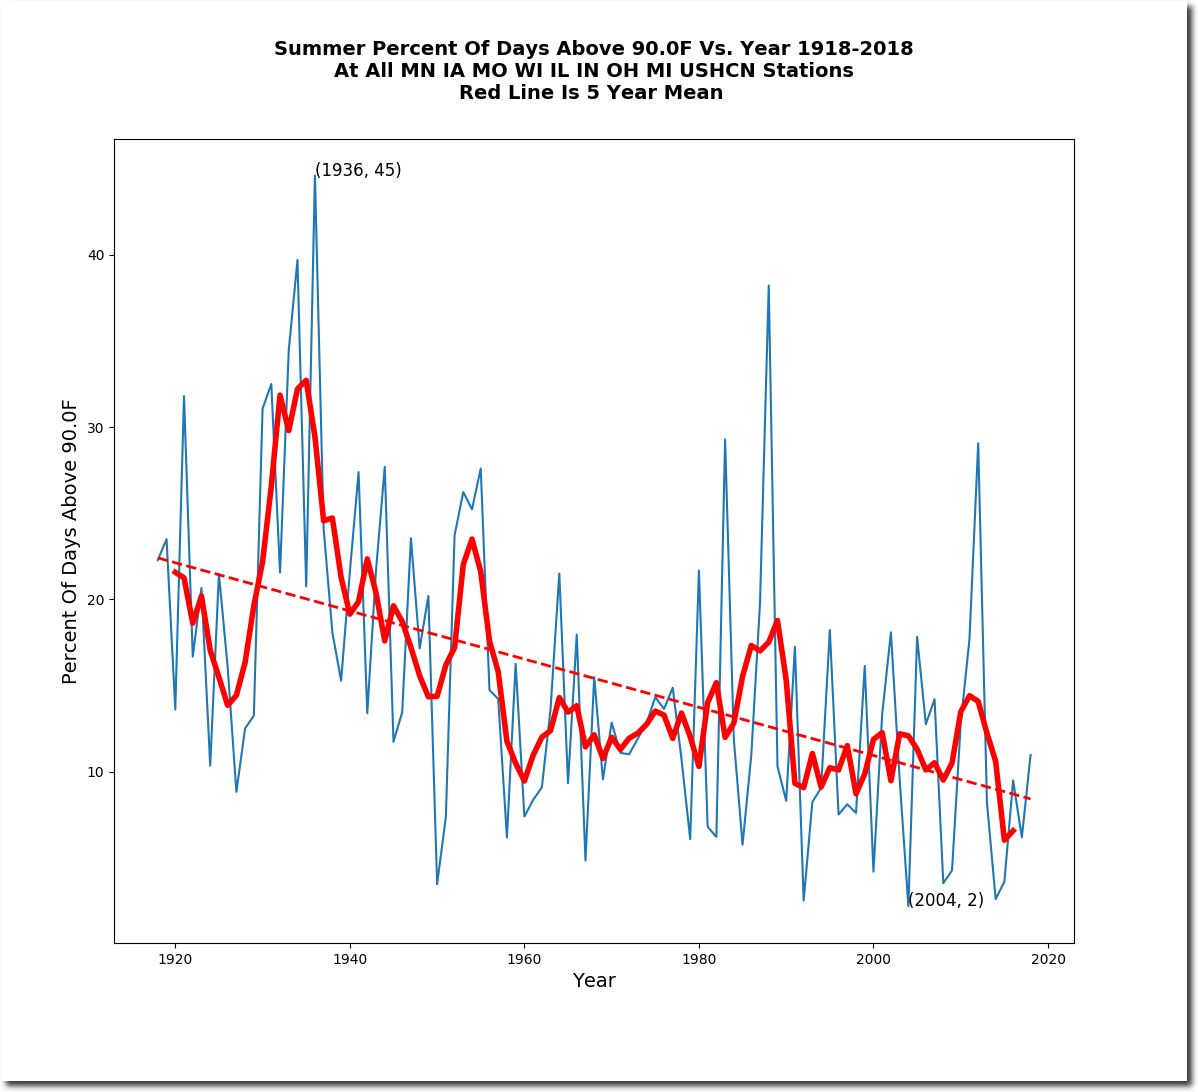
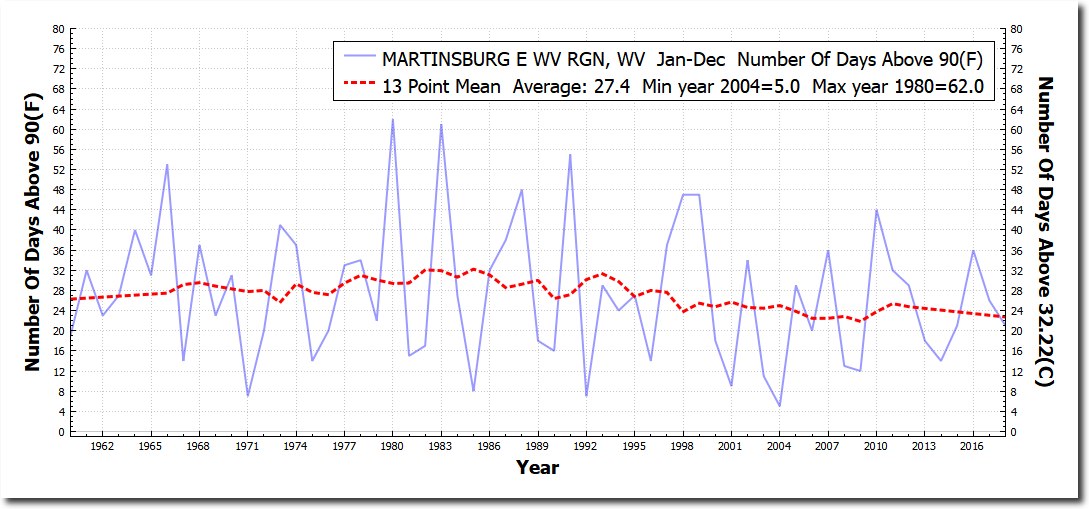
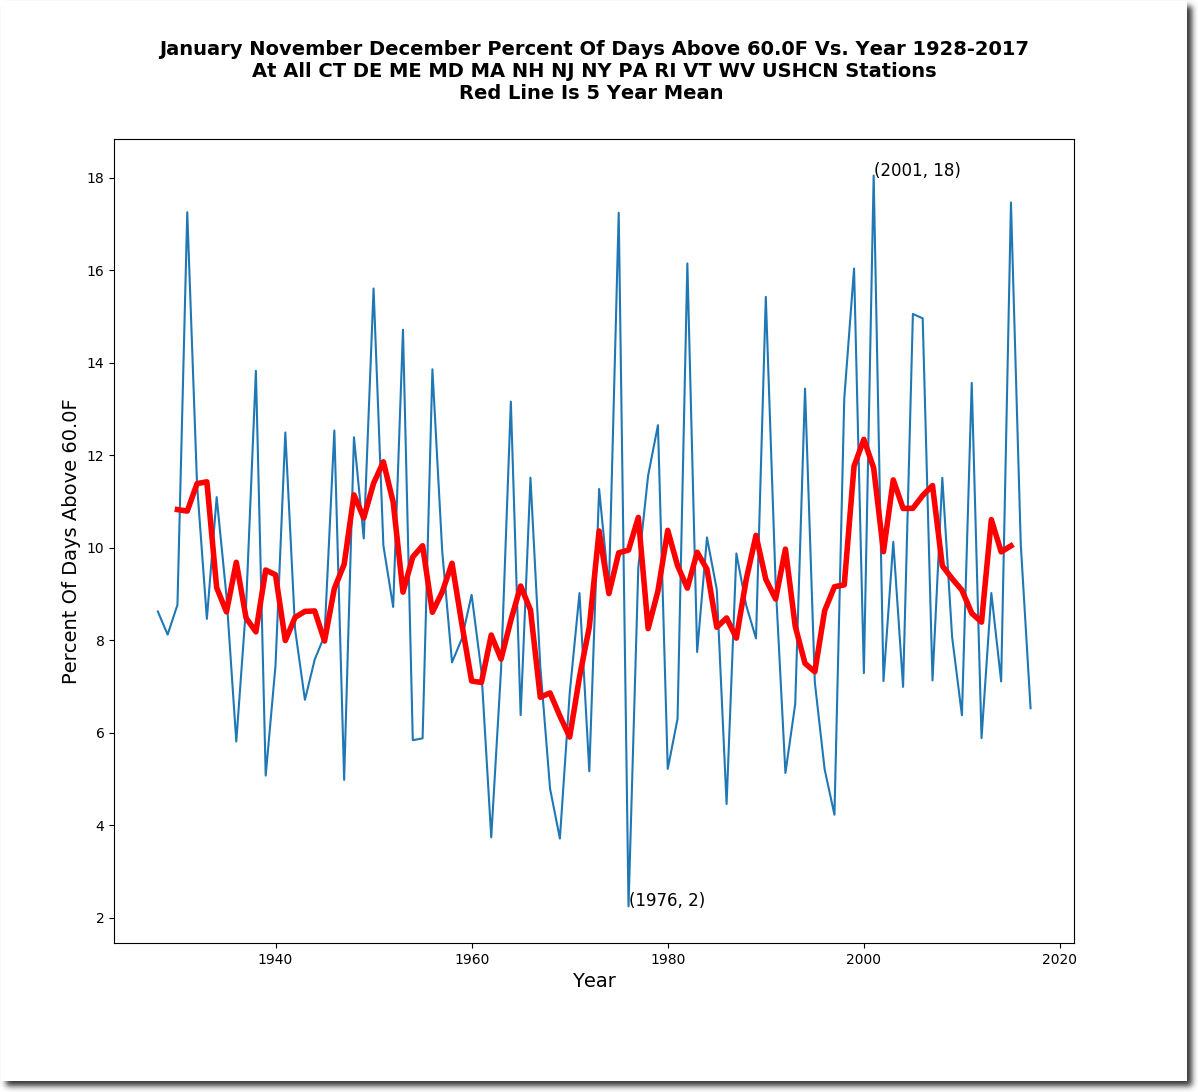
Midwest summer afternoons are getting cooler, and the frequency of hot days is declining.

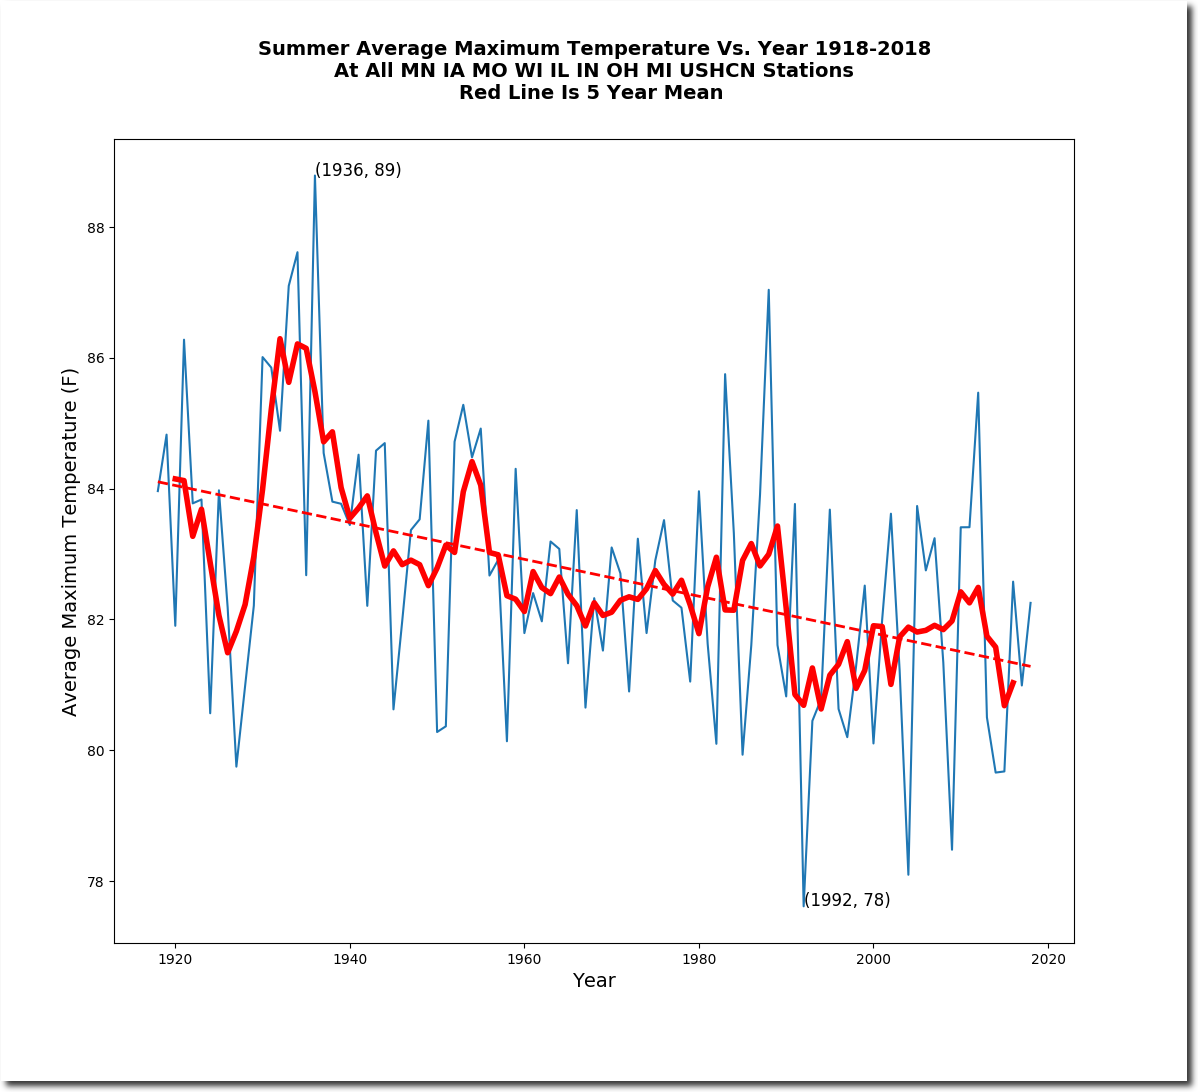
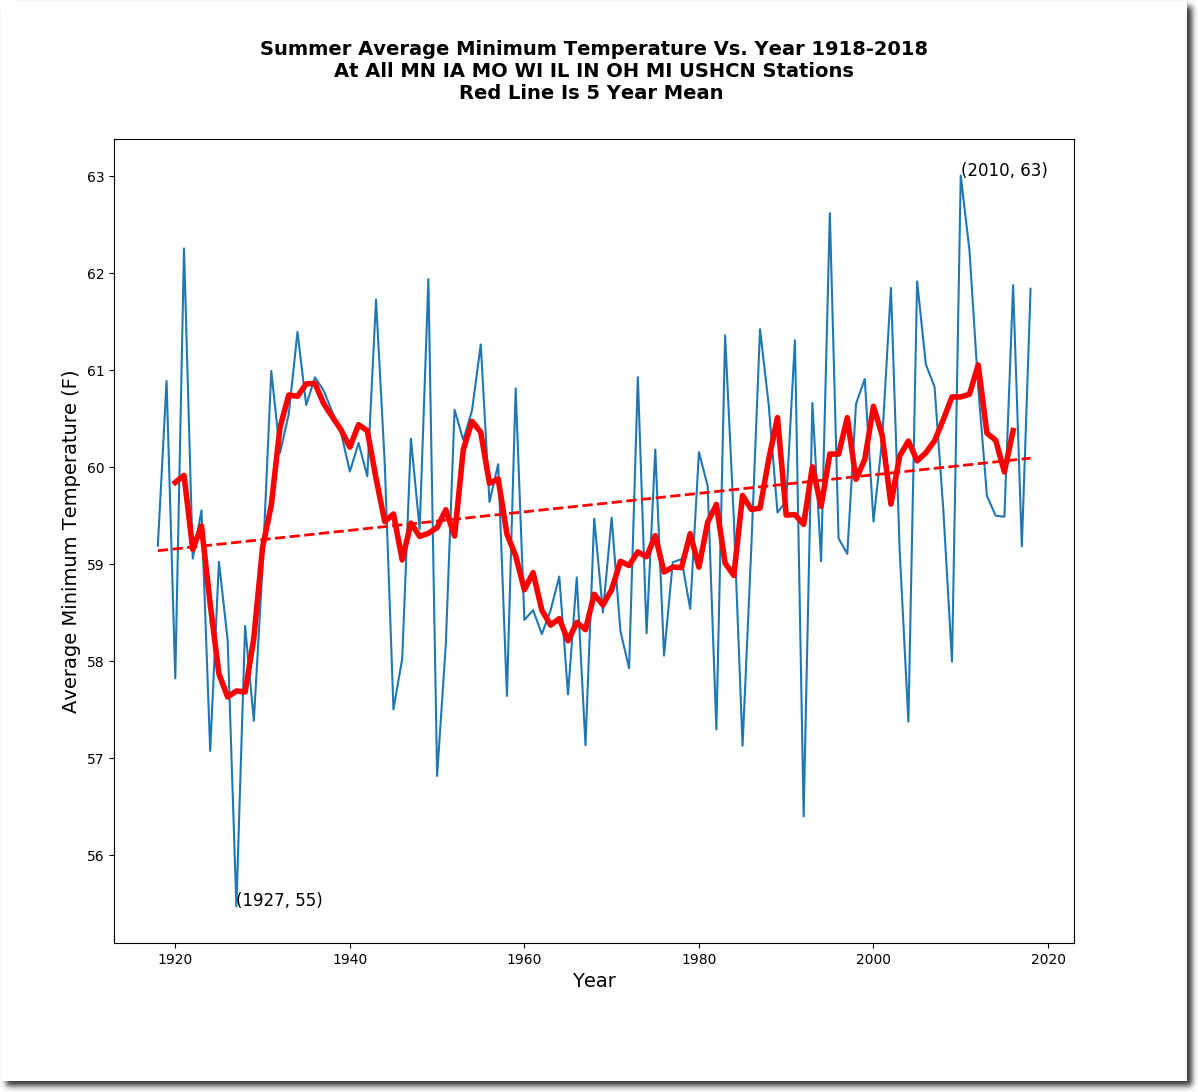
Midwest summer nights are about the same as they were 80 years ago. Corn likes warm nights.

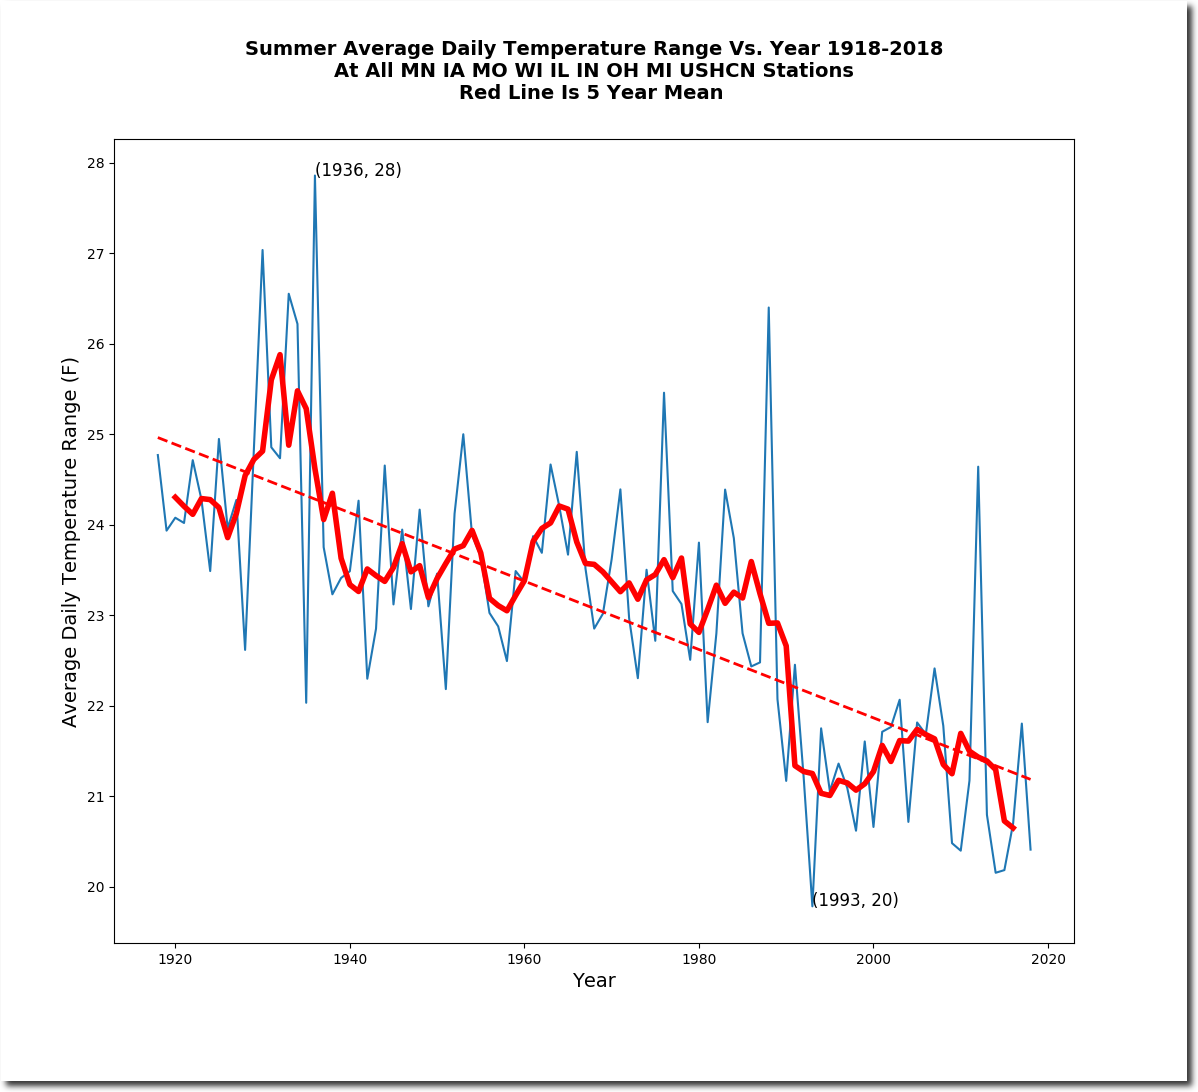
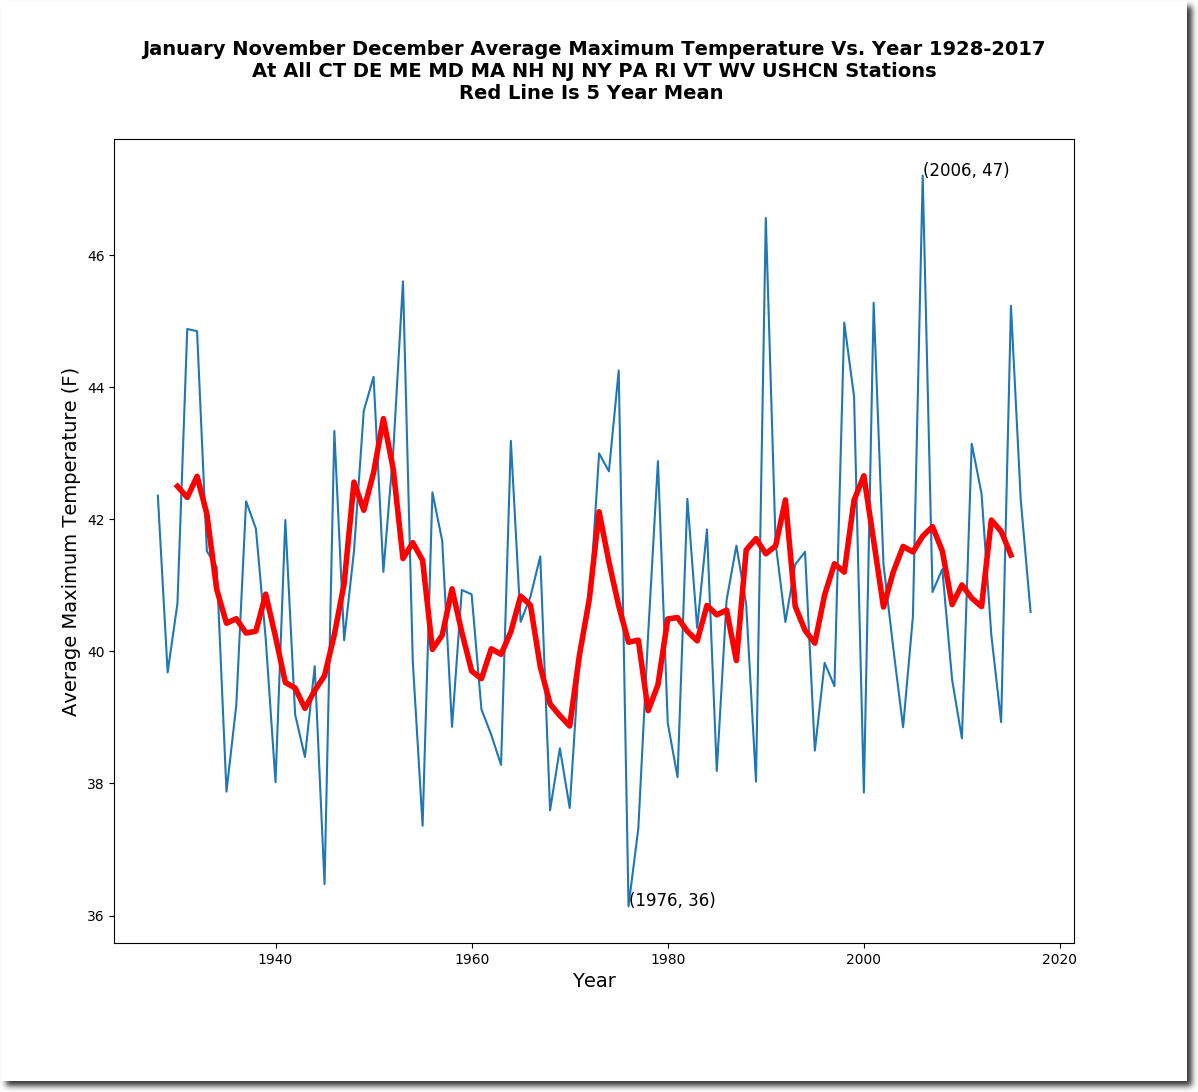
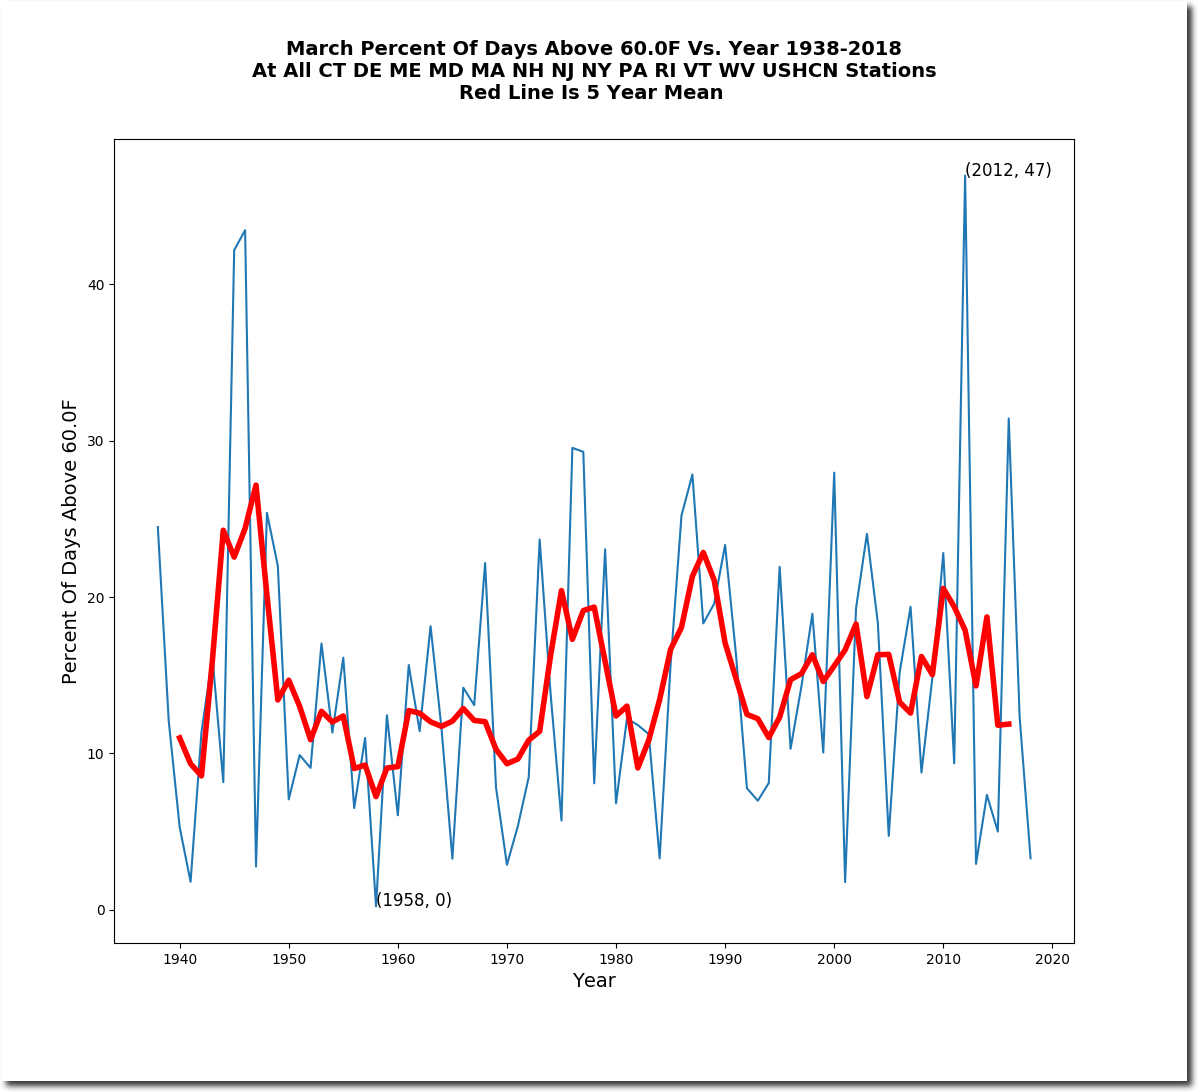
The average Midwest summer daily temperature range has dropped about four degrees, indicating a milder climate.


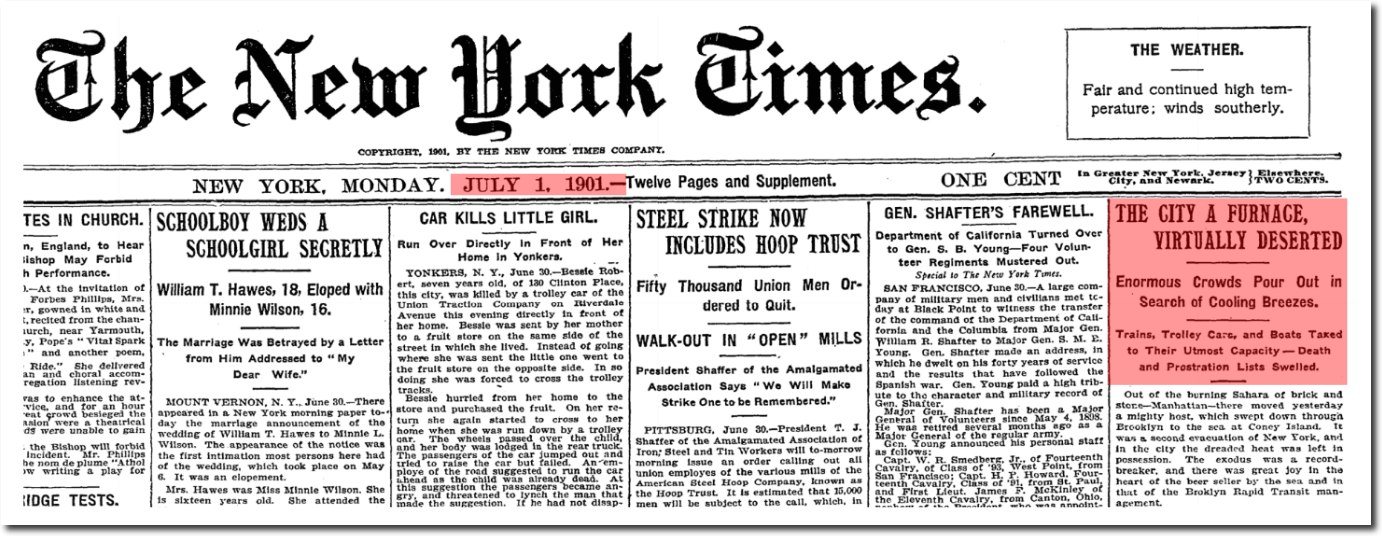
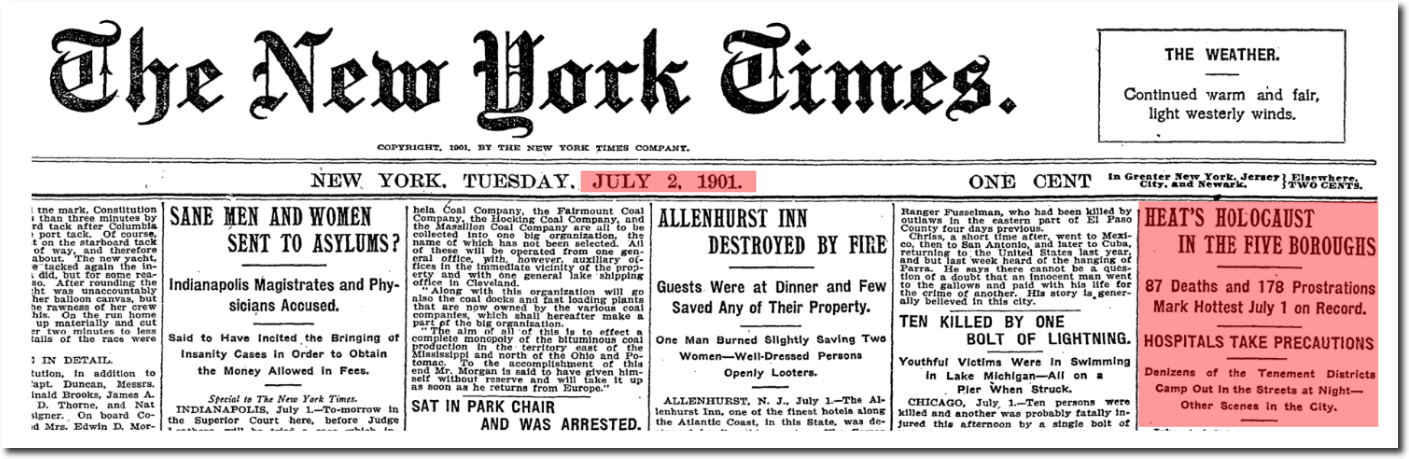
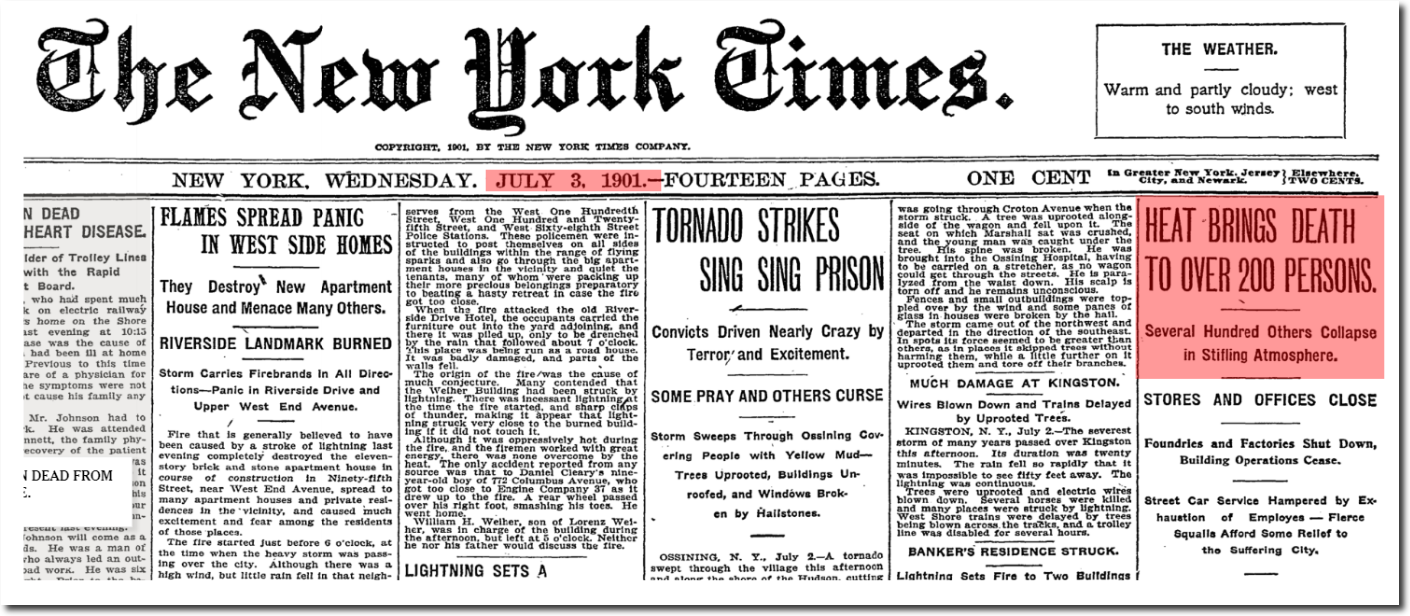
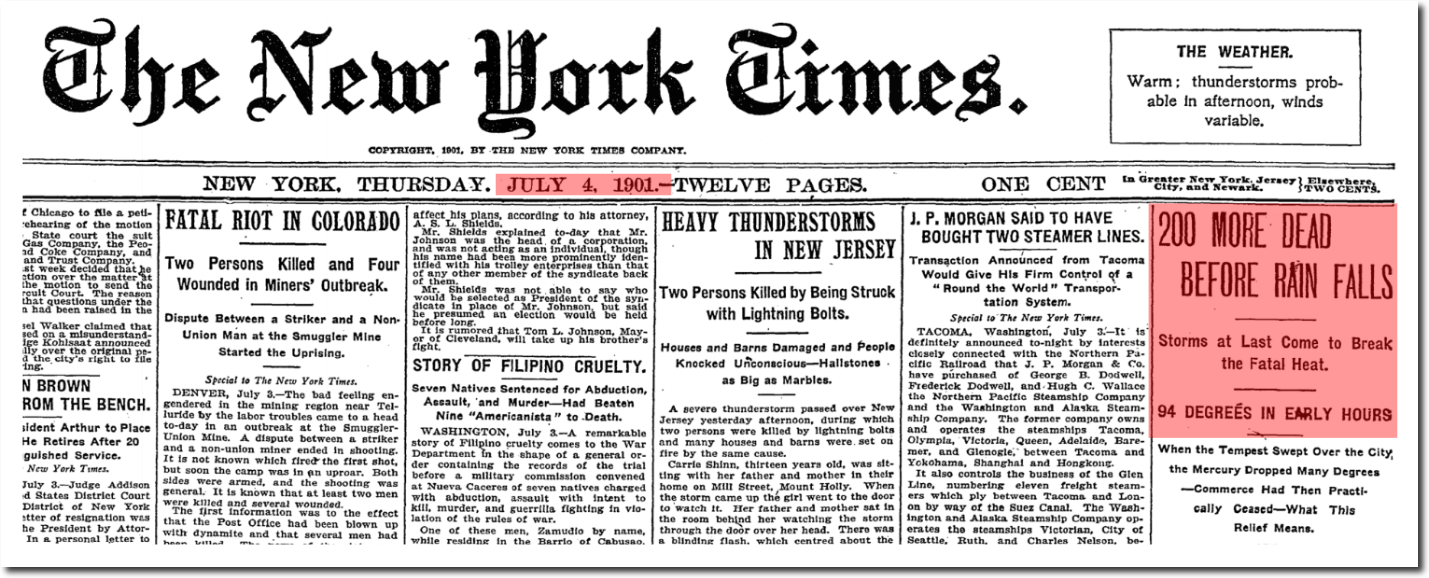
Coney Island, NY looks about the same as the first time I went there 60 years ago.

EarthCam – Coney Island Cam

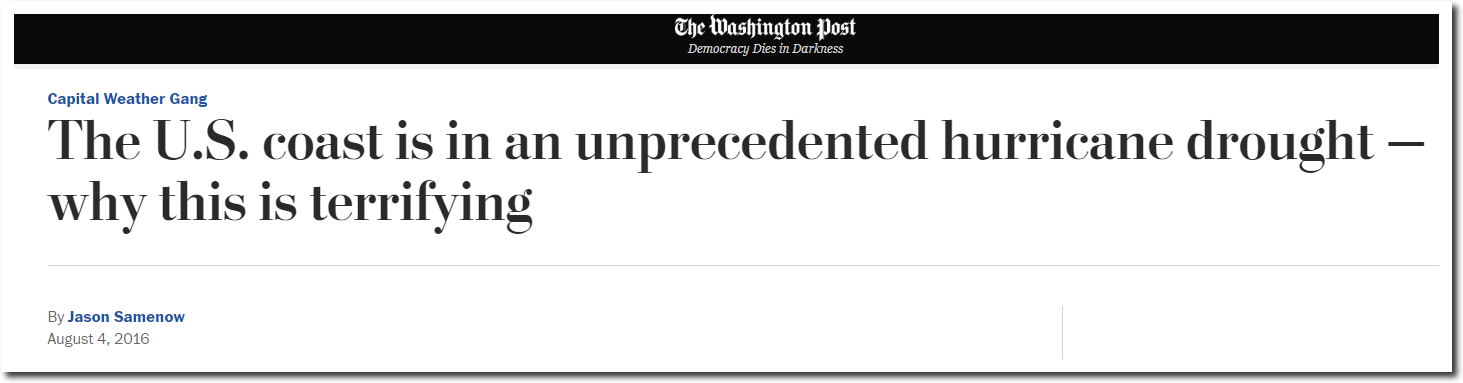
The press is now terrified by the lack of hurricanes, the exact opposite of what they were terrified about 30 years ago.

The U.S. coast is in an unprecedented hurricane drought — why this is terrifying – The Washington Post

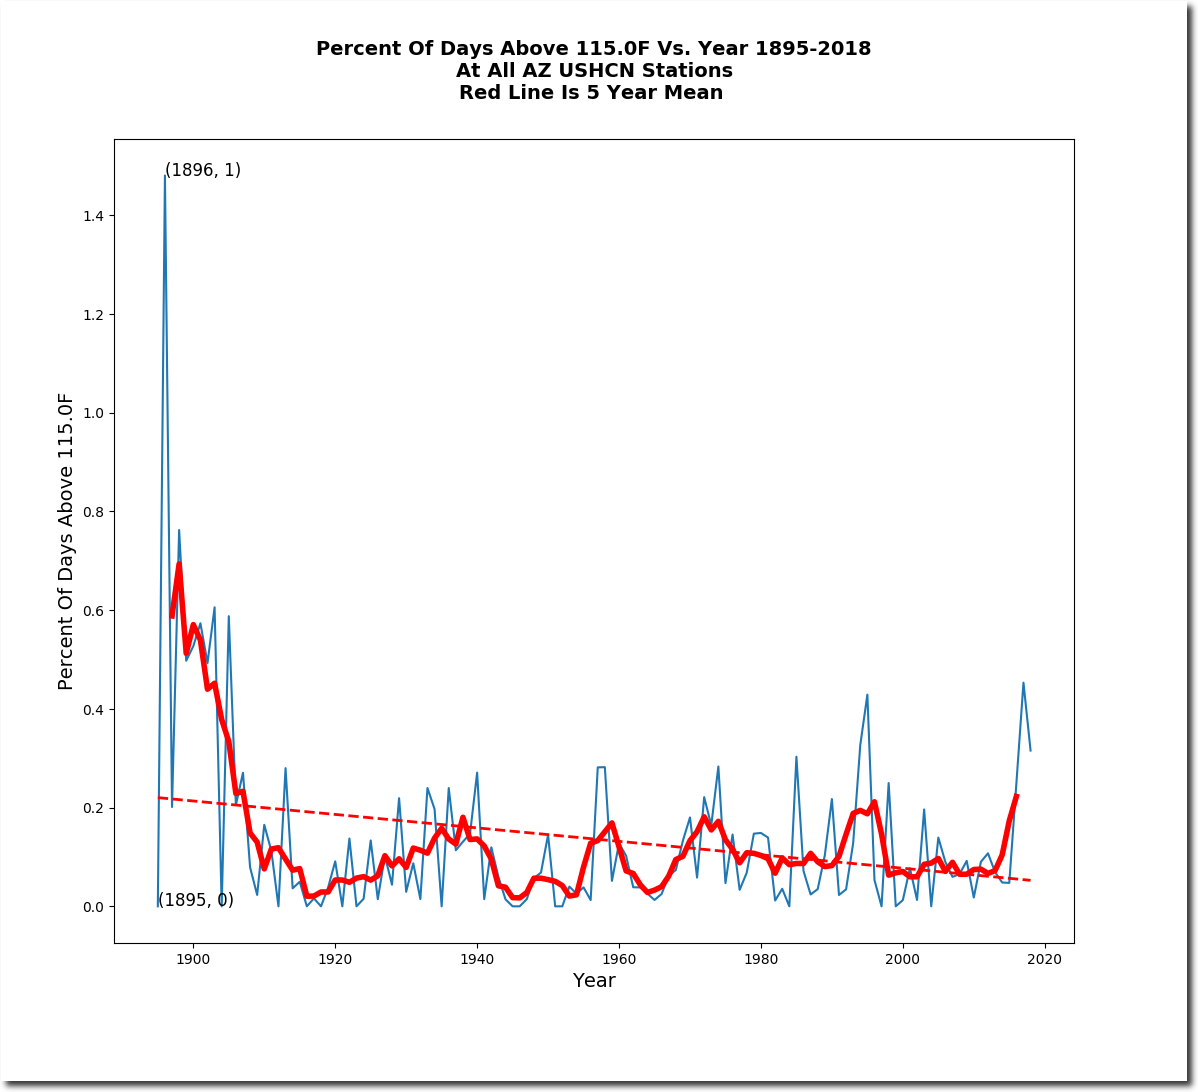
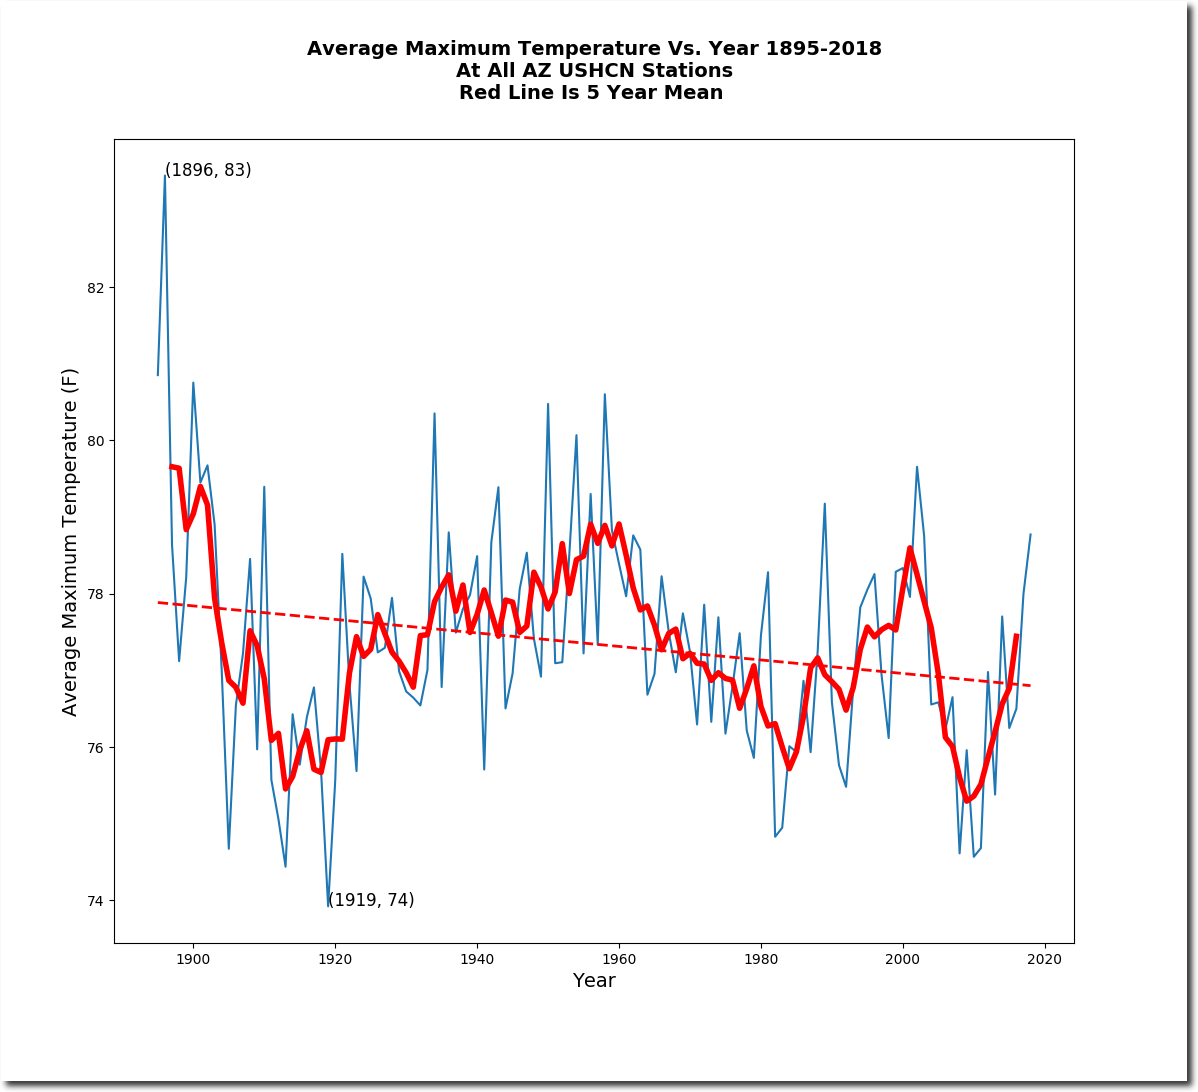
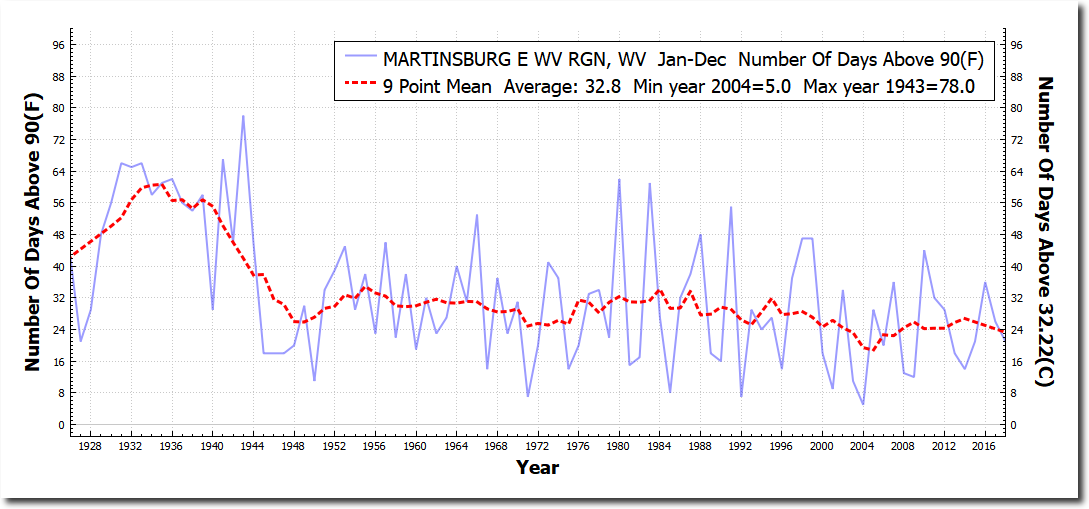
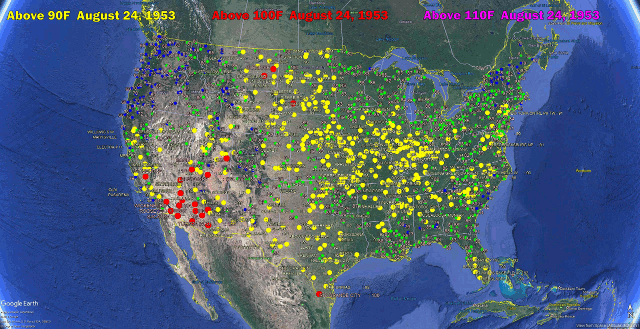
Arizona maximum temperatures and the frequency of summer days peaked in 1896, and have been declining ever since. I started school at ASU in 1974, at the peak of the ice age scare.  That summer Phoenix set their record of eighteen consecutive days over 110 degrees.

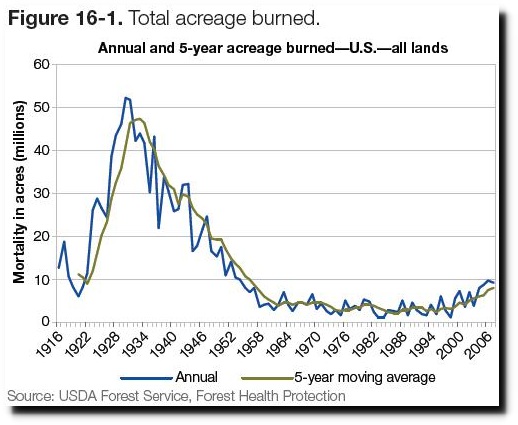
And forest fire burn acreage is down 80% over the past eighty years.

Indicator 3.16: Area and percent of forest affected by abiotic agents

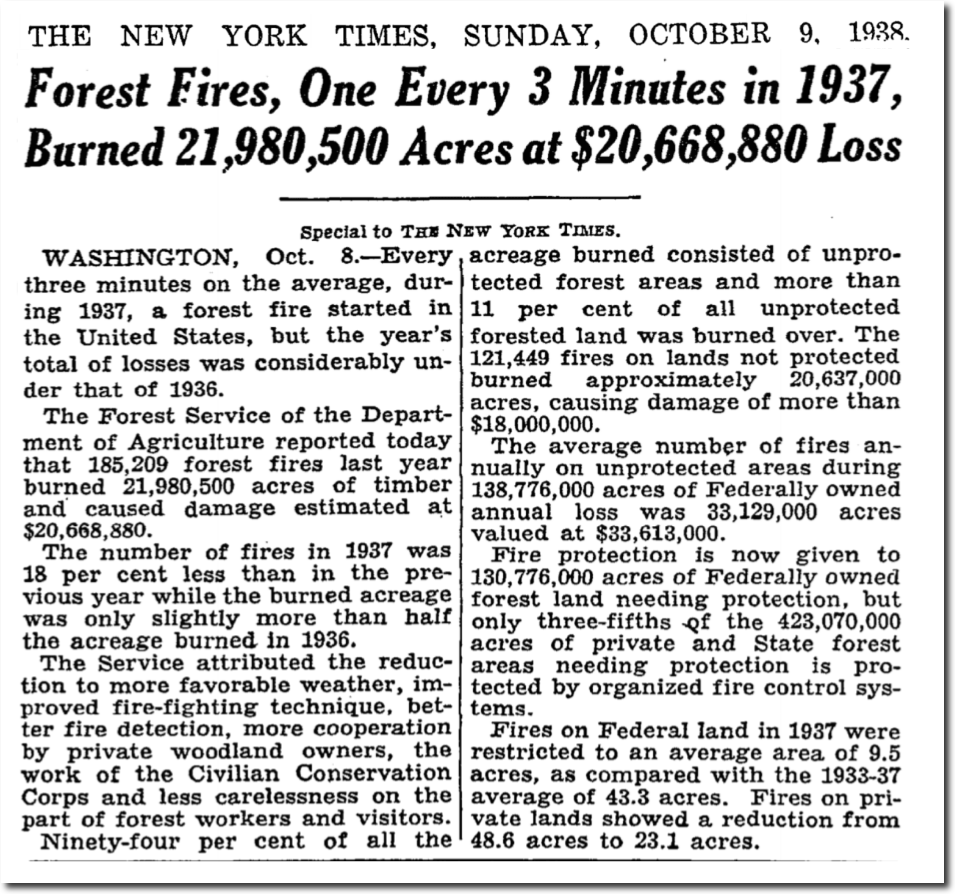
There were 185,209 fires in 1937, and more than 200,000 in 1936.

October 9, 1938 – NYTimes

Nothing which climate alarmists believe has any basis in reality, but they continue pushing the same nightmare day after day, year after year, and decade after decade.  Global warming belief is mental illness, not science.

Posted in Uncategorized | Leave a comment

More Off-Scale Fraud From The New York Times

The New York Times has become completely shameless with their climate fraud. They have a new web page which claims to show the increase in the number of 90 degree days “Than When You Were Born.”

The first place I tried it our was Martinsburg, West Virginia, which NOAA has data for back to 1926.  I entered 1926 into the New York Times web page, and a disclaimer popped up saying they don’t have any data before the 1960’s.

How Much Hotter Is Your Hometown Than When You Were Born? – The New York Times

Then they claim the number of 90 degree days has increased since 1960 from 21 to 27.

This is completely fraudulent.  According to the official NOAA temperature record, the number of 90 degree days at Martinsburg has decreased from 25 to 23 days per year since 1960. The New York Times graph bears no resemblance to the actual data.

But the New York Times fraud gets much worse.   Since the 1930’s, the frequency of 90 degree days is down by more than 60%.  No wonder they cut out the pre-1960’s data, which is readily available from the NOAA web site.

Instead of showing the actual large decline in the frequency of 90 degree days, they show an imaginary projected increase based on computer models – which don’t understand the past, much less the future.

So why did the New York Times cut out all data before 1960? Because 1960 was the low point since 1895. Journalistic fraud doesn’t get much worse than that.

Temperatures were very hot before 1960, as reported in the New York Times.

1896 Heatwave

Australia also had their worst heatwave on record during January of 1896.

TimesMachine: August 18, 1896

The 1901 heatwave killed thousands of people.

The 1911 heatwave killed thousands of people in New England and across the country.

Soviet Pravda had an 80% rule. Eighty percent of their propaganda had to be credible.  The New York Times is operating far below the old Soviet standard.

Posted in Uncategorized | Leave a comment

“Thing Of The Past” Causing Problems In Scotland

BBC Scotland News on Twitter: “Bad winter weather blamed for 22% rise in complaints to Scottish Borders Council 

Posted in Uncategorized | Leave a comment

Follow Bill Nye And Michael Mann To Keep Abreast Of The Latest Advances In Junk Science And Superstition

Steve Goddard on Twitter:

Posted in Uncategorized | Leave a comment

End Of The World Gets Pushed Back Another 20 Years

Steve Goddard on Twitter: “According to the @washingtonpost and @NASA, we were supposed to be in an ice by 2020

Mercury News: Search Results

Posted in Uncategorized | Leave a comment

Rewriting History At The Ministry Of Truth

“Who controls the past controls the future. Who controls the present controls the past.”

? George Orwell, 1984

Usually I focus on how the climate mafia rewrites historical climate data, but they are just as willing to rewrite people’s words.  On the eve of the election August 16, 2010, Julia Gillard said “There will be no carbon tax under the government I lead.”

Six months later she introduced a carbon tax.

Gillard unveils carbon price details – ABC News (Australian Broadcasting Corporation)

She wasn’t quite as good at lying as her boyfriend Barry.

So the press simply rewrote what she said, adding “but let me be clear: I will be putting a price on carbon and I will move to an emissions trading scheme.

In his sights: Covert Kevin’s mission to get Julia

The “but let me be clear” phrase was actually an Obama favorite.  Gillard never said anything like that.  Here is the actual conversation.

There seems to be no limits on how corrupt and dishonest the left and their propagandists in the press are willing to be.

Posted in Uncategorized | Leave a comment

The Heatwave Of August 24-September 6, 1953

The US had an unprecedented late summer heatwave from August 24 to September 6, 1953. The animation below shows the progression of the heatwave.

Lawrence, Massachusetts was eight degrees warmer than this years’ fake “record heat.”

The Northeastern US recorded 1,097 temperatures over 90 degrees, 546 over 95 degrees, and 129 over 100 degrees between August 24 and September 6, 1953.

TimesMachine: Tuesday September 1, 1953 – NYTimes.com

01 Sep 1953, Page 1 – Logansport Pharos-Tribune at Newspapers.com

It was 107 degrees in Maryland.

01 Sep 1953, Page 1 – The Morning Herald at Newspapers.com

Scores of people were dead from the heat, and communists were hacking elections.

01 Sep 1953, 1 – Star-Gazette at Newspapers.com

And Hurricane Carol was headed towards North America with 150 MPH winds.

02 Sep 1953, 1 – The Miami News at Newspapers.com

04 Sep 1953, 1 – The Miami News at Newspapers.com

If we had a repeat of 1953, climate scientists would be 100% certain it was your fault, and demand immediate world communism.

People were imagining climate change in 1953, and some scientists were (of course) blaming coal and oil.

FUNNY WEATHER WE’VE BEEN HAVING THESE PAST FEW YEARS!

WHAT’S GOT INTO OUR SEASONS?

By the Sunday Mail Research Bureau   July 19, 1953

Funny weather we’ve been having these past few years! Last summer in Sydney it was so cold that ice cream sales dropped 50 per cent below normal. Melbourne had similar trouble. The seasons have become so tangled in Queensland ‘that retailers are seriously considering the alteration of traditional dates for launching seasonal selling campaigns.

Are our seasons changing? If so, why? The CSIRO has tangled with these questions and produced answers for at least the south-east portion of Australia— portion of SA, Victoria, and ‘. Southern NSW. In those regions over the past 35 years, the days have been growing cooler and the summers wetter. Researchers found that aver age maximum day -temperatures 35 years the days have been between two to four degrees lower than in a – corresponding period the year before. Summer rainfall in the South east has increased 20 to 30 per cent over , the same period. This looks a very exciting discovery until the scientists point out that a couple of decrees hardly matter a jot.

On ‘a warm day just try picking the difference be tween 79 and 81 degrees and you’ll see the point. The CSIRO people’ measured over a span of -70 years. Take a wider span of 90 years and you find that in Melbourne over the first 58 years of that period the aver age temperature was 58.5 degrees. The average over the whole 90 years was 58.5 degrees. Exactly the same! Sydney can sing; a similar song to this.- For the last 50 years average mean temperature had been 63.5 degrees, for the 50 years before that it was 63 degrees. Our seasons are changing a trifle, but only a negligible trifle.

THE GOOD OLD DAYS

WHAT makes us mistake that the change is consider able is the outpourings of old timers who remember ”end-less, sunshine’ in their youth and forget, the rainy days. That, plus the fact that the present is always far more real than the past for the rest of us. A couple of late springs, in a row will convince most people that spring has been playing up for years. To discover significant climatic change you must study centuries and not decades. Then you’ll find that the world has been slipping in and out of little ice ages’ for several thousands of years. At the moment we’re slipping out of one. The process is very slow and undramatic in any period much less than a century. Few effects are visible in Australia, but there are significant changes going on in the northern hemisphere. Europe has become about two degrees warmer in the past 50 to 100 ‘ years. The glaciers are slowly melting and receding. As a result the sea has risen 39 thousandths of an inch. This rise has also been aided by pack ice melting. . Ships can move; over the White Sea for a month more each year than they could formerly. Russia’s North -Sea lanes are now open eight months a year instead of three. In Greenland, melting ice is uncovering farms abandoned by farmers when an ice age developed in medieval times. Cod, herring, and other fish are moving far into northern waters to the delight of the Eskimoes. Sub-zero temperatures are occurring . only half as frequently in northern hemisphere cities as they did previously.

CLIMATIC MOVEMENT SINCE 1850 half the water in the Great Salt Lake in Utah, USA, has evaporated. All this represents the first big climatic movement man . has been able to measure with accurate Immediate observation. What has caused the heating up ? You can take your pick of a hatful of answers. Most popular is solar radiation—the sun getting hotter — but don’t insist on an explanation. The Danes say the sun’s heat has increased one quarter of one per cent in the last 20 years. Another theory is that centres of pressure in the atmosphere have altered, forcing warm air north to meet the ice. Johns Hopkins University experts throw up a modern novel suggestion: We’re burning two billion tons of coal and oil a year. This sends six billion tons of carbon dioxide gas into the atmosphere to form a gas envelope round the earth and to prevent heat waves that come from the sun from bouncing back again. Also, there’s the proposition that ‘ subterranean heat ‘ is’ mainly responsible..’ Heat generated from radio-active substances under the earth is ever increasing and melting rock,’ etc. Most of this heat will ultimately be released in volcanic eruptions. Meanwhile, it quietly warms the earth, melting glaciers and ice. Relatively slight temperature changes in the northern hemisphere can considerably alter climate. But to the southern : hemisphere, big temperature variations would be necessary -to make a marked difference. We-haven’t any local ice to melt. We are, however, affected by what happens to the Antarctic ice . cap to our south. This cap seems to be melting a bit at the edges at present, which probably means a little more cold water is wandering our way, and a slight difference in the temperature of winds from the south. The overall effect is very small. It is only over very, very long periods that climate varies greatly on the earth. Sixty million years ago the climate on this planet of ours was just about the same as it Is right now. Scientists told the Research Bureau they -would guarantee that calculation to within five per cent either way. A hot period kept developing for 30 million years until temperate zone; vegetation was growing in ‘What we .now call the arctic circle. The earth then iced over. It heated again until a mil lion years ago when we got another ice age of 100,000 years. The sea dropped 150 feet as water turned to snow and ice. By about 10,000 BC, this ‘cold snap’ was over. A bare 5000 years ago we got another fairly cold spell when the sea dropped only 12 to 20 feet. Since then, we’ve been experiencing small and un spectacular hot- and cold cycles. When Caesar landed In England, the climate was similar to what it is now— foggy, snowy, rainy. By 681 AD it was warm and drought-stricken. By 1400 AD England was almost ice locked. Over the last 200 years England’s average temperature has never varied by more than three degrees.

Backyard climatologists in Australia felt they were on to something big after the atom bomb exploded on Monte Bello Island last year. Although it was summer, Sydney promptly froze. Melbourne’s normally windless December turned on 60 mph gales. Tasmania registered record . rainfalls. It was too cold to swim at Perth’s surfing beaches, and Queensland suffered a freakish heat wave. This surely was climate gone crazy! There was no doubting; that point. But did the A-bomb cause the conditions? Scientific answer: To keep one moderate hurricane going you would need the energy of up to 50 atom bombs per second for a period of up to a week. They didn’t explode that many bombs at Monte Bella Anyhow, why should we complain so much about our weather and climate? Both are nearly the best in the world — this side of the next ice age. Our coldest capital city is Canberra, which averages 44 degrees in winter, and holds the record low recording of 18 degrees. Call that cold? Moscow is the coldest capital in the world, averaging 14.7 de grees. (Record low minus 41 degrees.) Ottawa is 14 de grees, London 40,. Paris 38. . And the coldest spot anywhere is the Siberian village of Verkhoyansk, which once hit 95 degrees below zero. It’s only 70 degrees below at the Pole. Coldest ever recorded in Australia was 8 degrees below at Charlotte Pass, in 1945. If your complaint is that our climate gets too hot because the average summer temperature in our capitals is 72 degrees, be grateful you don’t live in Azizia. Libya, the hottest spot on earth, where 136 degrees has been recorded. Should rain be your pet aversion we have a few spots in the Commonwealth you might well dodge. They’re well up in world class. Crohamhurst in the Blackall Range, Queensland, col-lected 35.7 inches of rain in 24 hours in February, 1893. That is just under three feet of water.

RECORD RAINFALL ONLY one other place in the world has ever beaten that effort. Cherrapunji, in Assam, where 40 inches fell in 24 hours. This same Cherrapunji also holds the record for a year — 905 inches or more than 25 yards. That was in 1861. Tully, North Queensland, holds our local record for most rain in one year — 310.75 inches (over 24 feet) in 1950. To settle that trouble-making argument about which of our capital cities has the most pleasant climate, the Bureau compared them on a points system. Points were awarded for humidity, wetness, hotness. and coldness. If one city had won in all sections, it would have had the least humidity, least wetness, and would have been the coolest in summer and warmest in winter. And it would have had a total of 24 points. No capital won in all sections. Adelaide, however, came top with 18 points. It has least humidity and wetness and was middle in the list for coolness in summer and warmest in winter Perth and Hobart both came second with 15 points. Brisbane and Melbourne were equal fourth with ’13 -points ‘Sydney ran a bad last with 10 points. Still it’s not much good worrying about the weather. We’ve got to take it just the way it comes, for nothing we can do can alter it.

Posted in Uncategorized | Leave a comment

With Worsening Journalism, Different People To Trust

In 2006, the New York Times announced the end of winter in the Northeastern US. They were growing spinach in December in 60 degree weather, as sea ice disappeared and polar bears died.

With Warmer Weather, Different Decisions to Make – The New York Times

That year was an outlier. There is no indication that winter temperatures have increased or the frequency of 60 degree winter days has changed in the Northeast over the past 90 years.

Washington DC cherry blossoms bloom several days later than they did 30 years ago when CO2 was below 350 PPM.

https://www.epa.gov/sites/production/files/2016-08/cherry-blossoms_fig-1.csv

New Year’s Eve was coldest on record in much of the US this year.

New year brings record cold across US – CNN

I was ice skating in front of the Capitol Building on January 8, 2018. Temperatures were below zero (F) the night before just outside of DC.

The Start Of The Washingtonian Ice Age | The Deplorable Climate Science Blog

During George Washington’s first year in office, the Northeastern US was 70 degrees on many days.

A Meteorological Account of the Weather in Philadelphia: From January 1 … – Charles Peirce – Google Books

Five of the last six months of March have been among the coldest on record in the Northeast.

I spent spring in Philadelphia, where they had record snow.

This was Toto on the first day of Spring

This was Toto hiking on Chesapeake Bay on March 7, 2015

The ice isn’t limited to Maryland. There has been no change in Arctic sea ice extent or volume since the New York Times wrote that article in 2006.

Spreadsheet

There is more ice along the coast of Alaska than there has been in years.  The Polar Bears simply can’t find any place to drown.

https://go.nasa.gov/2LBEWvC

Everything the New York Times said in that 2006 article was fact-free superstition, junk science and fake news, which is their standard operating procedure.  And of course they censor anyone who tells the truth.

Posted in Uncategorized | Leave a comment

(Even More) Perversion Of Justice By The Democrats

We are fast approaching the stage of the ultimate inversion: the stage where the government is free to do anything it pleases, while the citizens may act only by permission; which is the stage of the darkest periods of human history, the stage of rule by brute force.

Ayn Rand

Christopher Horner – Law Enforcement for Rent 

Chris is the handsome guy located between Marc and myself .

Posted in Uncategorized | Leave a comment

Overheated Ocean Update

One year ago, climate experts said red sea surface temperature maps were the most powerful evidence that a one part per ten thousand increase in atmospheric CO2 over the past century is burning up the planet.  They also said you should send them money to stop this.

The Most Powerful Evidence Climate Scientists Have of Global Warming | InsideClimate News

Over the past year, the red has turned to blue – but they still need you to send them money.

anomnight.8.27.2018.gif (1174×640)

With temperatures of -30C over the Greenland ice sheet and -60C over the Antarctic ice sheet, there can be little doubt that urgent action is required.


Climate Reanalyzer

Posted in Uncategorized | Leave a comment