Extreme Weather 85 Years Ago

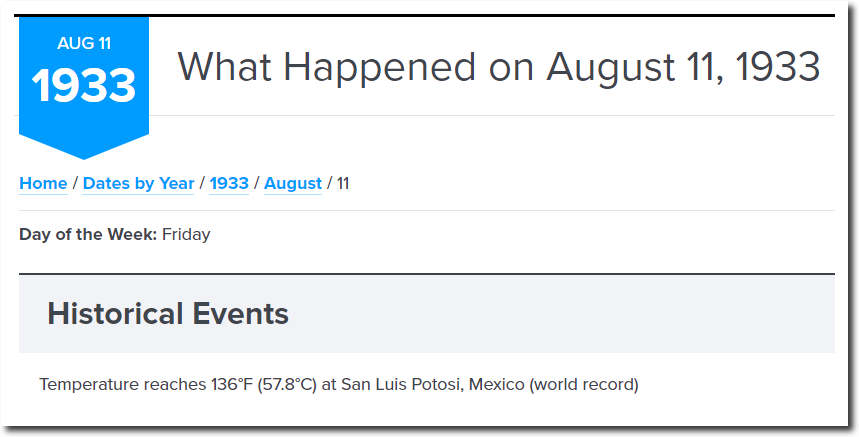
It was extremely hot at San Luis Potosi, Mexico on August 11, 1933.  (Multiple locations in Arizona reported 117 degrees that day.)

August 11, 1933 – What Happened – On This Day

h/t Don Penim

Five weeks later, the city was destroyed by a hurricane.  Imagine the climate hysteria and superstition if this happened now.

18 Sep 1933, Page 1 – Clovis News-Journal at Newspapers.com

Just another lovely day in San Luis Potosi, Mexico.

29 Jan 1933 – SHOT AND HANGED – Trove

Posted in Uncategorized | Leave a comment

No Change In Arctic Sea Ice Over The Past 60 Years

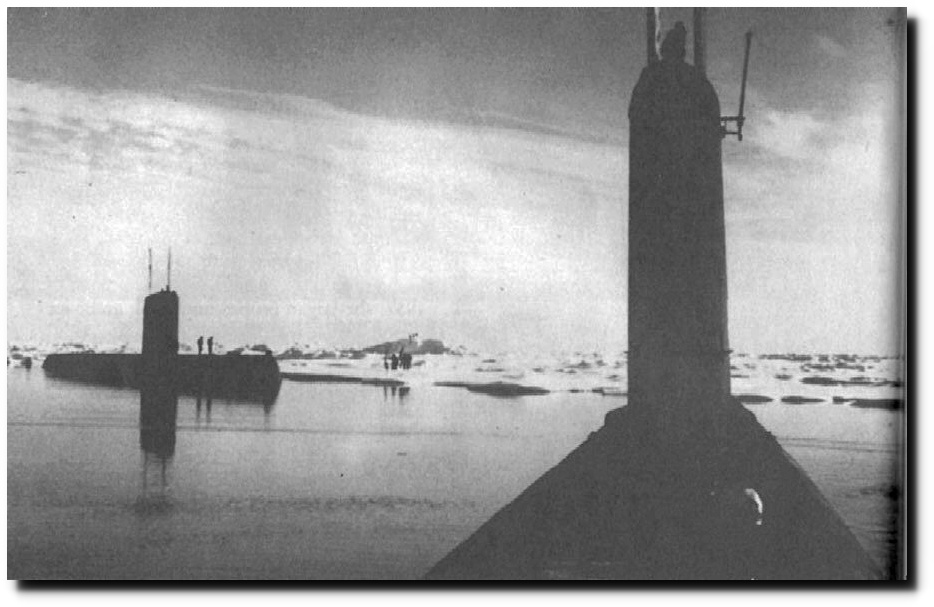
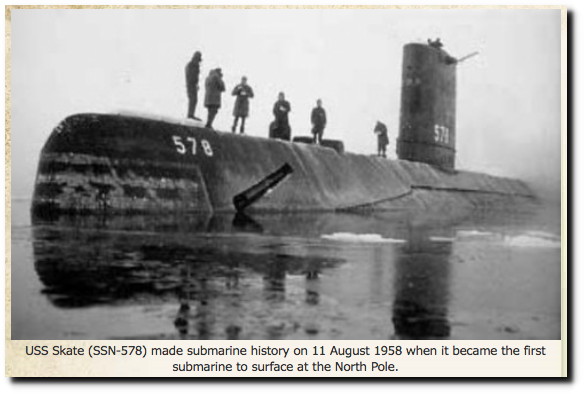
Sixty years ago this week, the USS Skate surfaced at the North Pole. Arctic sea ice was two meters thick.

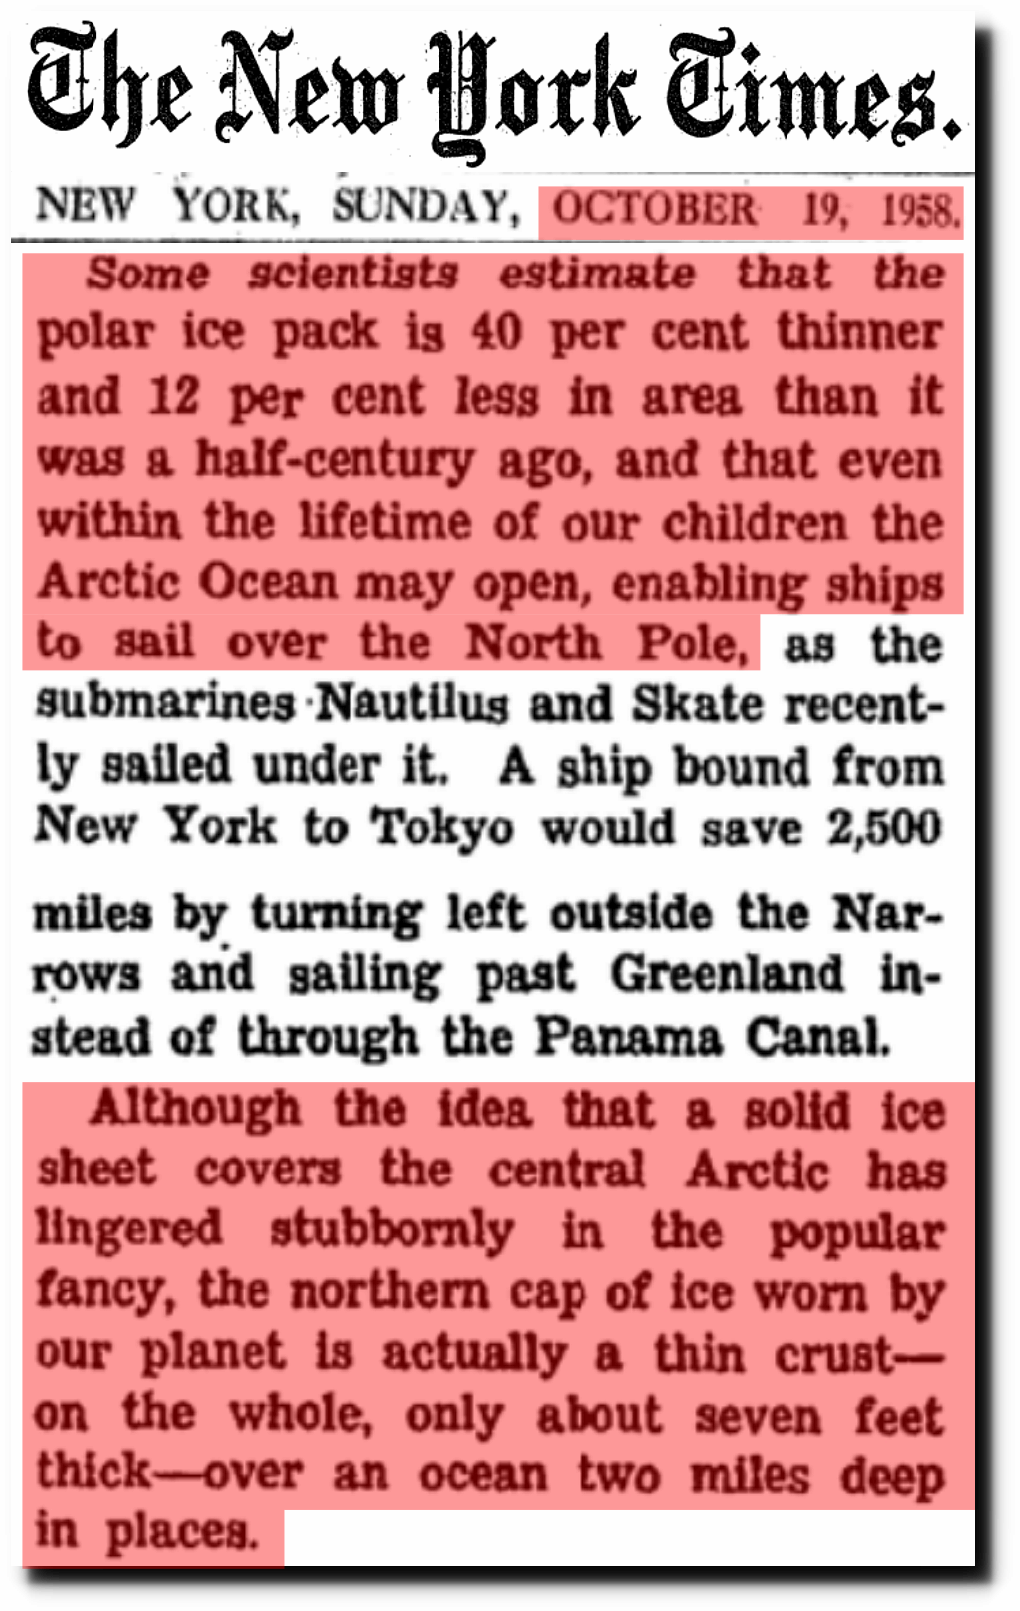
The Changing Face of the Arctic; The Changing Face of the Arctic – The New York Times

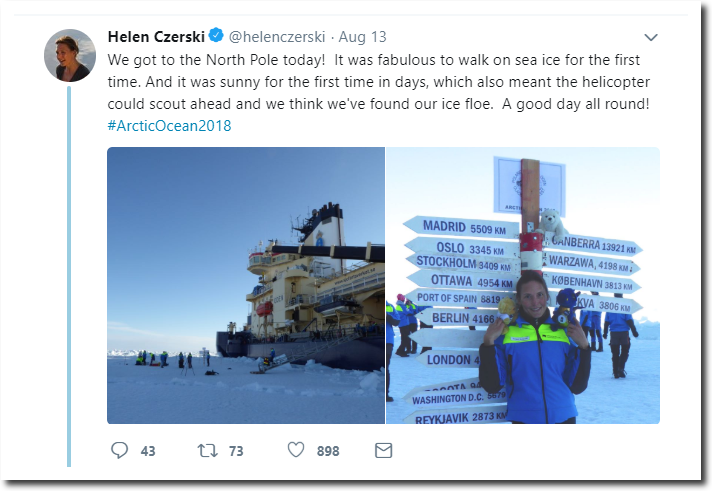
Compare the North Pole in 1958, to what it looks like 60 years later.

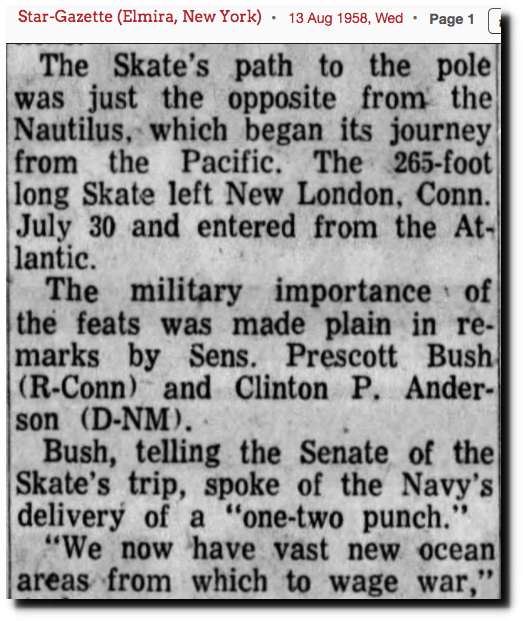
The Bush family immediately recognized it as an opportunity to wage war with Russia.

13 Aug 1958, 1 – Star-Gazette at Newspapers.com

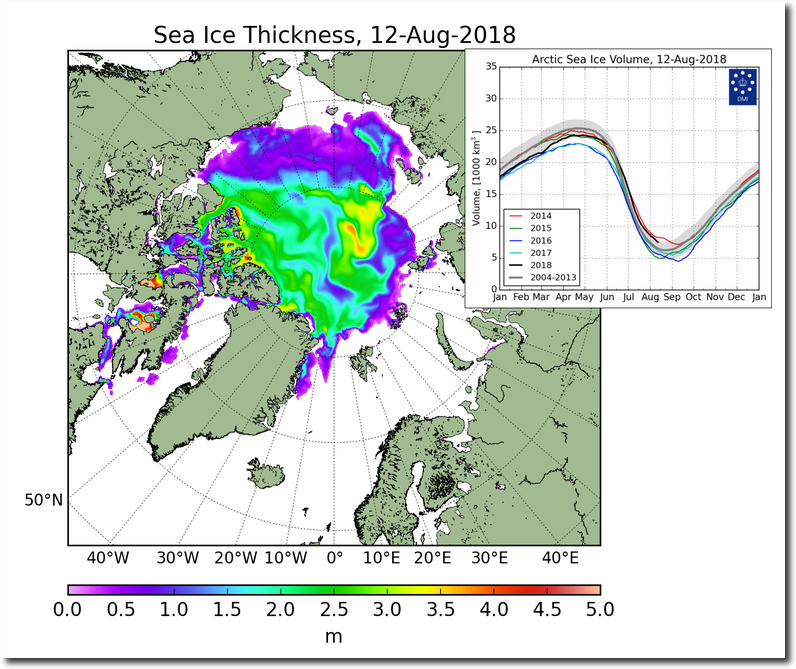
So nothing has changed over the last 60 years. The ice is still two meters thick, and the Bush family still wants war with Russia.

FullSize_CICE_combine_thick_SM_EN_20180812.png (1337×1113)

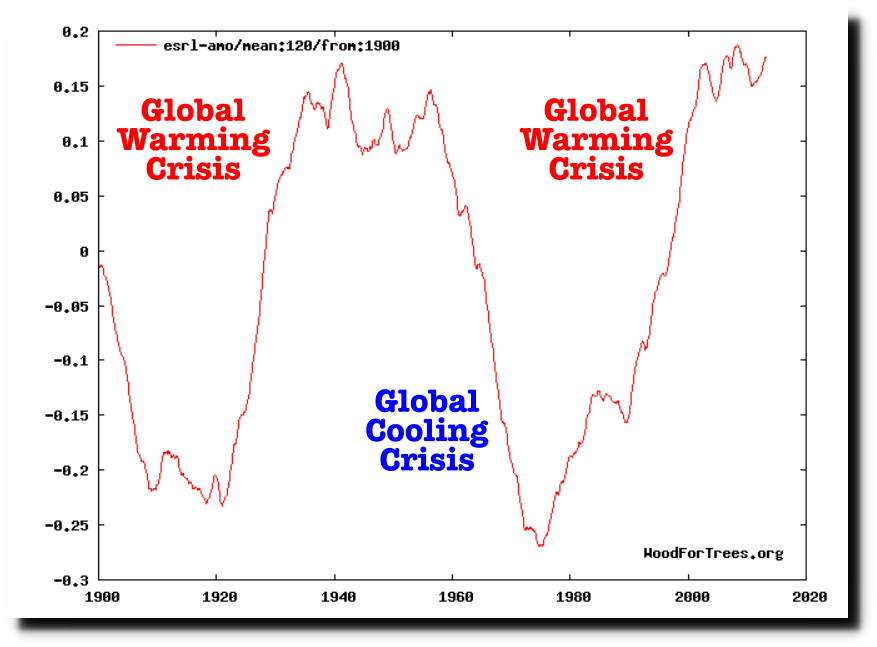
Wood for Trees: Interactive Graphs

Posted in Uncategorized | Leave a comment

More Canadian Temperature Nonsense

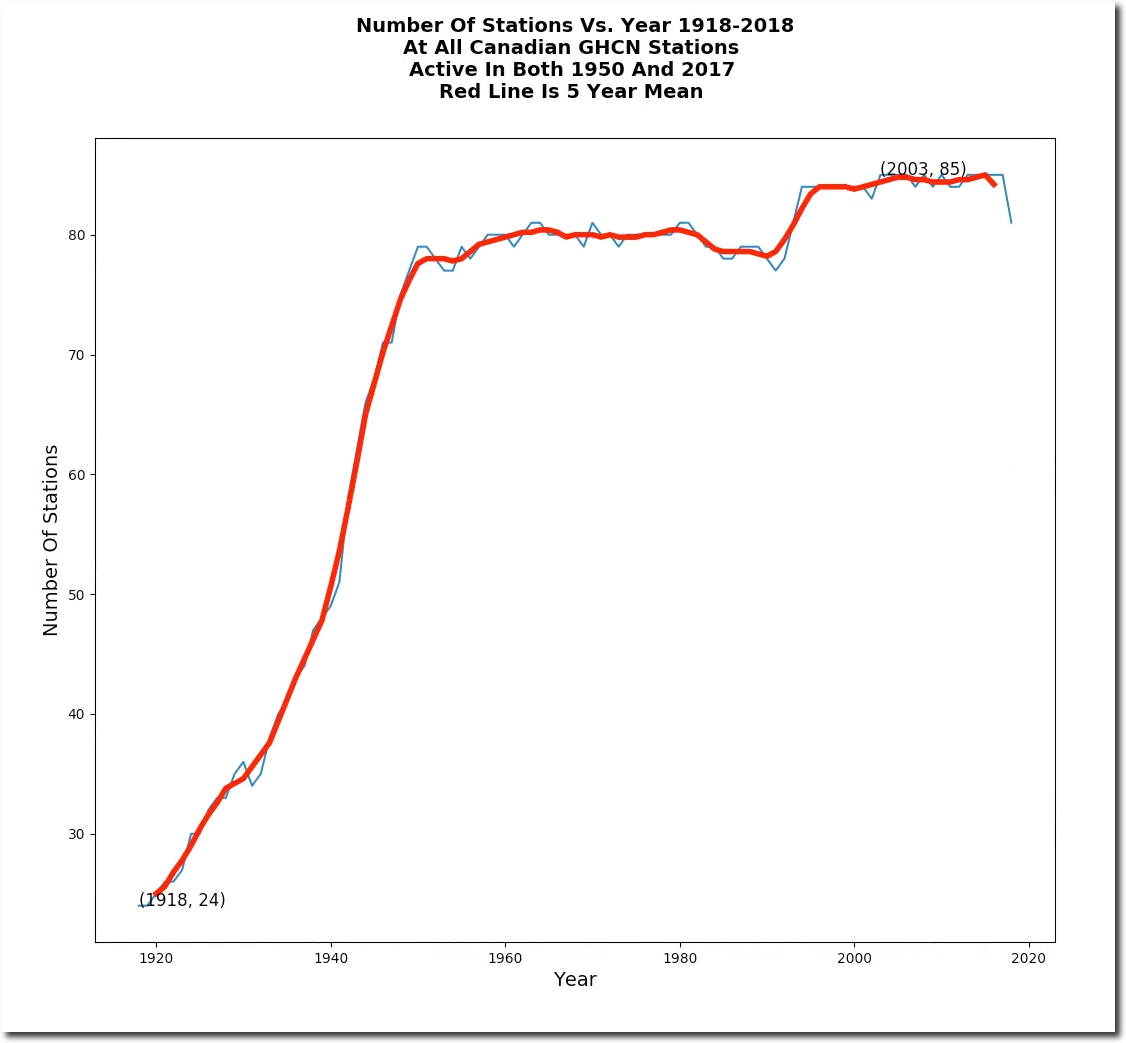
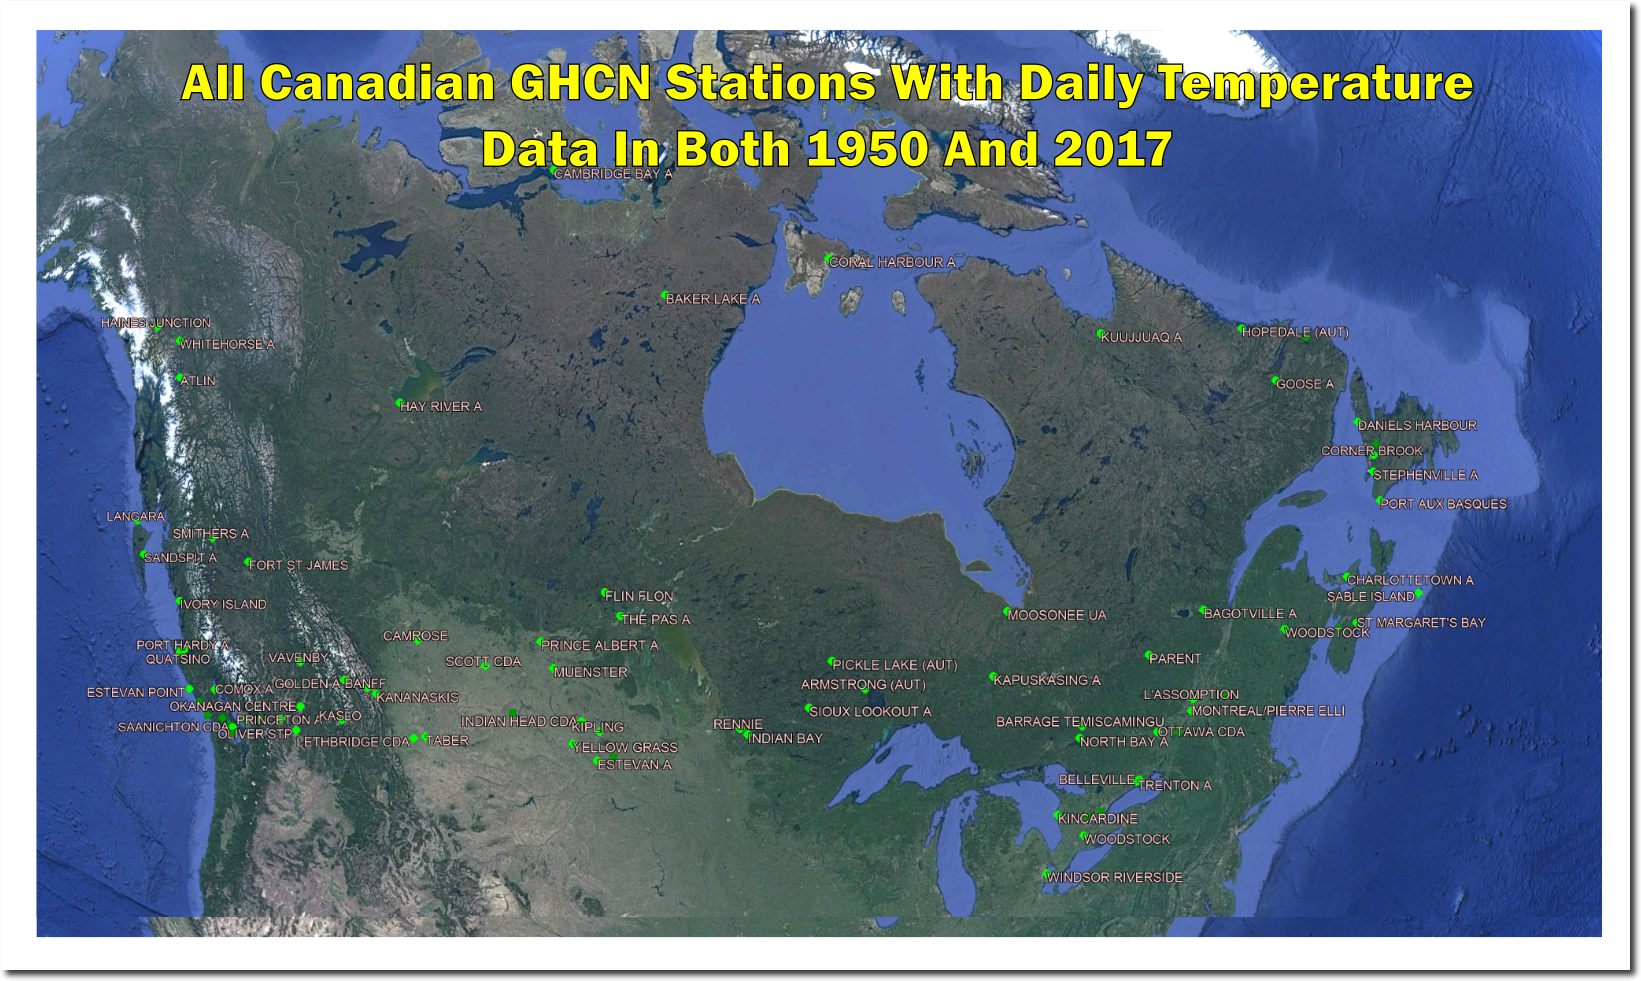
These are all of the Canadian GHCN stations which have daily temperature data in both 1950 and 2017.
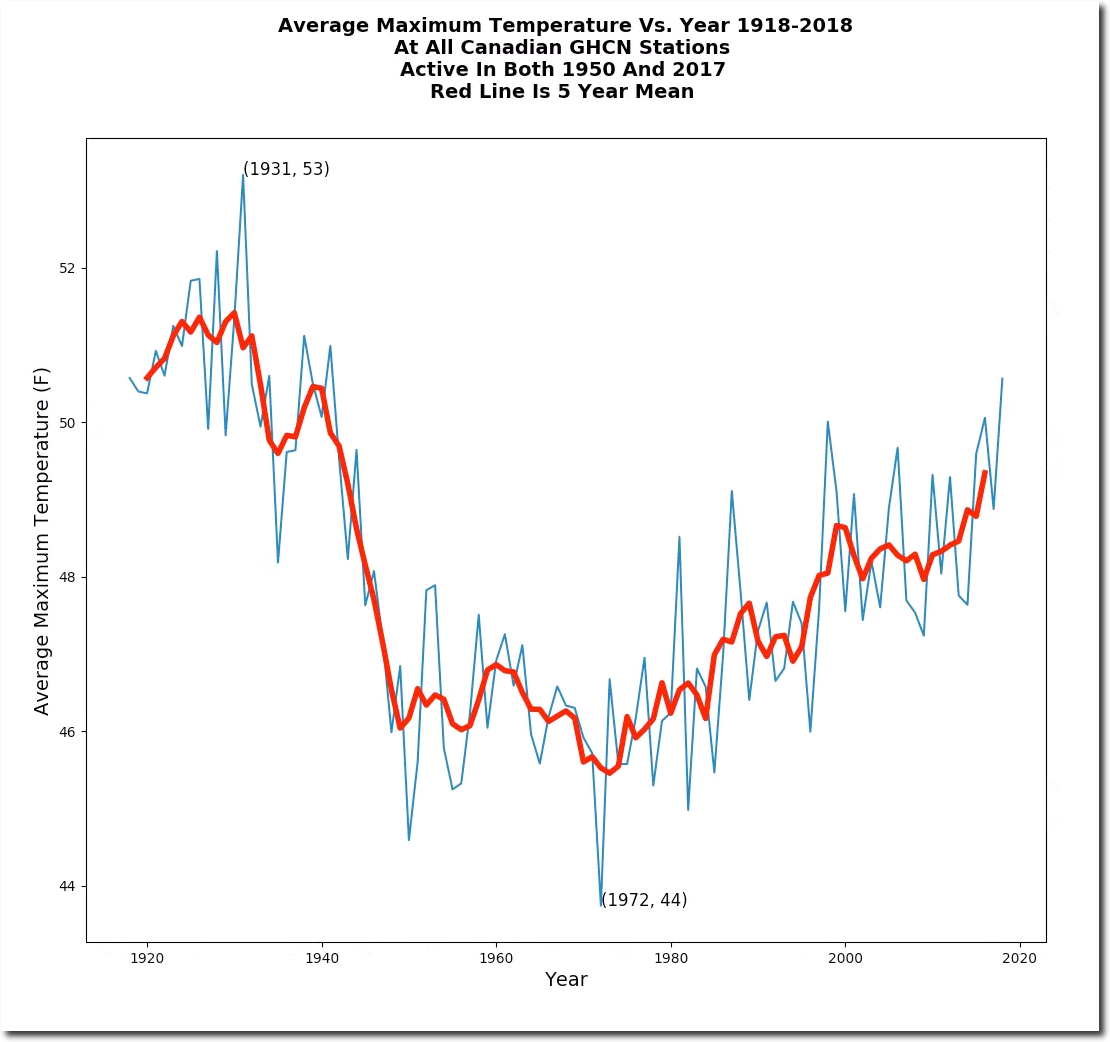
They show a sharp cooling trend before 1950, and a warming trend since 1980.
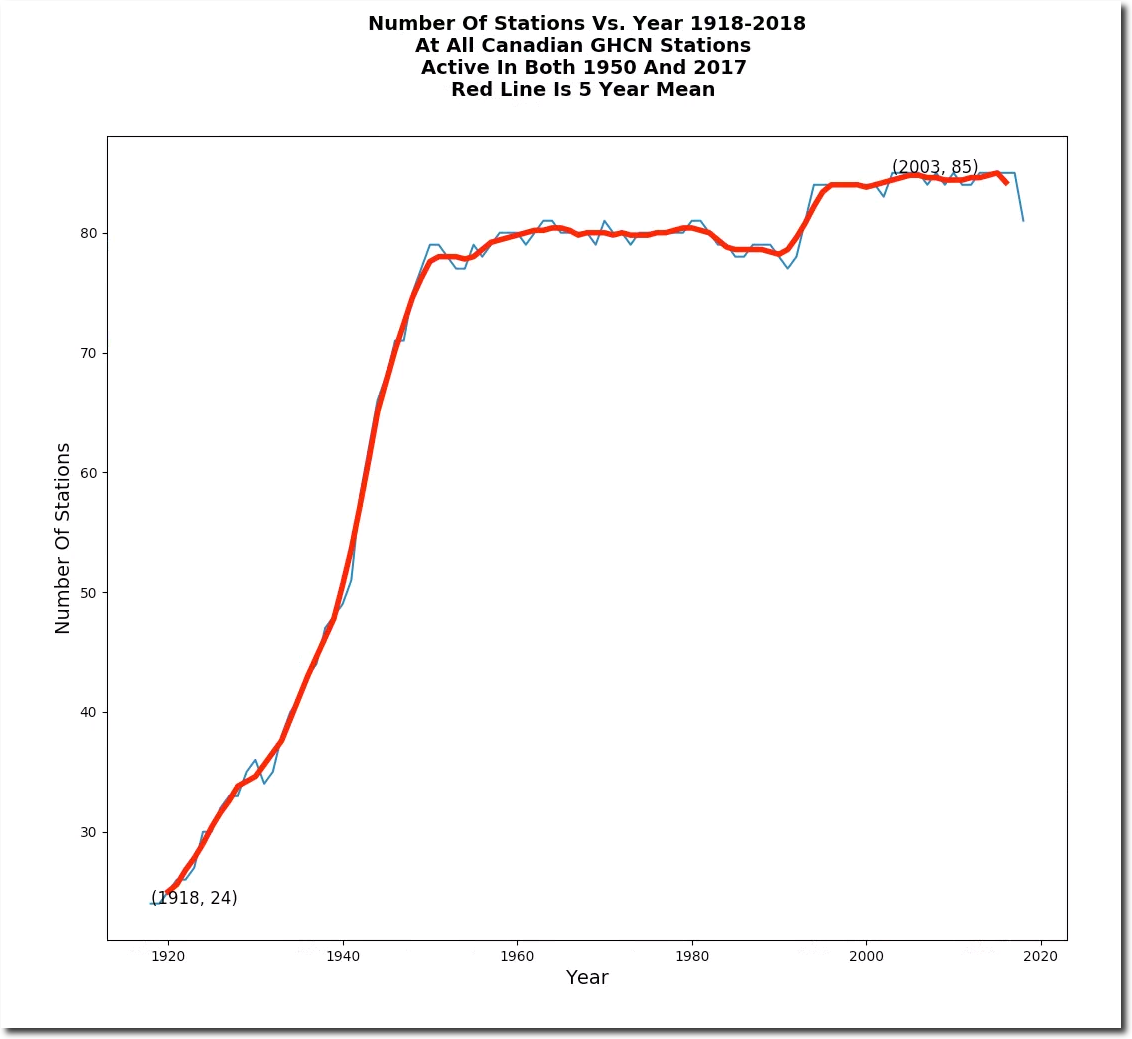
But the data is pretty useless for a number of reasons.  The station count is too small.
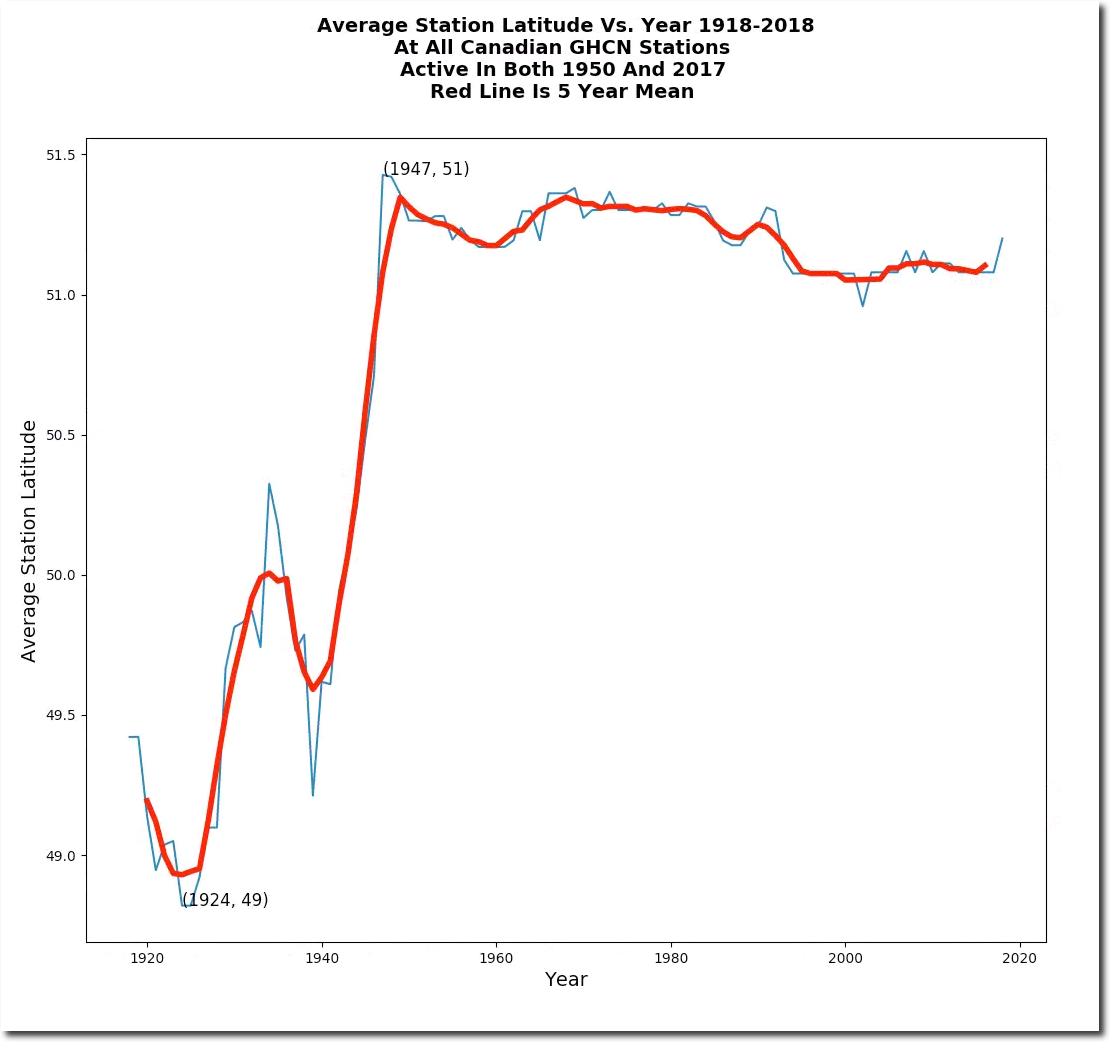
The average latitude of the stations has moved further from the equator. This causes a larger cooling trend after 1940 than is realistic.
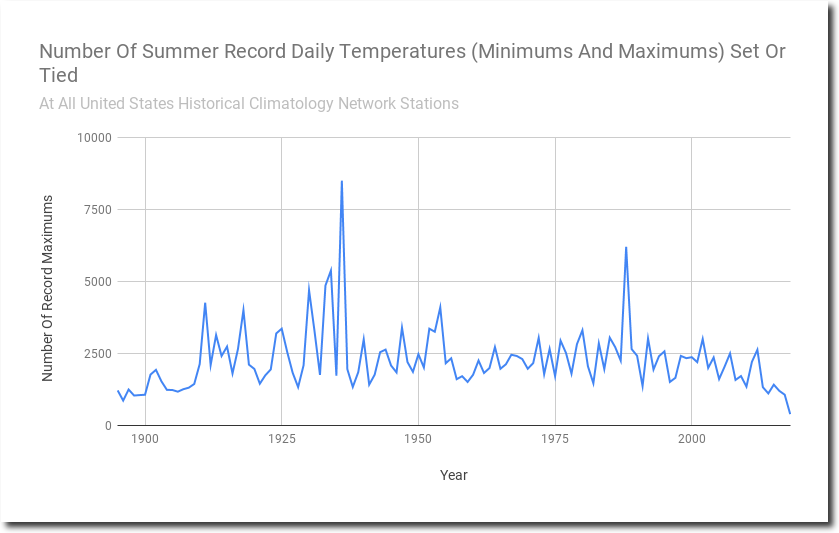
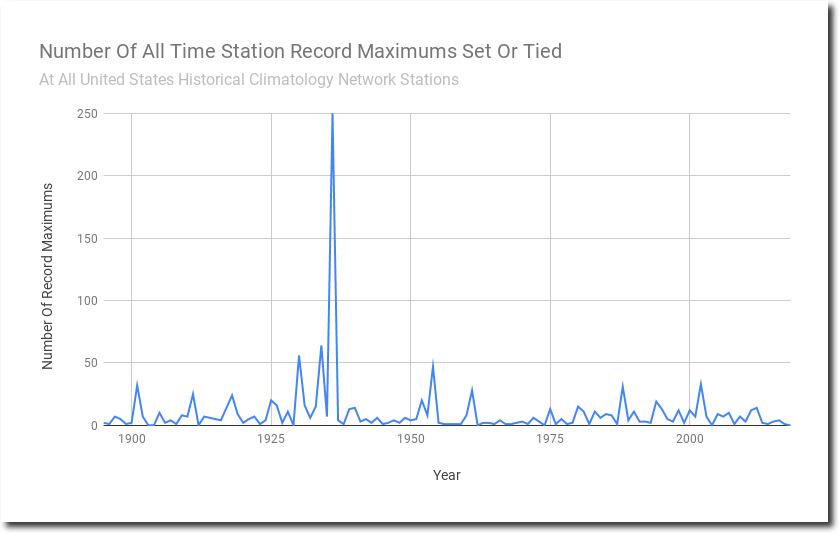
Like in the US, coverage and intensity of heatwaves has declined.
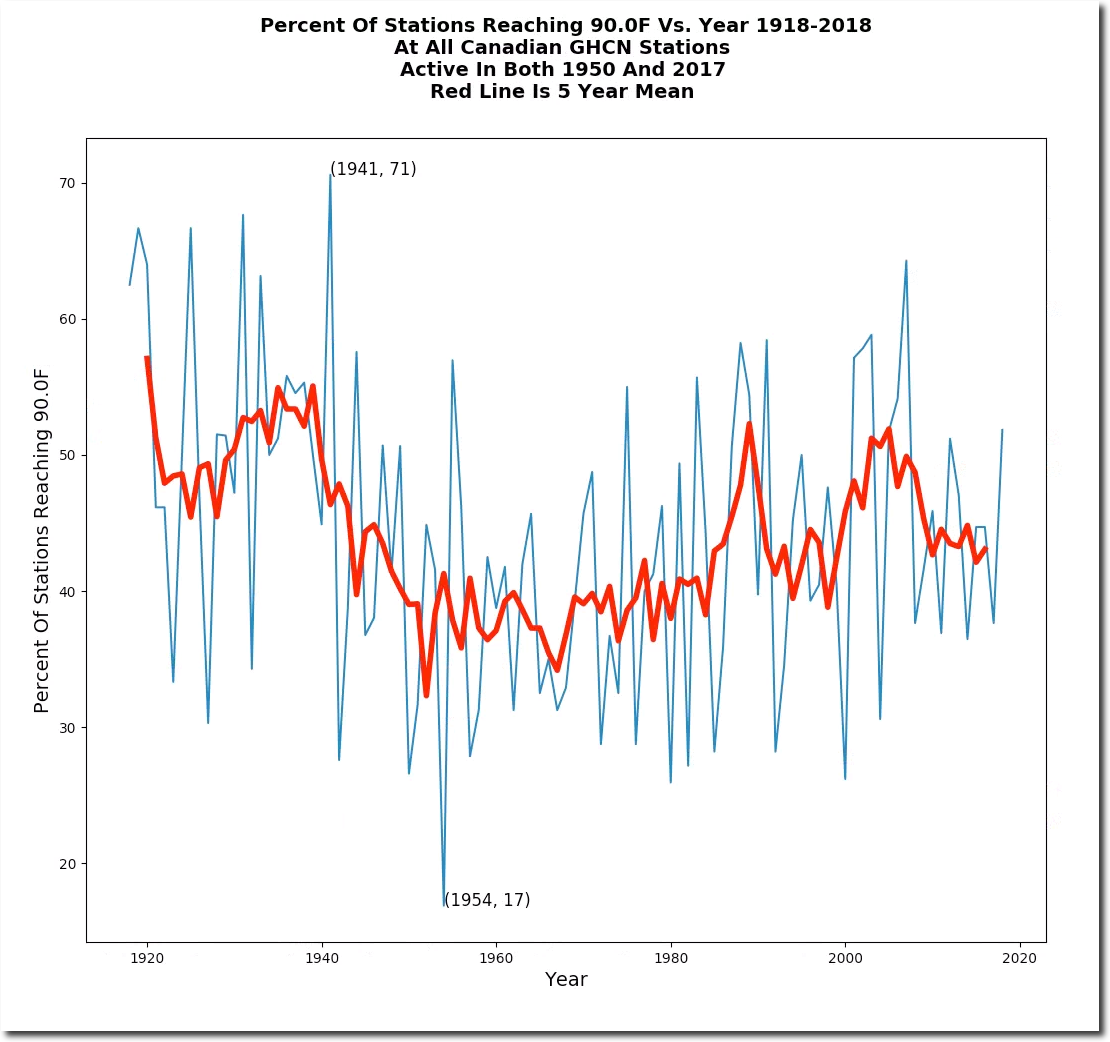
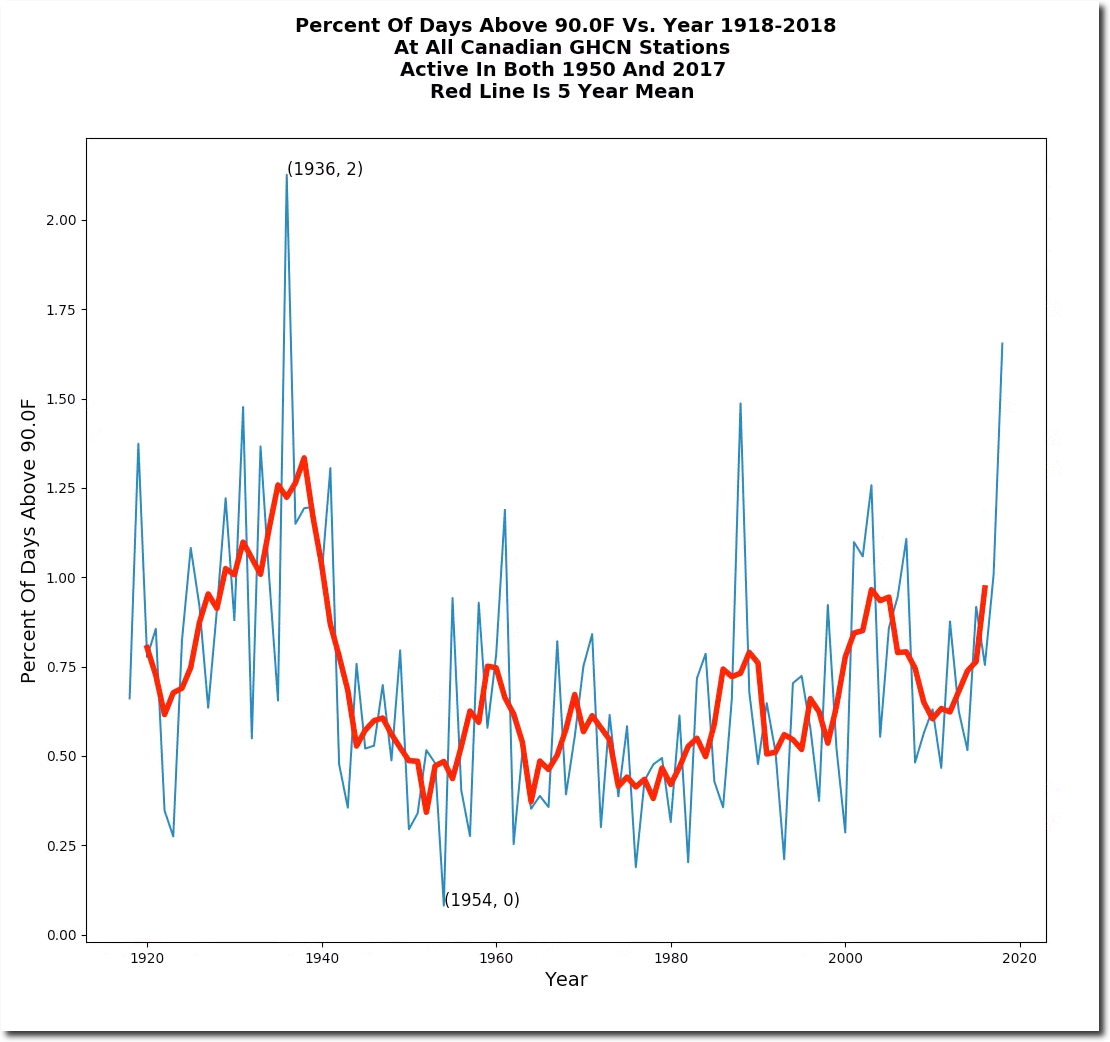
Because of the lack of data and poor geographical coverage, there is no way to establish a meaningful long term temperature trend for Canada – and anyone with an agenda can produce whatever trend they want.

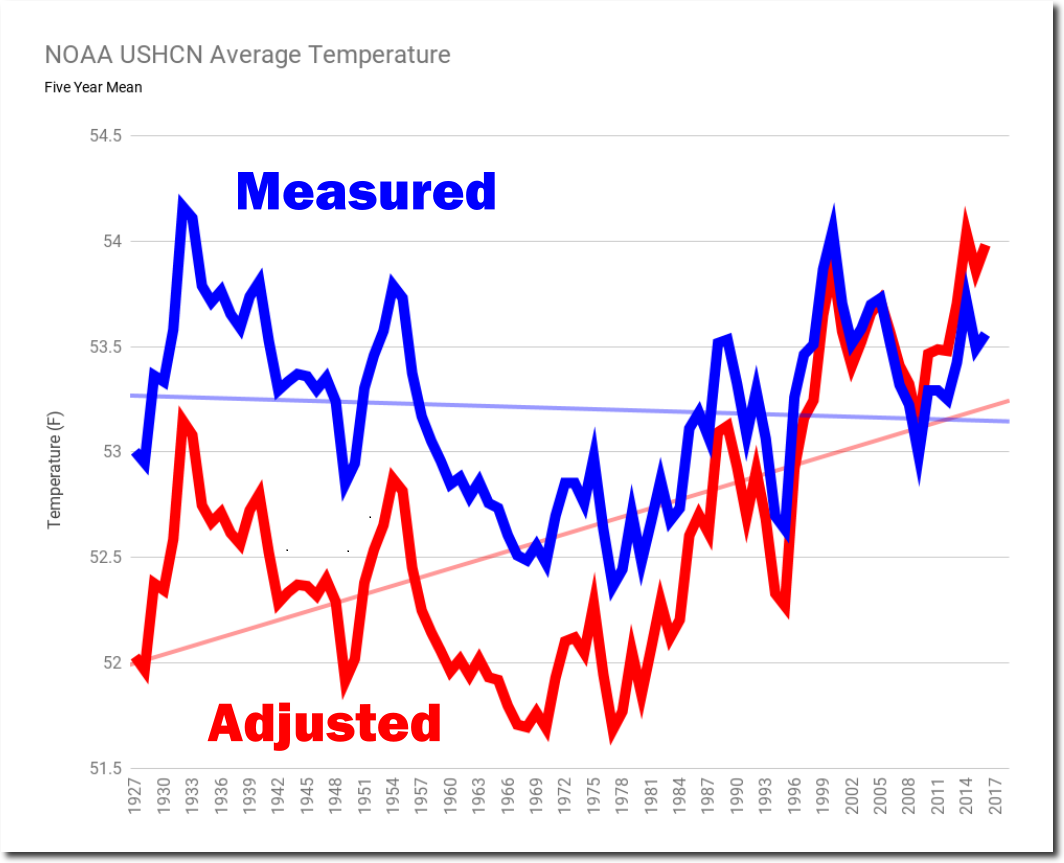
As bad as Canada is, it is much better than most of the rest of the world. The US temperature record is the only large scale record with any validity, and NOAA massively tampers with it.

Posted in Uncategorized | Leave a comment

“Why Aren’t I Fifty Points Ahead, You Might Ask?”

Leftists have difficulty understanding why their open hatred for America doesn’t translate into votes.

Posted in Uncategorized | Leave a comment

More Fake News From Berkeley Earth

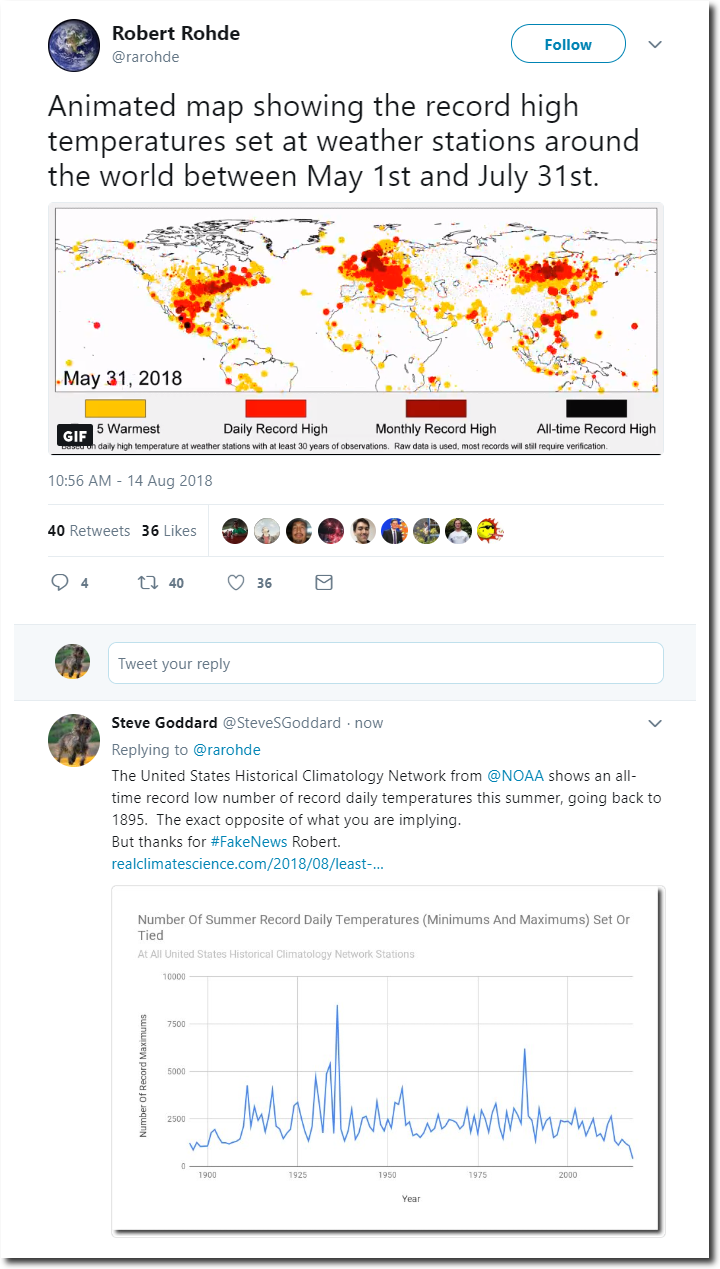
The Berkeley Earth “lead scientist” spreading more propaganda on Twitter.

Robert Rohde on Twitter: “Animated map showing the record high temperatures set at weather stations around the world between May 1st and July 31st.… https://t.co/kncXjn421w”

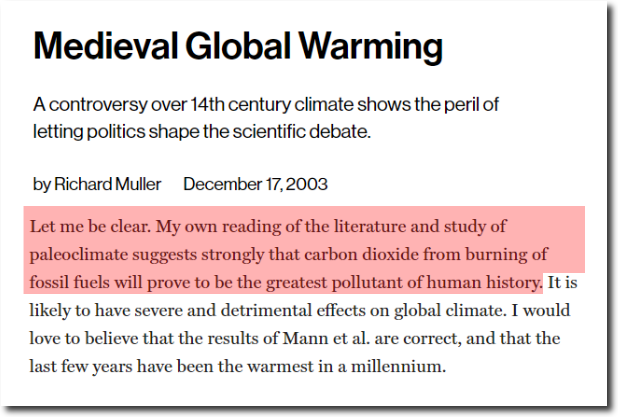
Berkeley Earth is run by a fraudster who claimed to be a climate skeptic – in order to obtain funding.

I would love to believe that the results of Mann et al. are correct, and that the last few years have been the warmest in a millennium.

Medieval Global Warming – MIT Technology Review

I was never a skeptic

Richard Muller, Climate Researcher, Navigates The Volatile Line Between Science And Skepticism | HuffPost

Posted in Uncategorized | Leave a comment

Arctic Sea Ice Extent Loss Slows To A Crawl

I’ve been pointing out for several days that ice extent is hardly changing in the Arctic.

Index of /DATASETS/NOAA/G02135/north/daily/images/2018/08_Aug/

It is starting to show up in the MASIE graphs. More heartbreak for Arctic alarmists.

Charctic Interactive Sea Ice Graph | Arctic Sea Ice News and Analysis

Posted in Uncategorized | Leave a comment

No Change In Climate Science Since The 16th Century

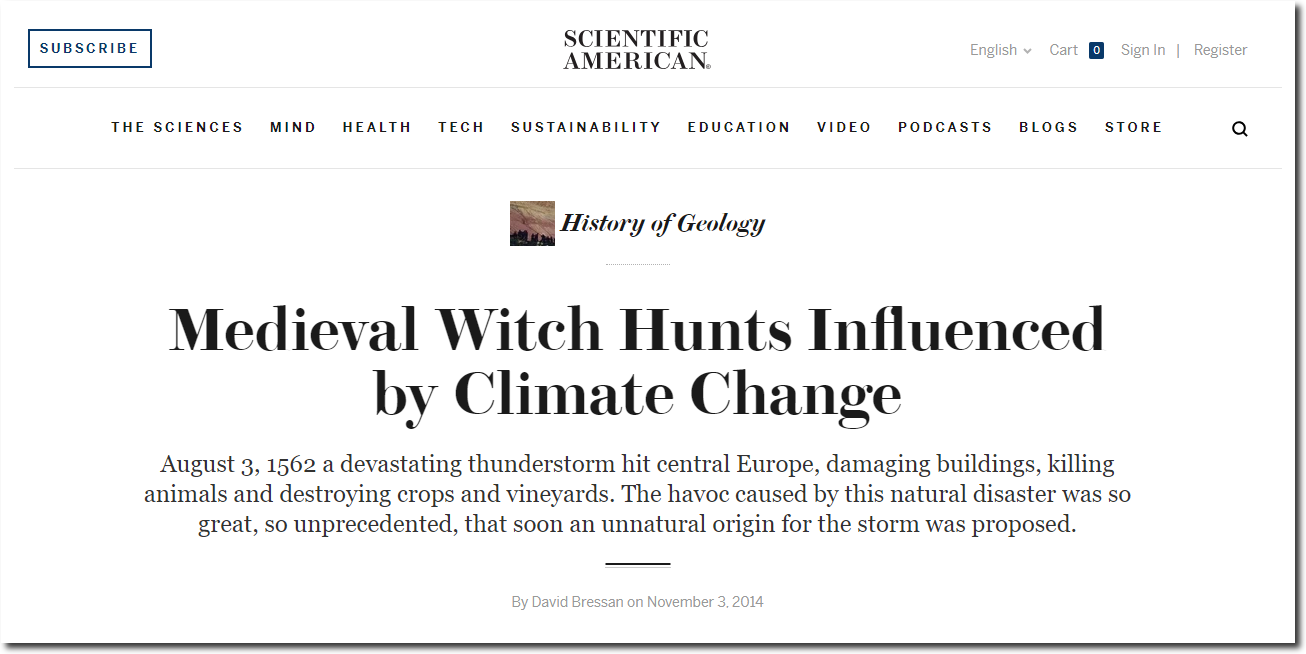
Five centuries later, climate science is still based on witchcraft and superstition about bad weather.

The havoc caused by this natural disaster was so great, so unprecedented, that soon an unnatural origin for the storm was proposed.

Medieval Witch Hunts Influenced by Climate Change – Scientific American Blog Network

The only difference now is that people involved in climate witchcraft have a slightly different superstition, and the ability to propagate their madness much faster.

Posted in Uncategorized | Leave a comment

Love Is In The Air

Posted in Uncategorized | Leave a comment

More Canadian Nonsense

I’m looking at what has caused the spike in temperatures in Canada the last five years.

There are only 85 stations in Canada which were active in both 1950 and 2017, and many of these have intermittent data during that time.

I found another flaky station, which since 2014 is reporting many fewer days, and seems to be losing all of the low temperatures.

It doesn’t take very many stations like this to create a large fake upwards trend.

Posted in Uncategorized | Leave a comment

Arctic Sea Ice About The Same As 1971

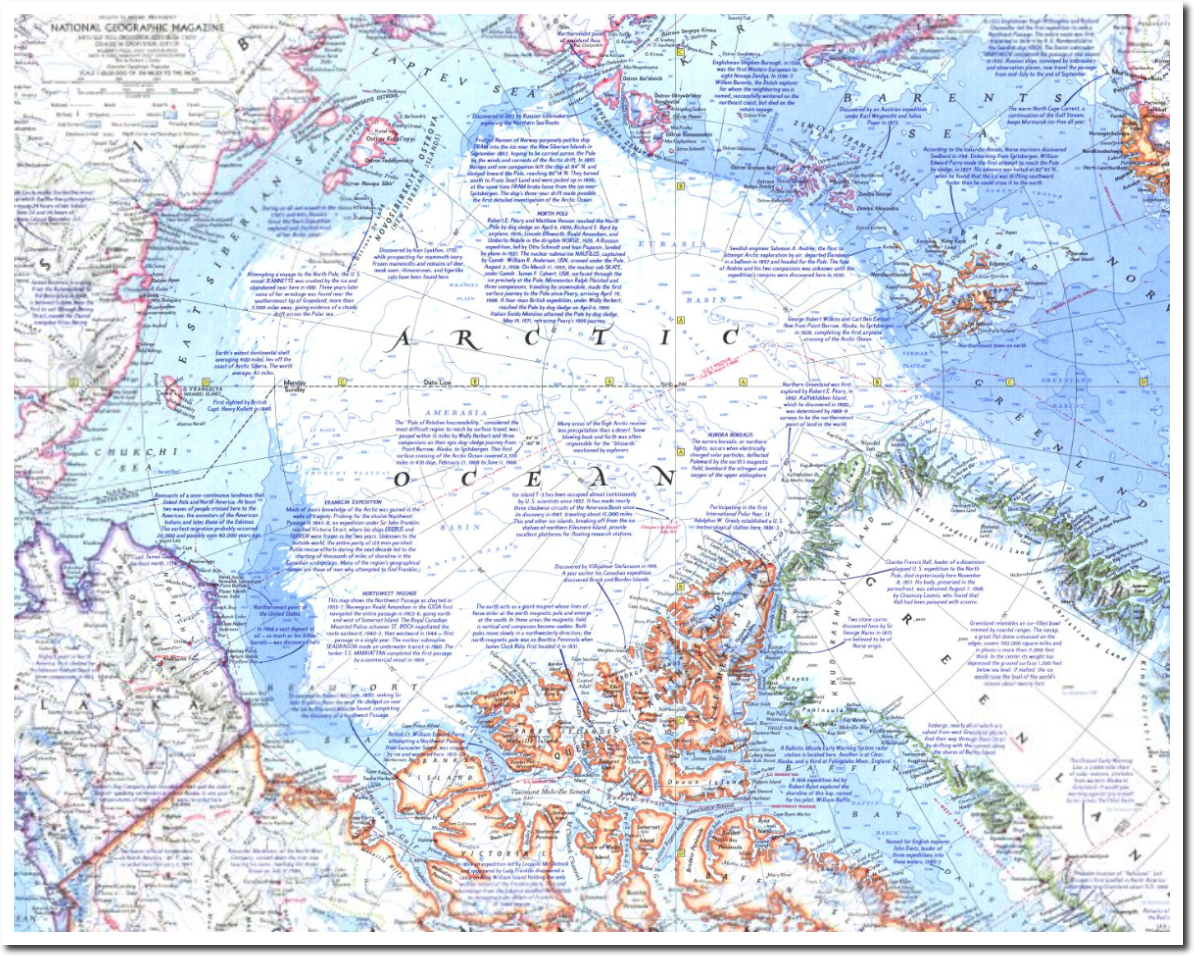
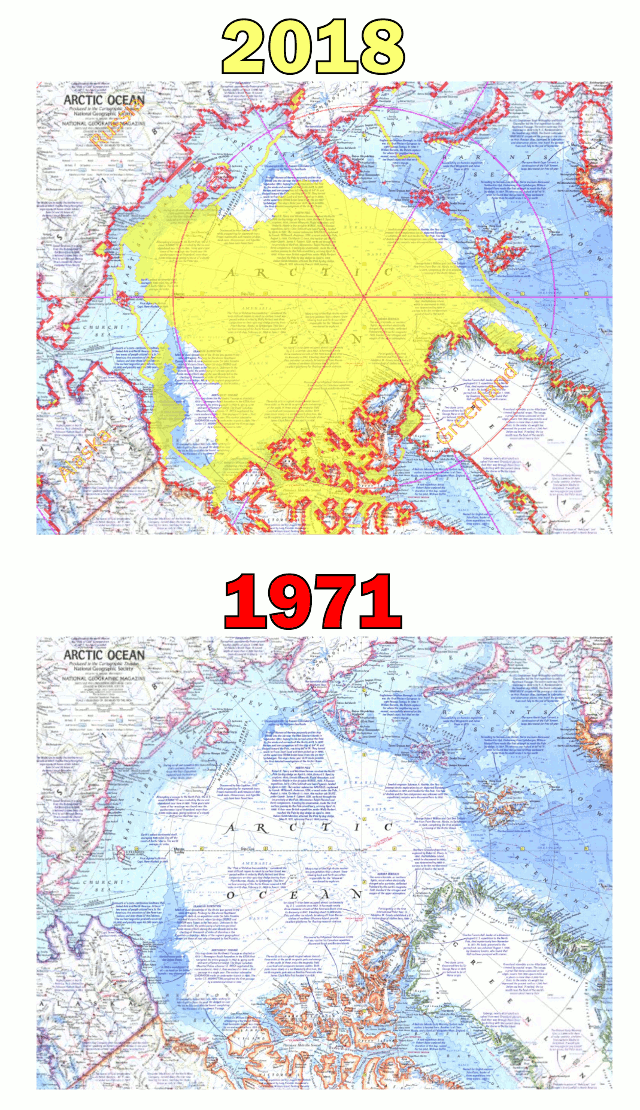
National Geographic published this map in 1971, showing the extent of Arctic sea ice at the end of summer.

1971

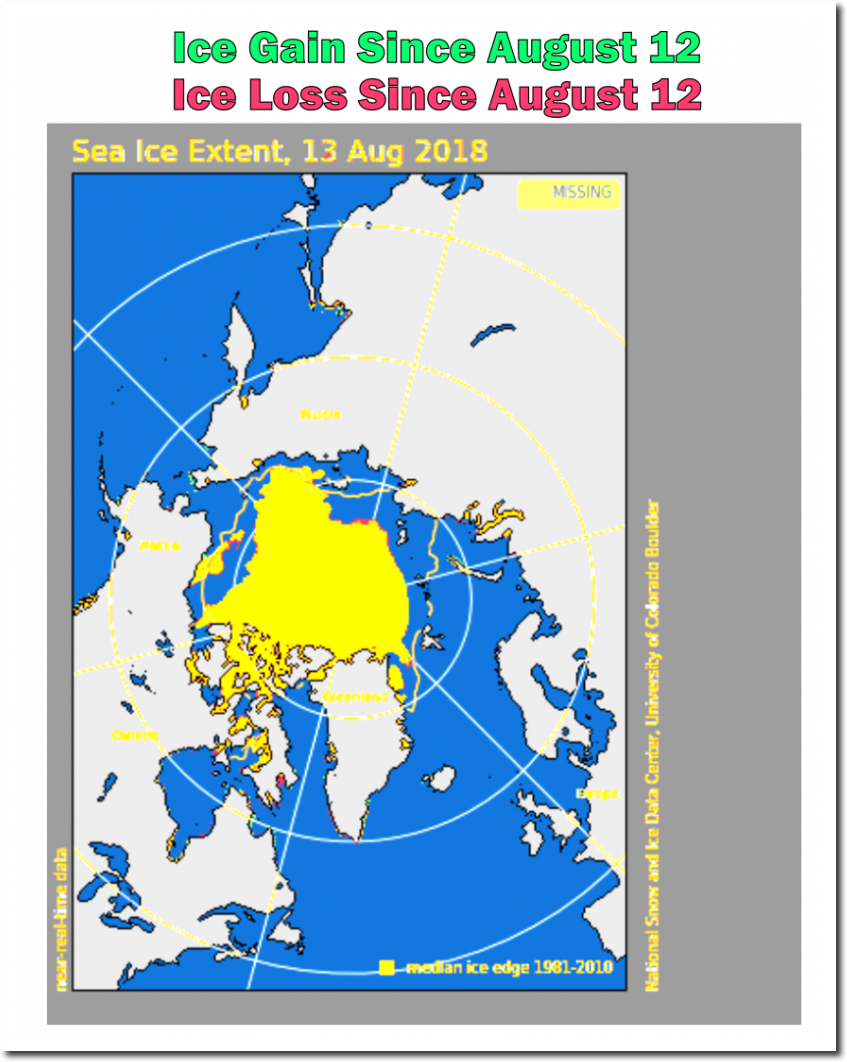
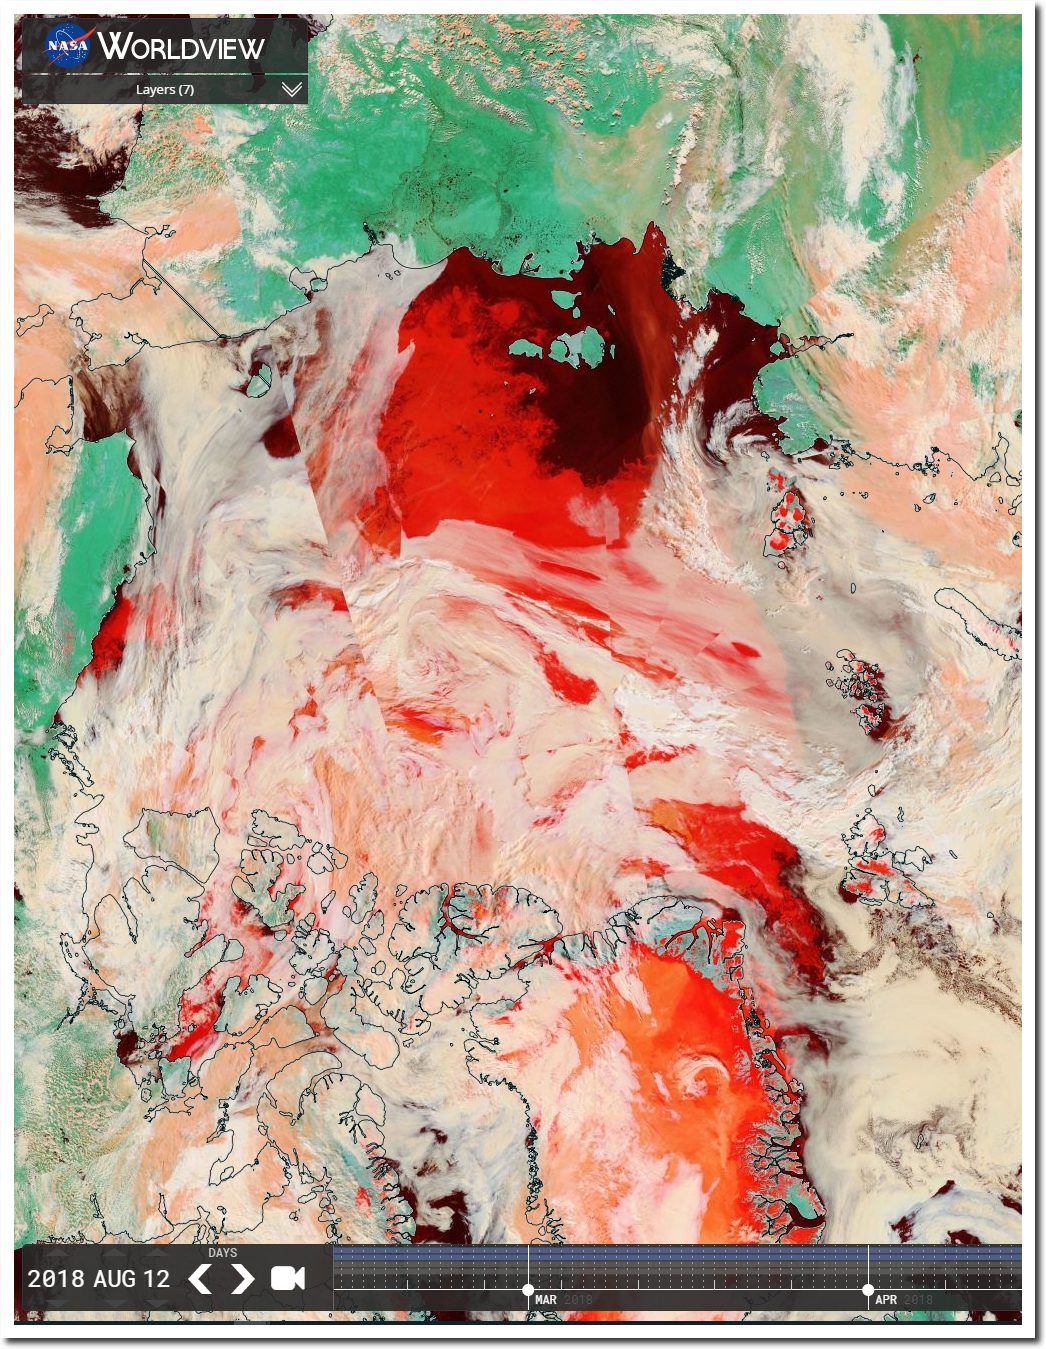
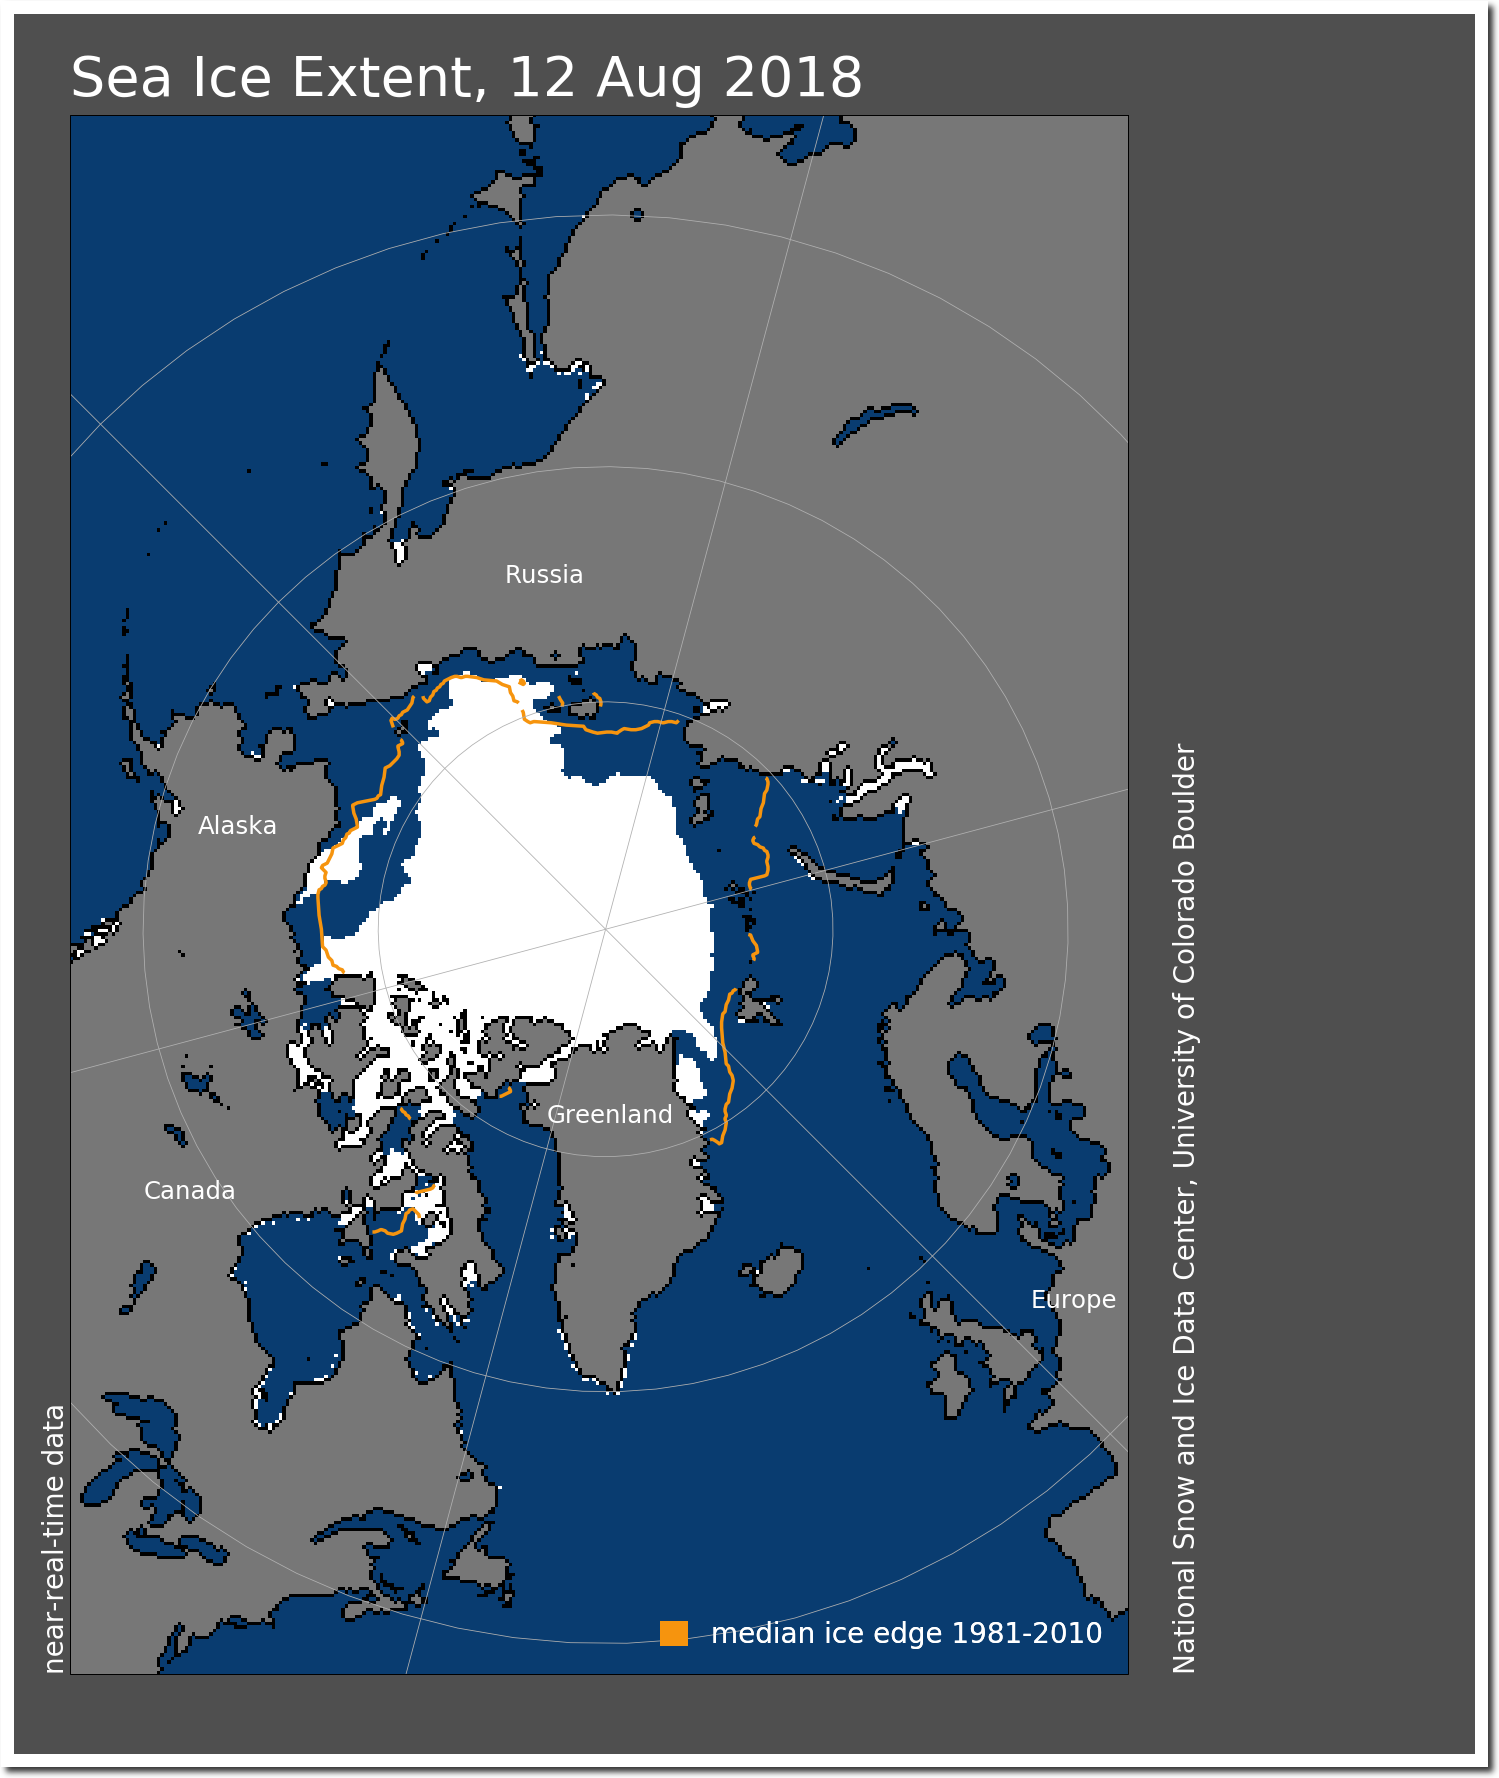
We are nearing the end of summer, and the ice in some regions is more extensive now than it was in 1971.

NASA Link

N_20180812_extn_hires_v3.0.png (1461×1740)

Arctic sea ice volume is fourth highest since 2003, and melting very slowly.

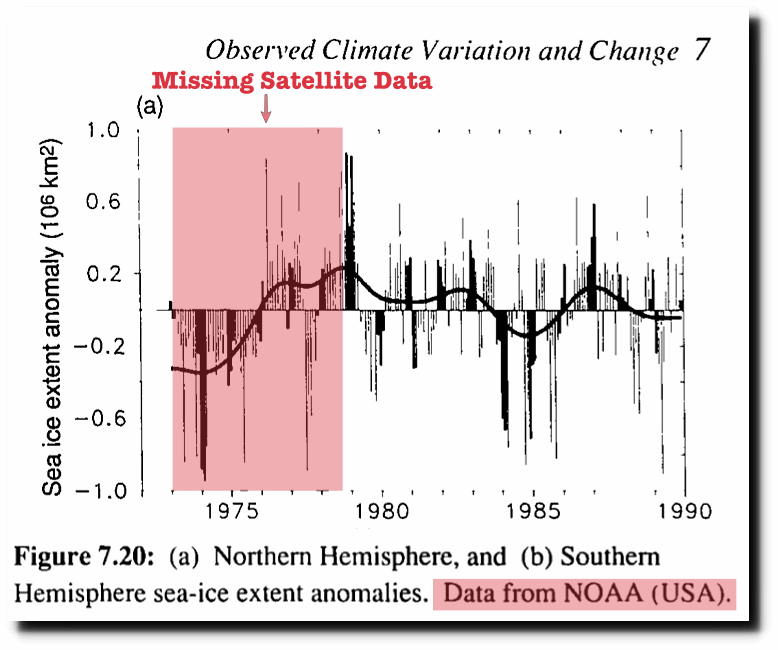
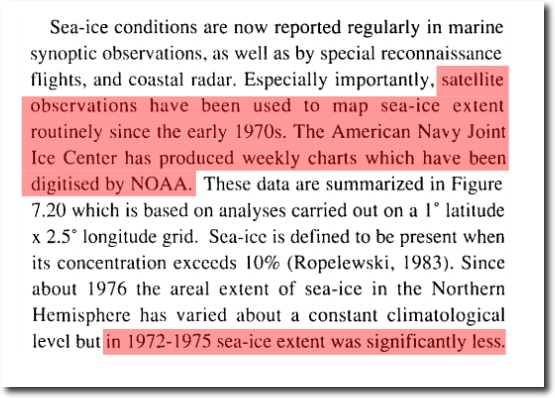
This is why NOAA hides the pre-1979 sea ice data.  It wrecks their Arctic melting scam.

1990 IPCC Report

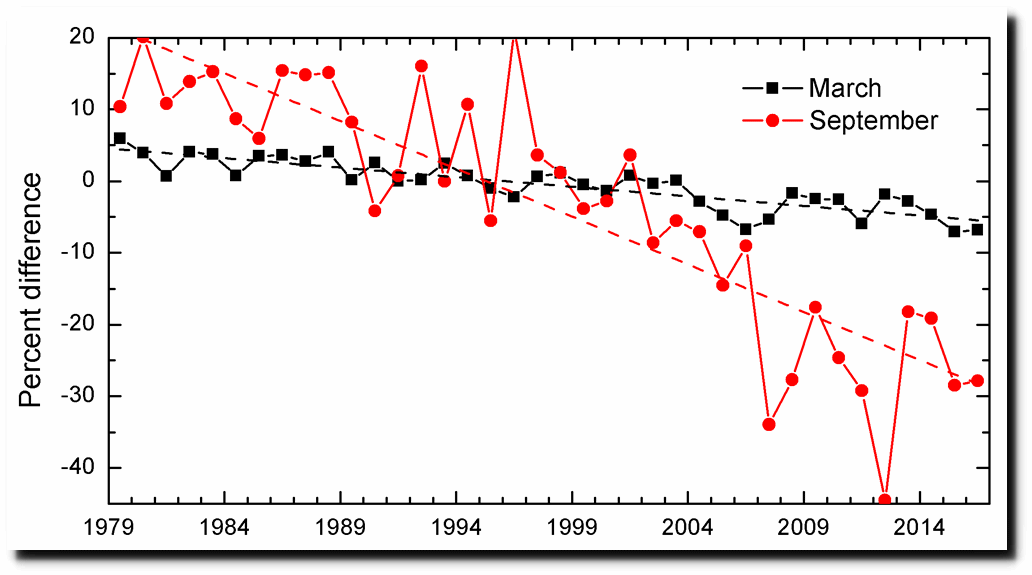
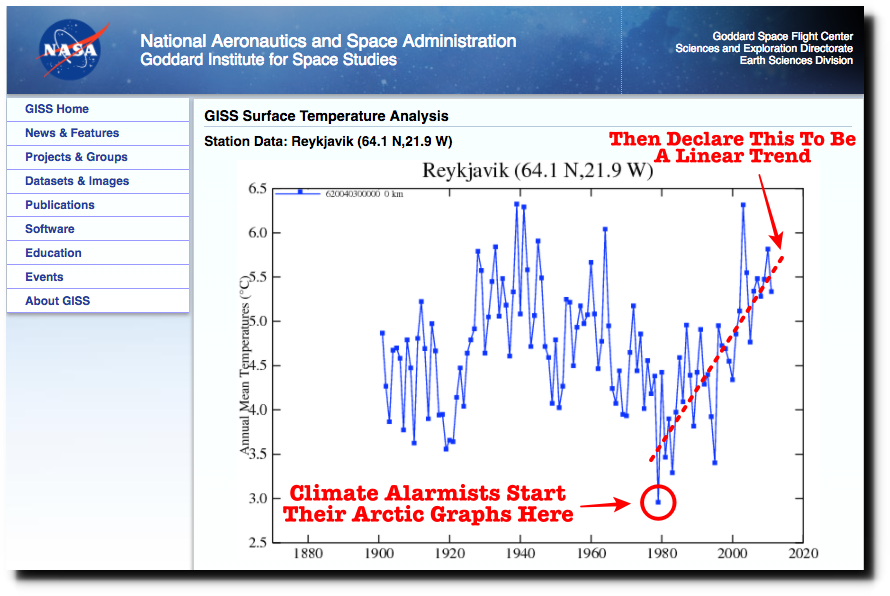
NOAA wants you to believe that time began in 1979, the peak year for Arctic cold and Arctic ice.

ftp://ftp.oar.noaa.gov/arctic/documents/ArcticReportCard_full_report2016.pdf

The graph below explains how climate alarmists do their junk science.

V2 Measured

Posted in Uncategorized | Leave a comment