
Last night my neighbor told me the world no longer respects the US, because of Donald Trump.

Last night my neighbor told me the world no longer respects the US, because of Donald Trump.

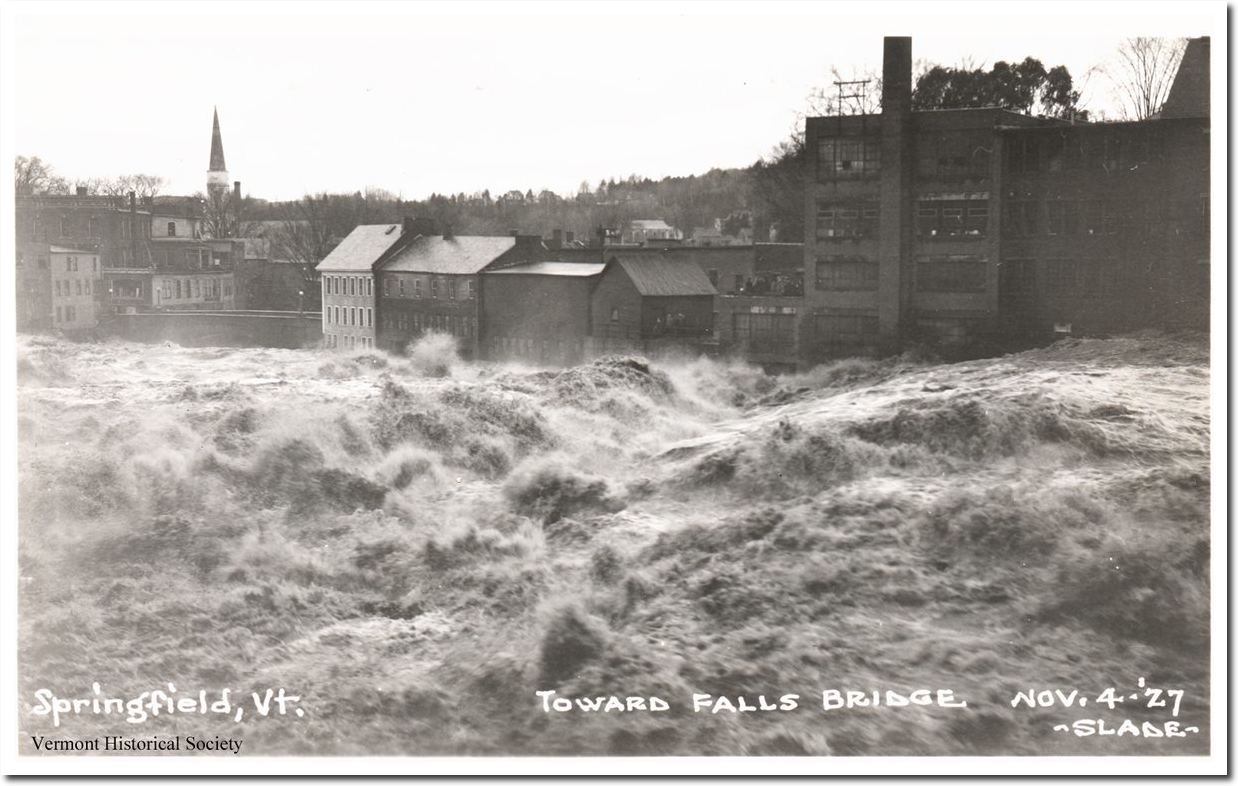
Ninety-one years ago brought the worst floods in US history. The Mississippi River was flooded for more than six months, forcing hundreds of thousands of people to abandon their homes permanently. Vermont’s worst flood on record occurred in November, 1927. The Red Cross described 1927 as the worst year in history, with 111 disasters – including 29 tornadoes, 24 floods, 9 hurricanes and 23 fires.

25 Nov 1927, Page 7 – The News-Review at Newspapers.com
St. Louis was destroyed by a tornado.
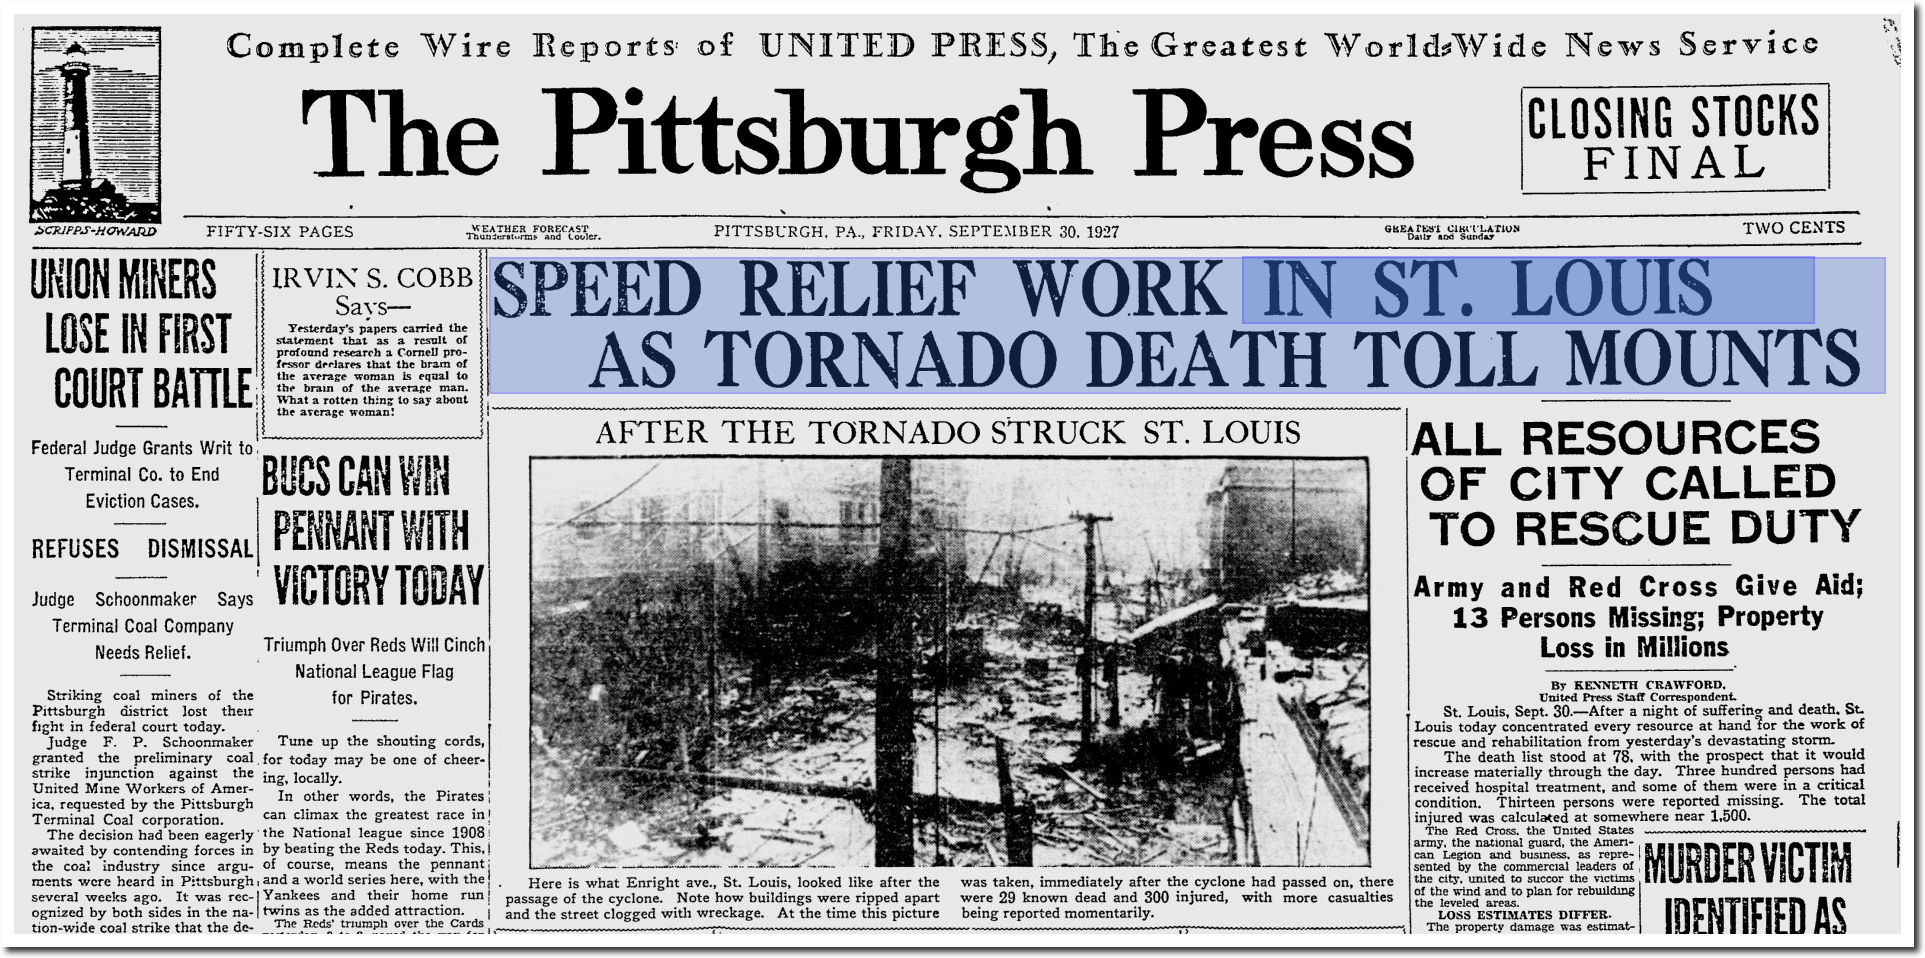
The Pittsburgh Press – Google News Archive Search
November flooding wiped out more than 1,000 bridges in Vermont, and drowned the Lieutenant Governor.
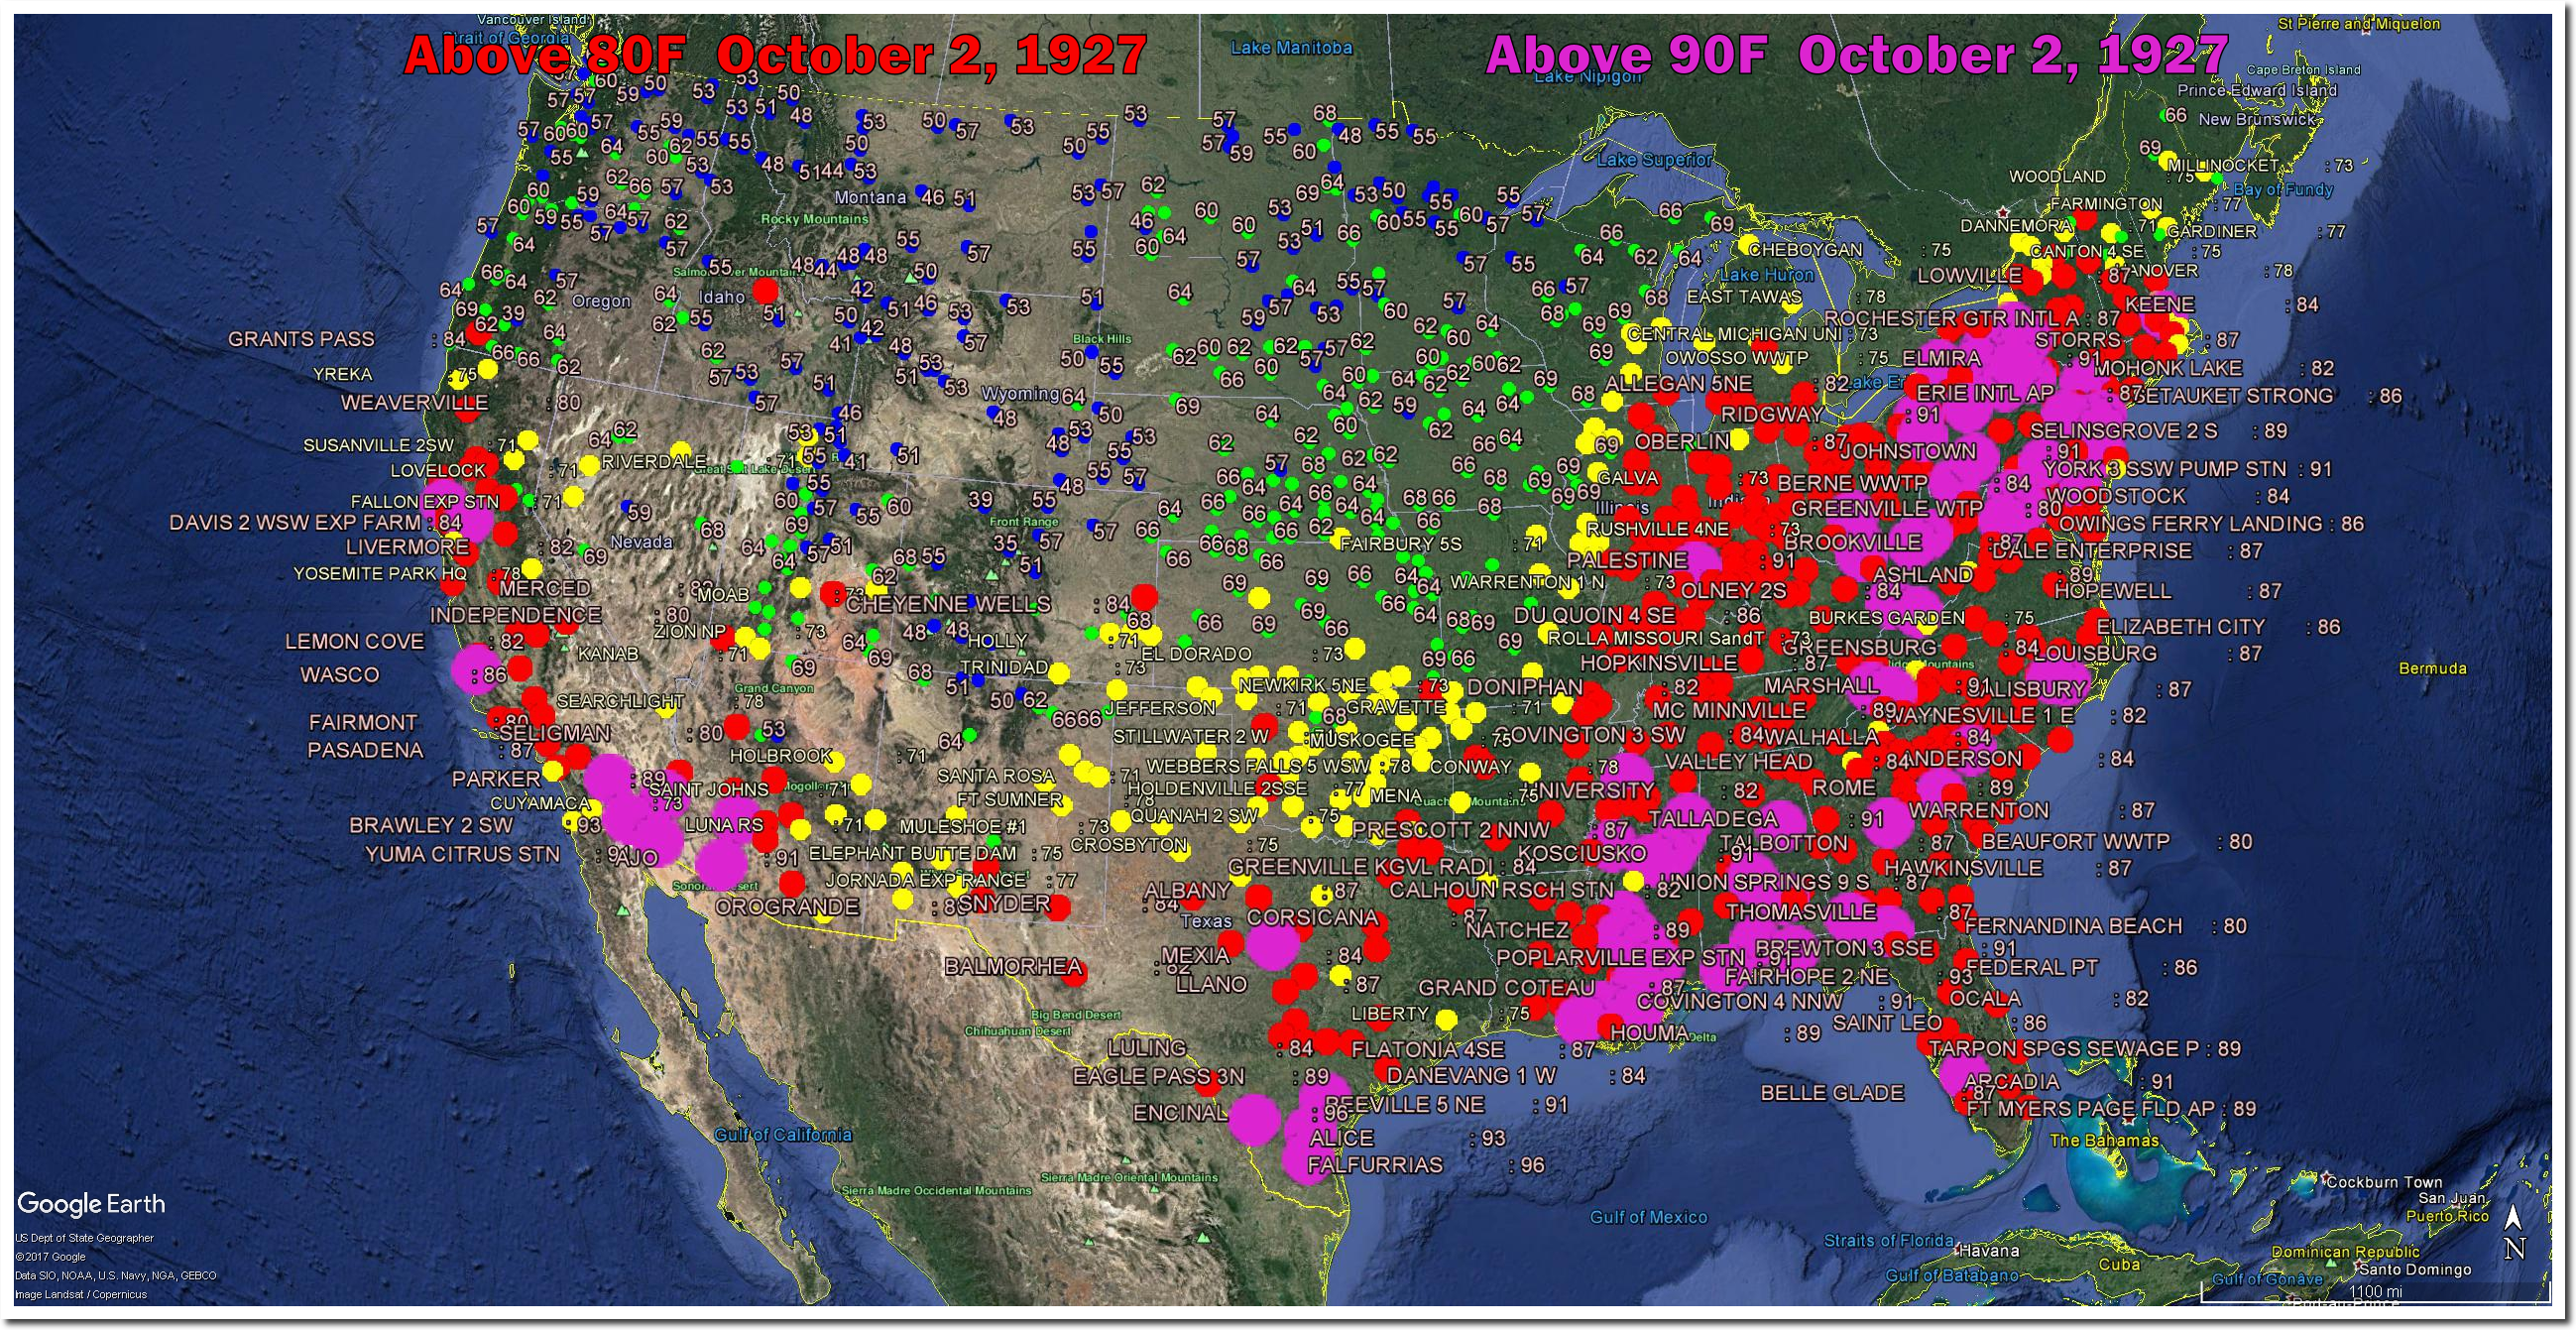
A number of record heatwaves occurred in 1927, including a protracted one in September and October, which killed scores of people.
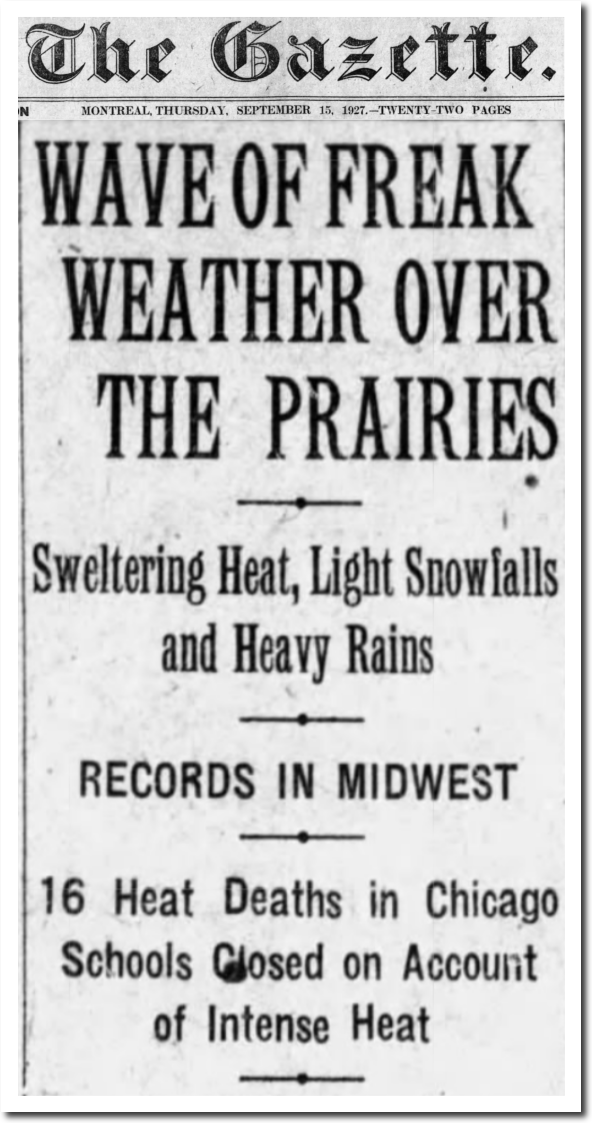
15 Sep 1927, 1 – The Gazette at Newspapers.com
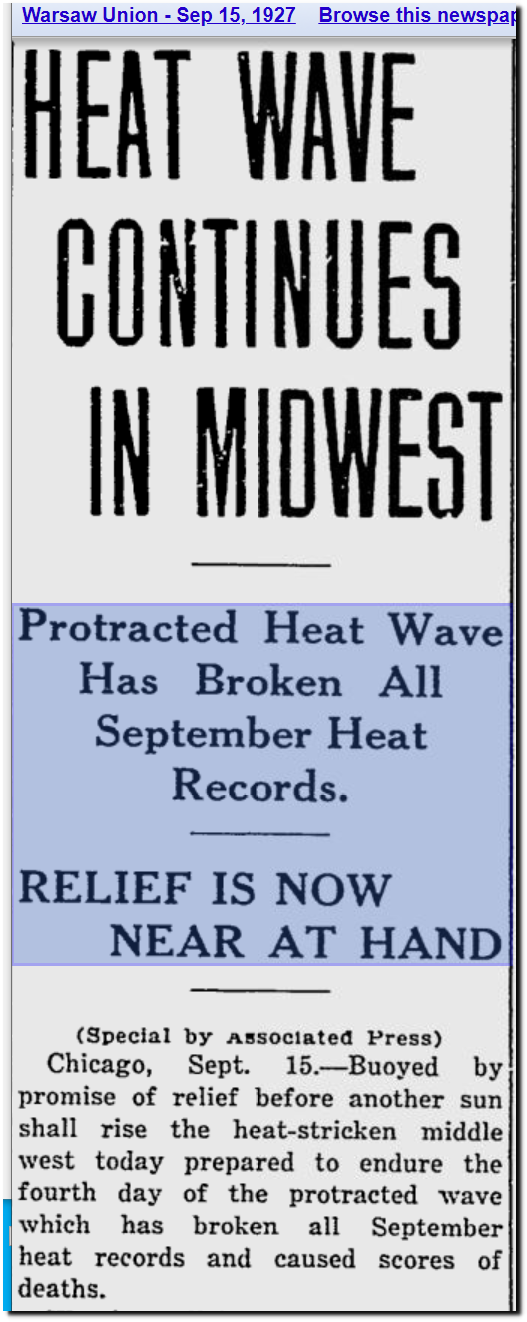
Warsaw Union – Google News Archive Search
On October 2, 1927, temperatures in upstate New York reached 99 degrees.
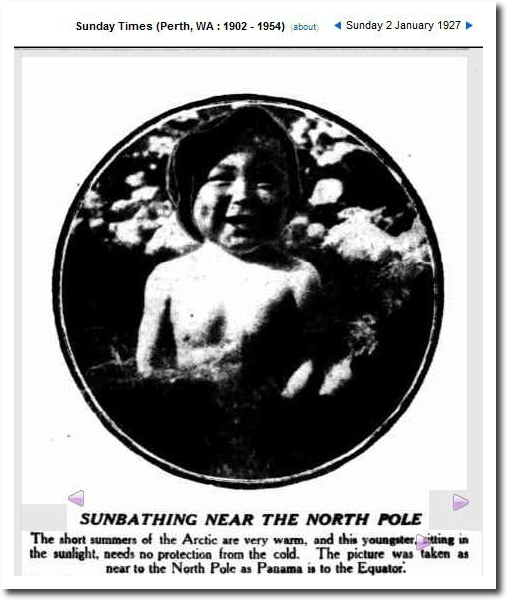
And if all that wasn’t bad enough, children were happily sunbathing near the North Pole.
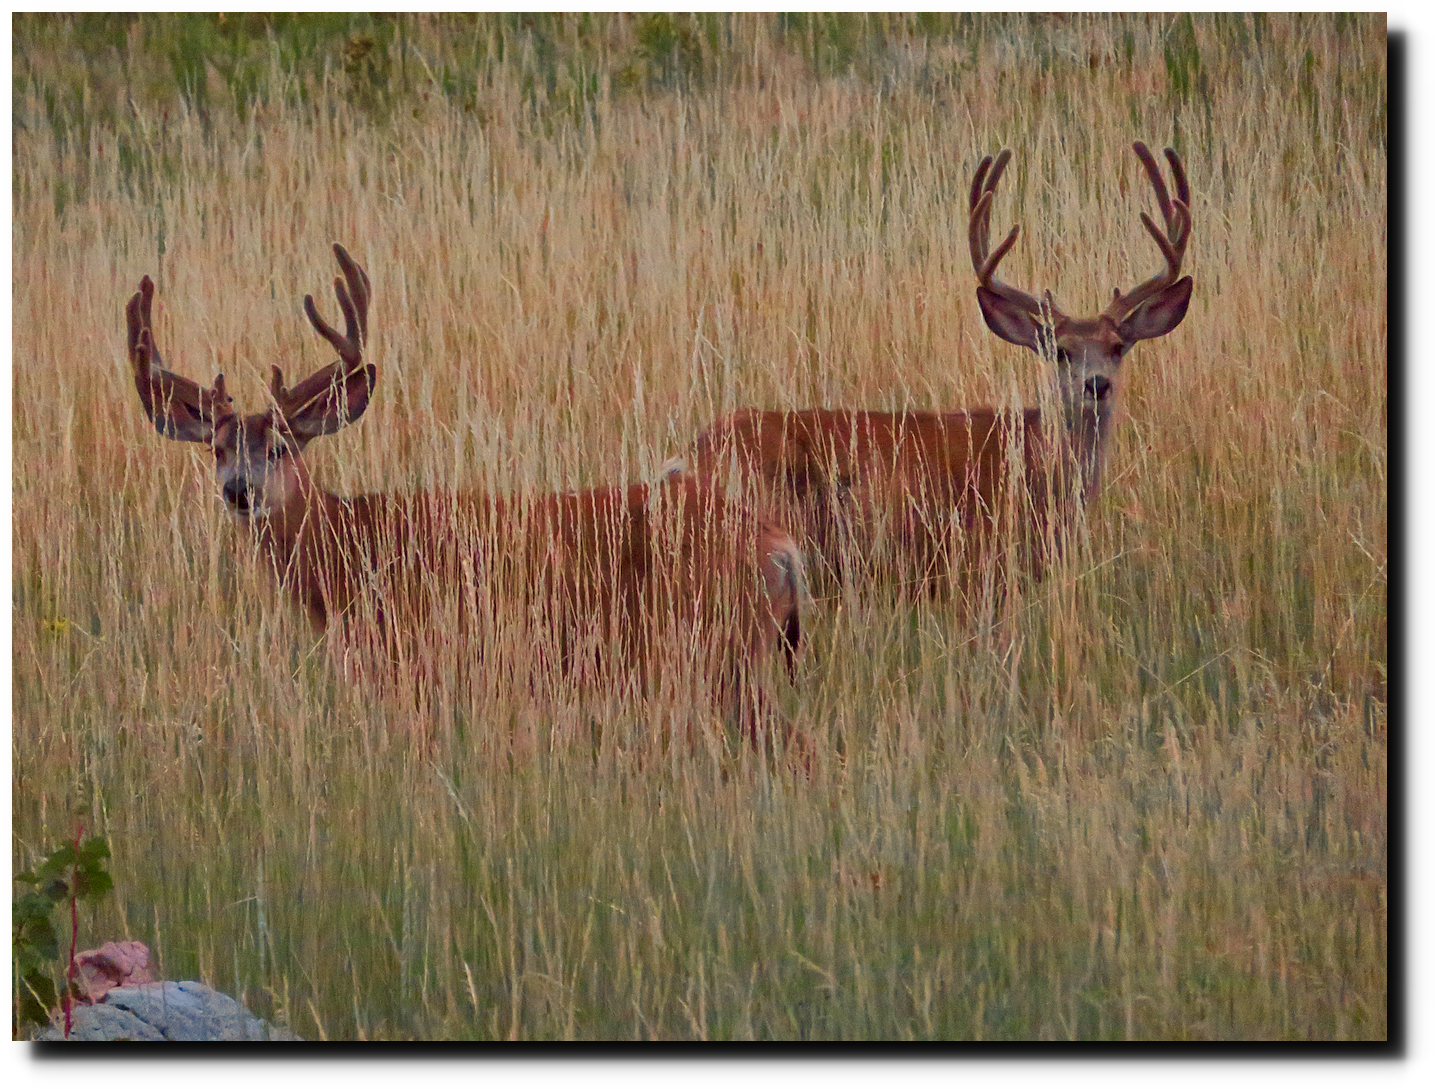
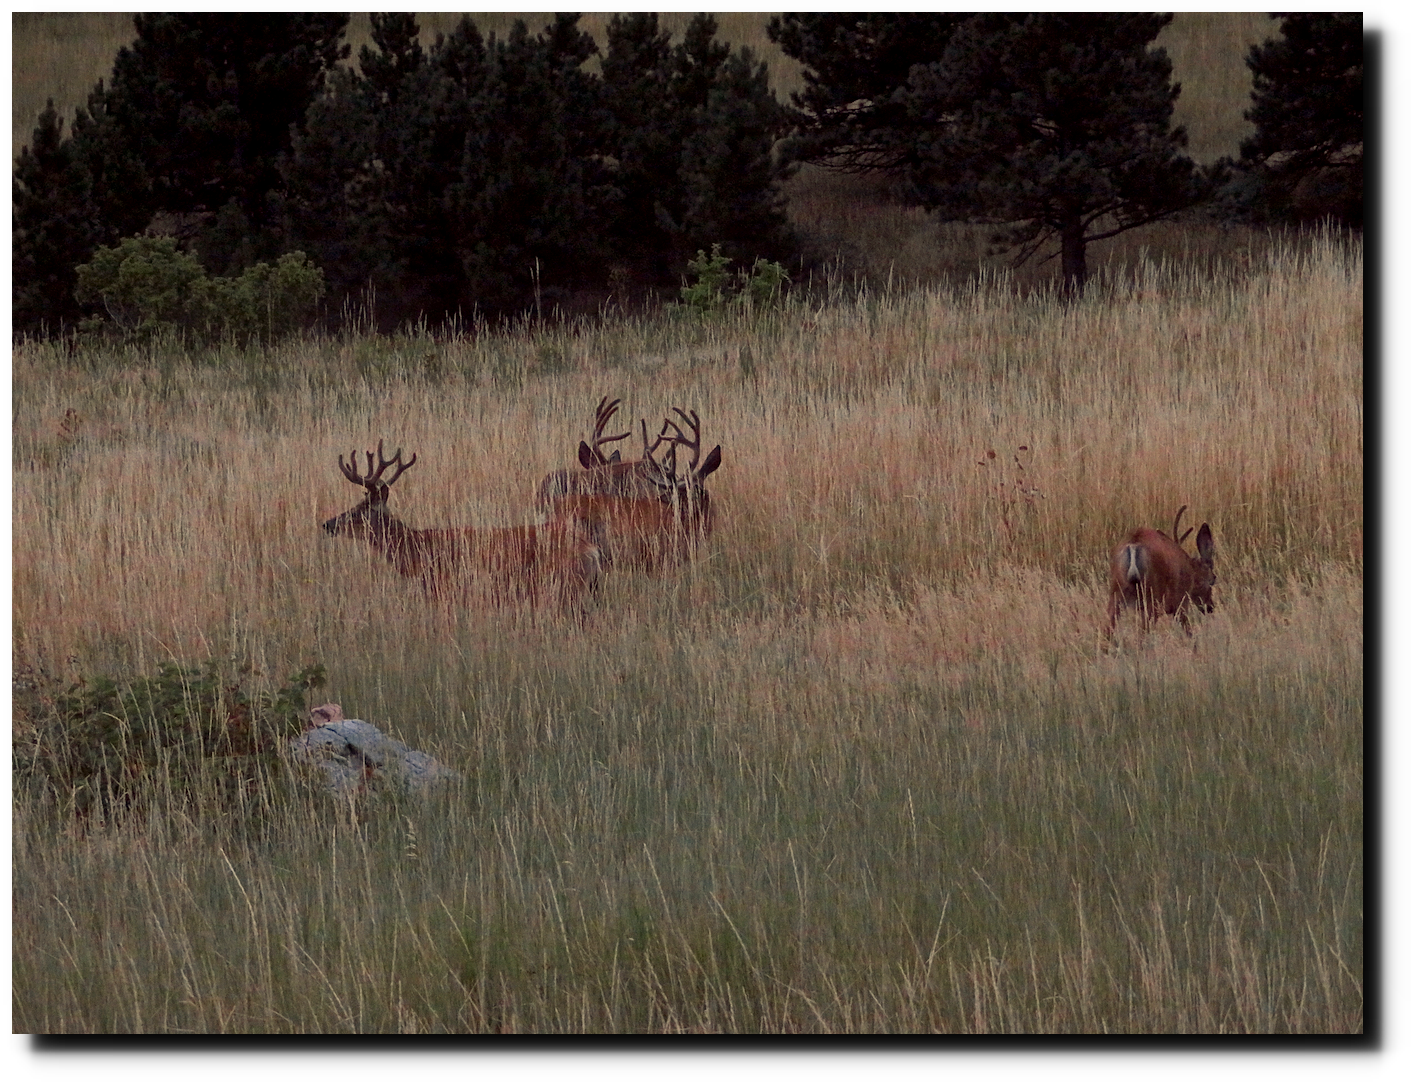
It won’t be long before some of these gents start fighting over the ladies.

Dinesh D’Souza was one of several high profile people jailed for being a dissident by the Obama White House. The swamp needs to be drained.
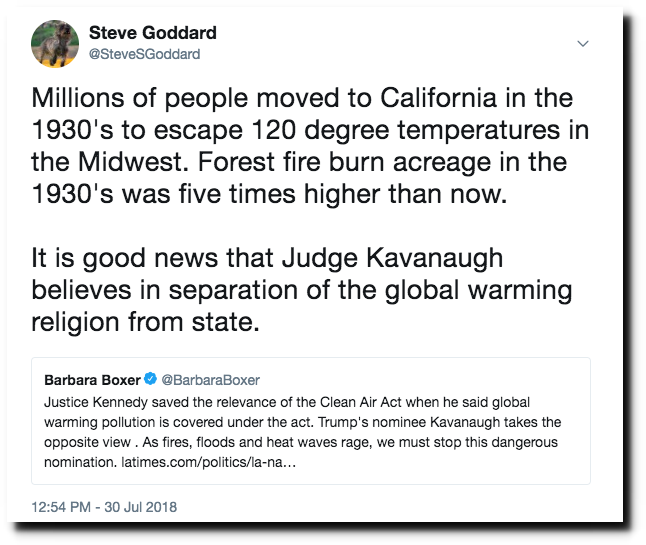
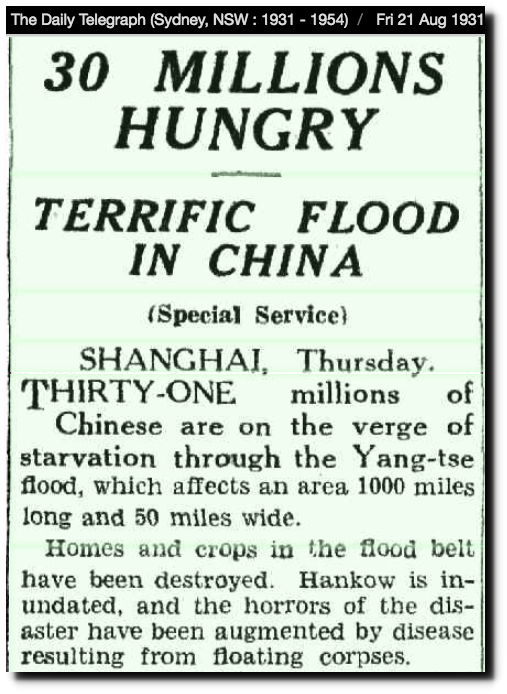
Democrats are hoping to reduce CO2 to 1931 levels, to prevent floods.
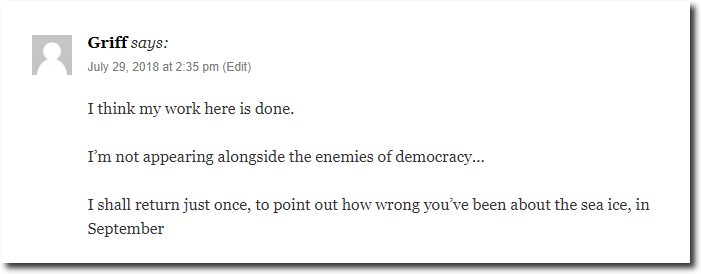
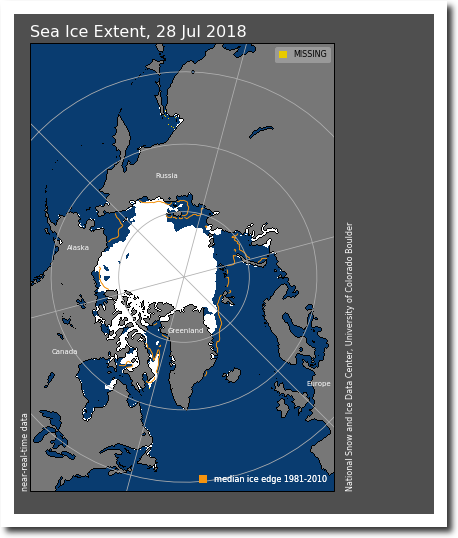
One of our former readers has predicted we are going to see a big Arctic meltdown by September.
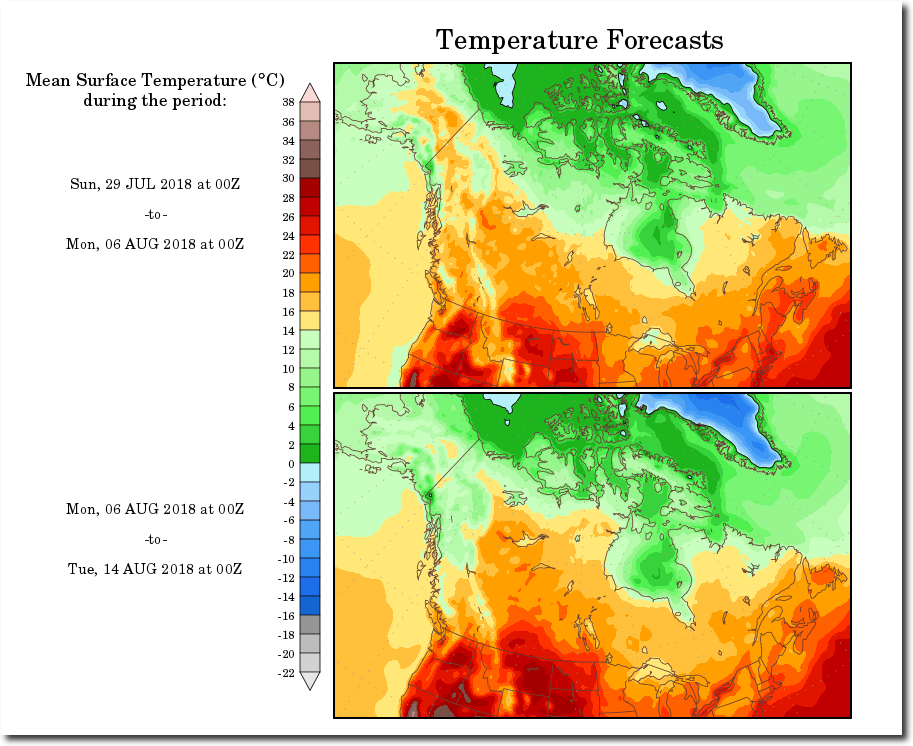
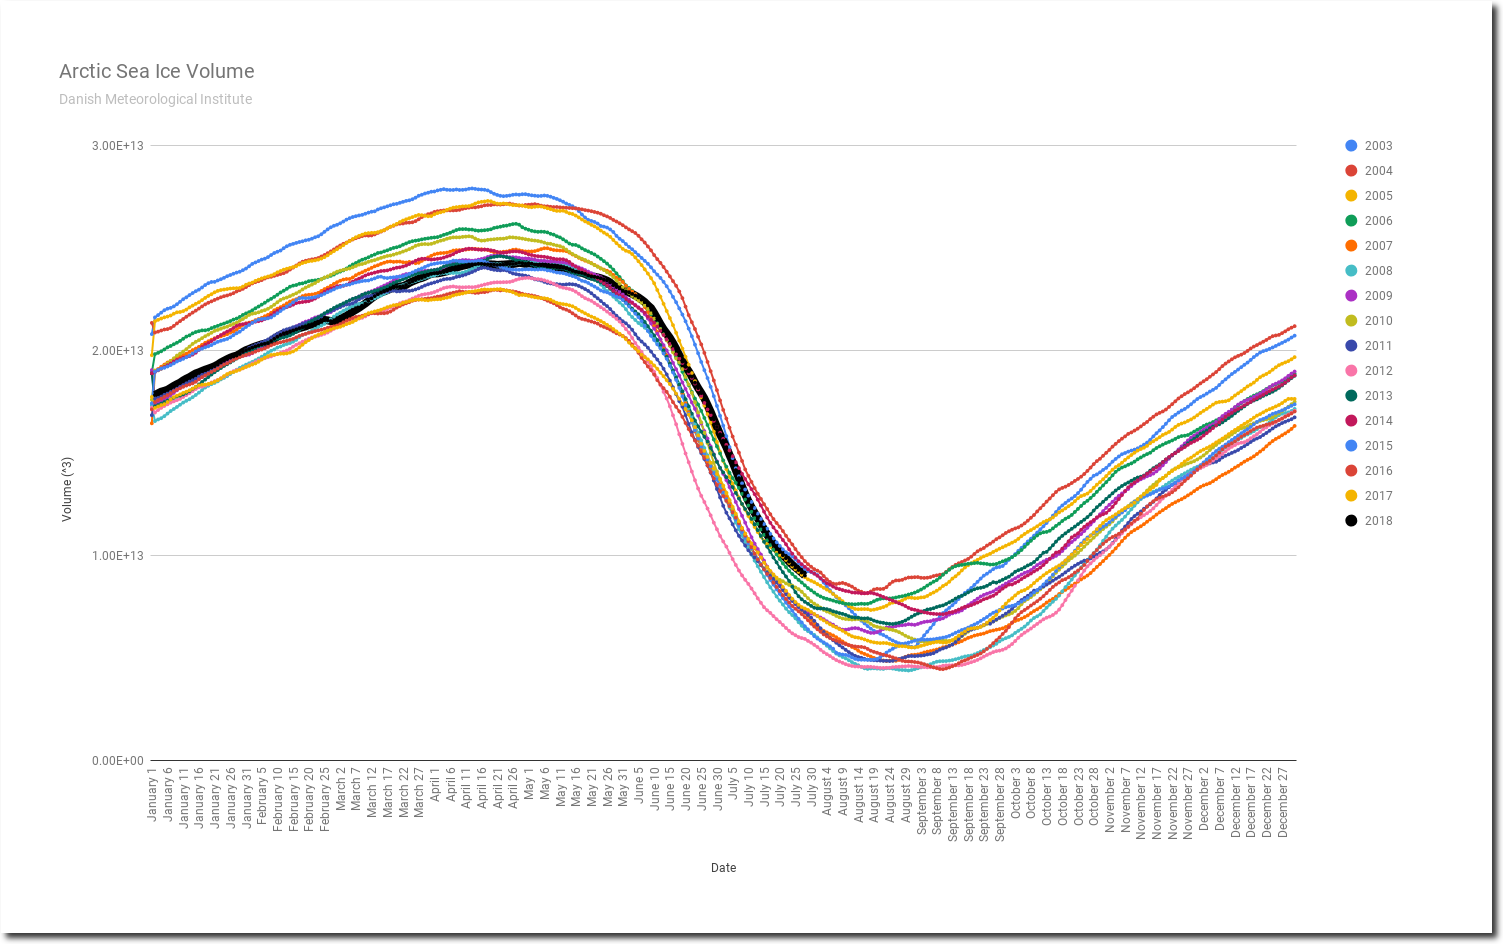
This could be difficult with temperatures below freezing, ice extent in the the Beaufort sea beyond the 1981-2010 median, and sea ice volume close to the highest for the date in the last 15 years.
Throughout his career, James Hansen has demonstrated an uncanny ability to be wrong nearly 100% of the time about both the future and the past.
Dr. James E. Hansen, director of the Goddard Institute for Space Studies, who presented recent data compiled from computer models, said that predicted regional effects of global warming show that the chances of summer drought in the low and middle latitudes would be 1 in 3 by the year 2030, as against 1 in 20 in the 1950’s.
- James Hansen 1988
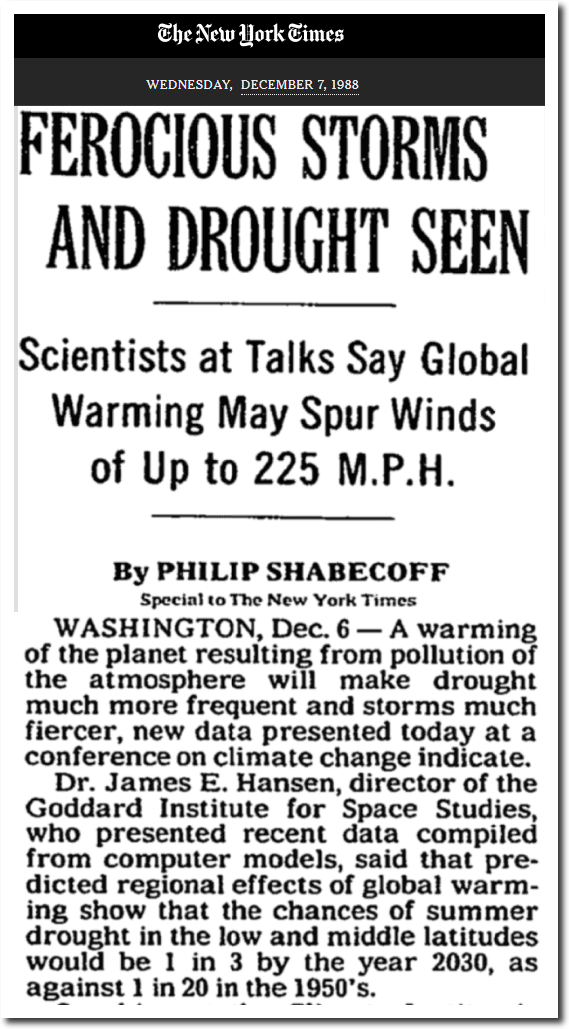
FEROCIOUS STORMS AND DROUGHT SEEN – The New York Times
The 1950’s had the most persistent droughts on record, with the US in drought about 50% of the time, not 5% as Hansen claimed Since then, and particularly since Hansen’s 1988 forecast, the US has been getting and wetter and droughts have become infrequent.
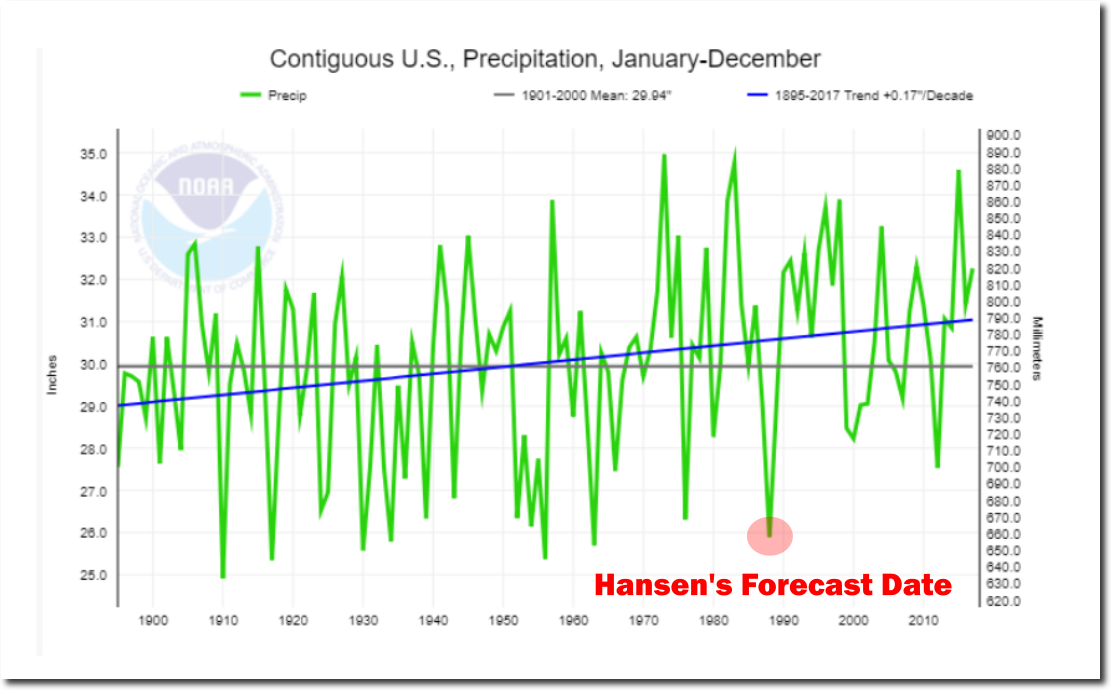
Climate at a Glance | National Centers for Environmental Information (NCEI)
Out here in the west, we are having the wettest permanent drought on record, with the rain pouring down day after day – and lots more in the forecast.
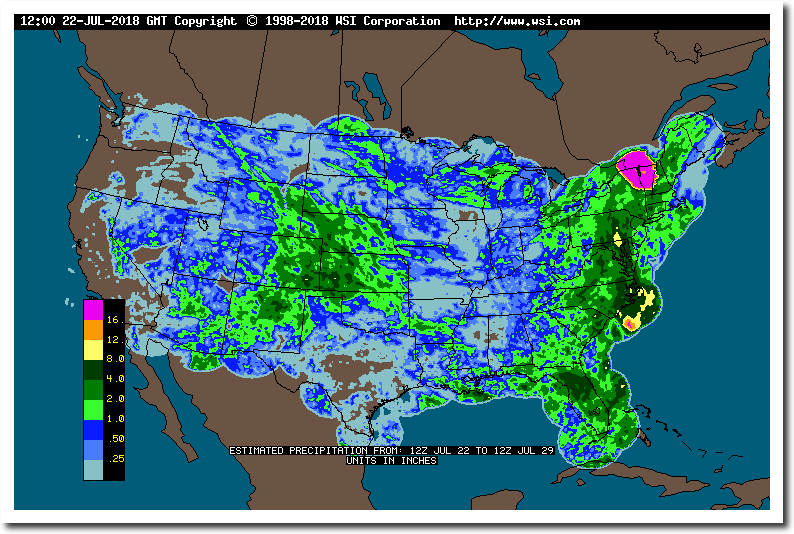
Intellicast – Weekly Precipitation in United States
Hansen’s incompetence combined with his air of certainty and total lack of concern for the truth, makes him the perfect Democrat.

NOAA has known for 30 years that the US is not warming.
U.S. Data Since 1895 Fail To Show Warming Trend – NYTimes.com
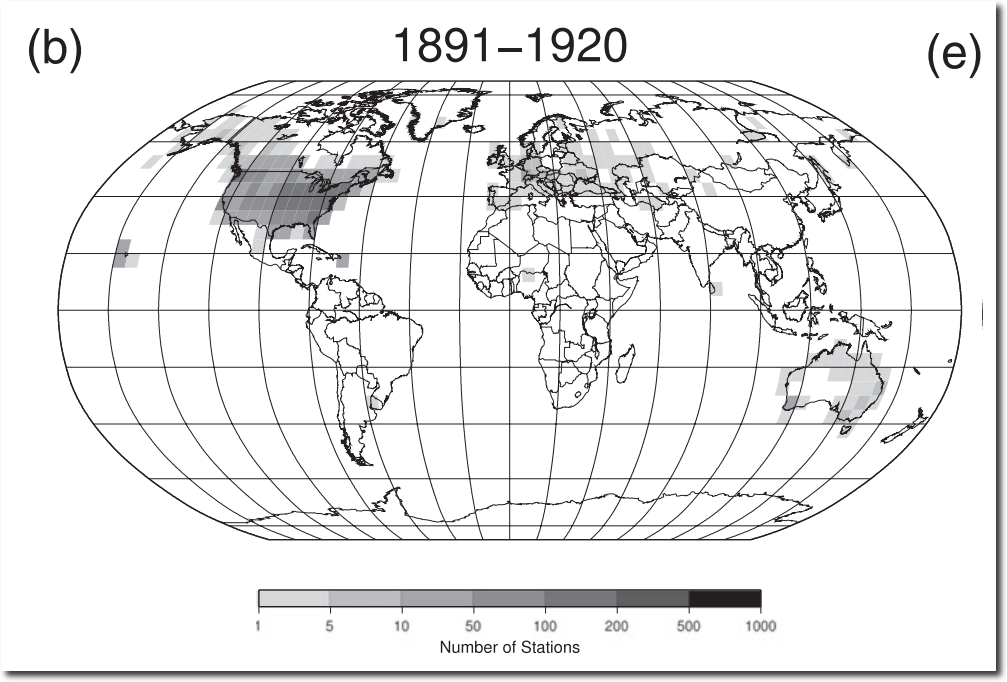
In 1999, NASA’s James Hansen was concerned that the very high quality US temperature record didn’t match Hansen’s fake global warming trend.
How can the absence of clear climate change in the United States be reconciled with continued reports of record global temperature? Part of the “answer” is that U.S. climate has been following a different course than global climate, at least so far. Figure 1 compares the temperature history in the U.S. and the world for the past 120 years.
in the U.S. there has been little temperature change in the past 50 years, the time of rapidly increasing greenhouse gases — in fact, there was a slight cooling throughout much of the country
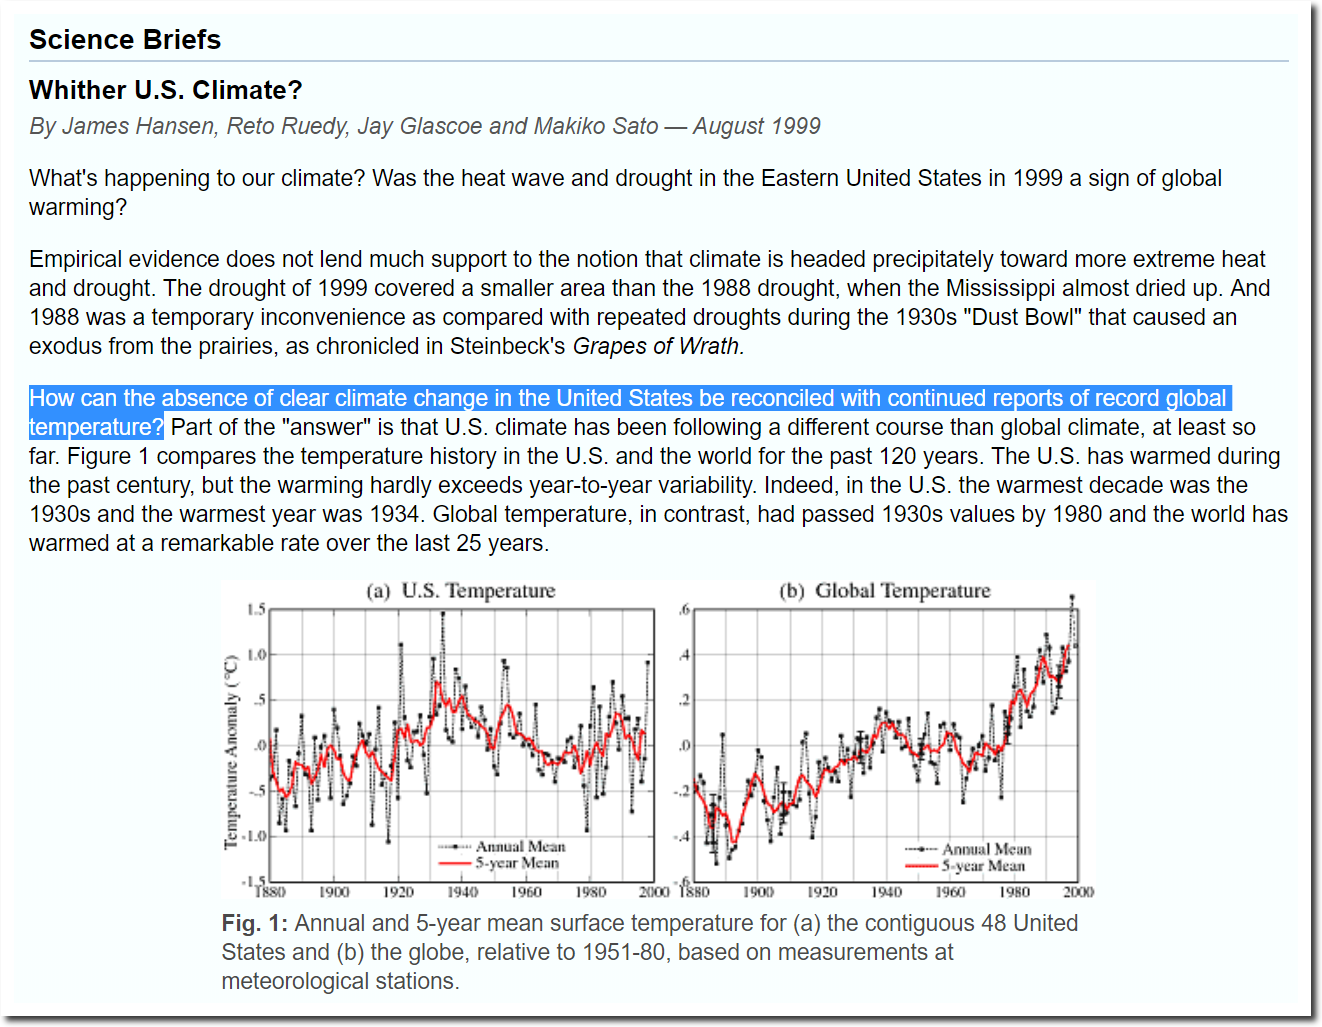
NASA GISS: Science Briefs: Whither U.S. Climate?
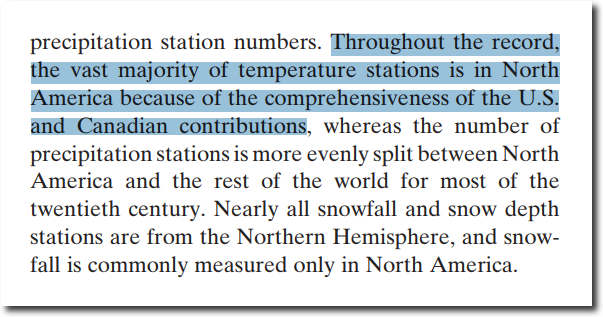
This was particularly troubling, because the vast majority of high quality stations are located in the US, and most of the world actually has no reliable long term data.
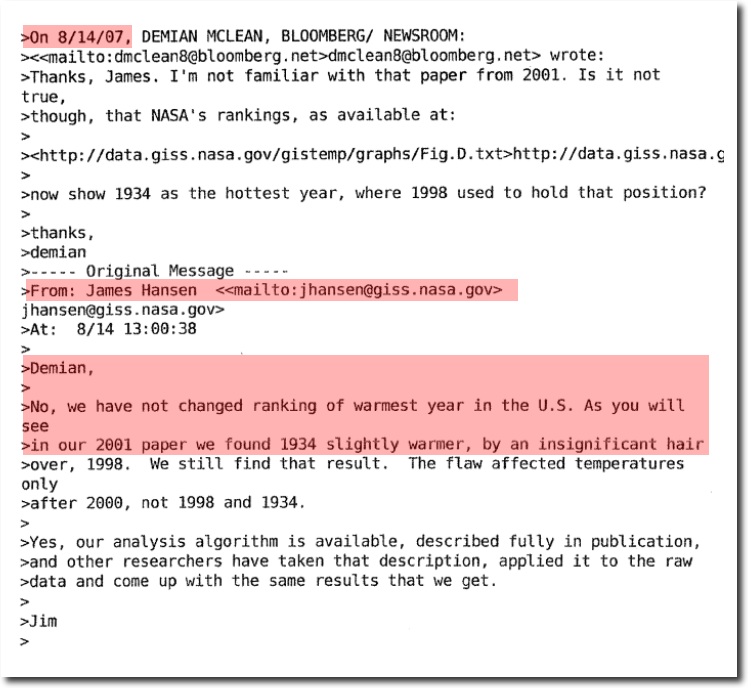
Hansen resolved the problem by knocking more than 0.5C off 1934, and adding nearly that much on to 1998 – thus turning US cooling into warming.
Then he lied about it to journalists.
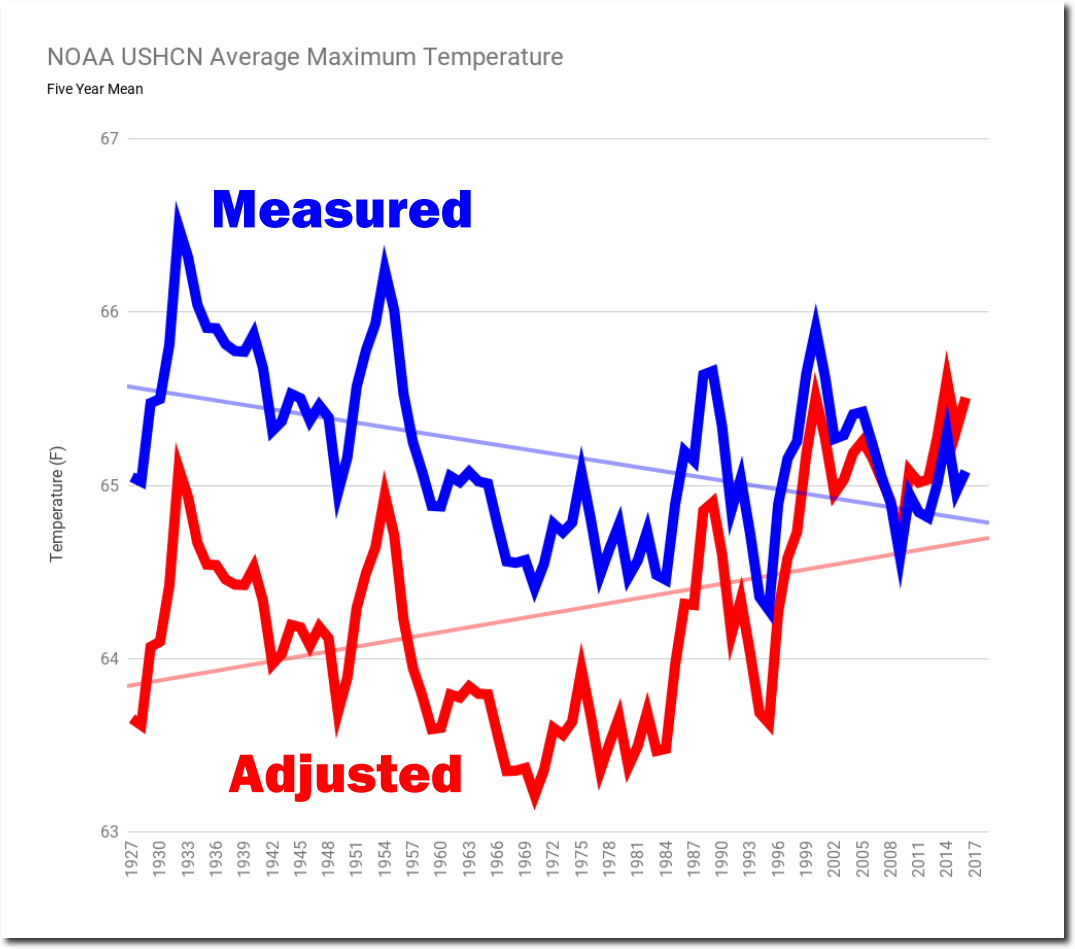
The data tampering on the world’s highest quality data set is very impressive, turning 90 years of cooling into warming.
A lot of this is done using the Time Of Observation Bias (TOBS) adjustment – which started as 0.3F, and later magically changed into 0.3C.
USHCN V2 (0.3F)
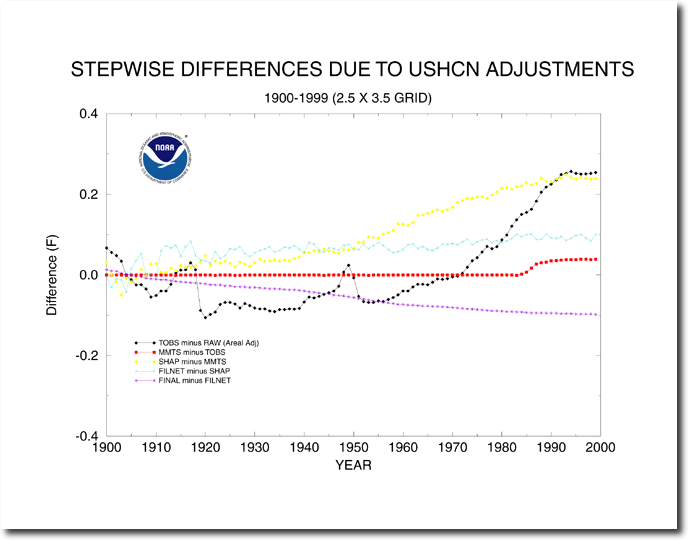
USHCN V3 (0.3C)
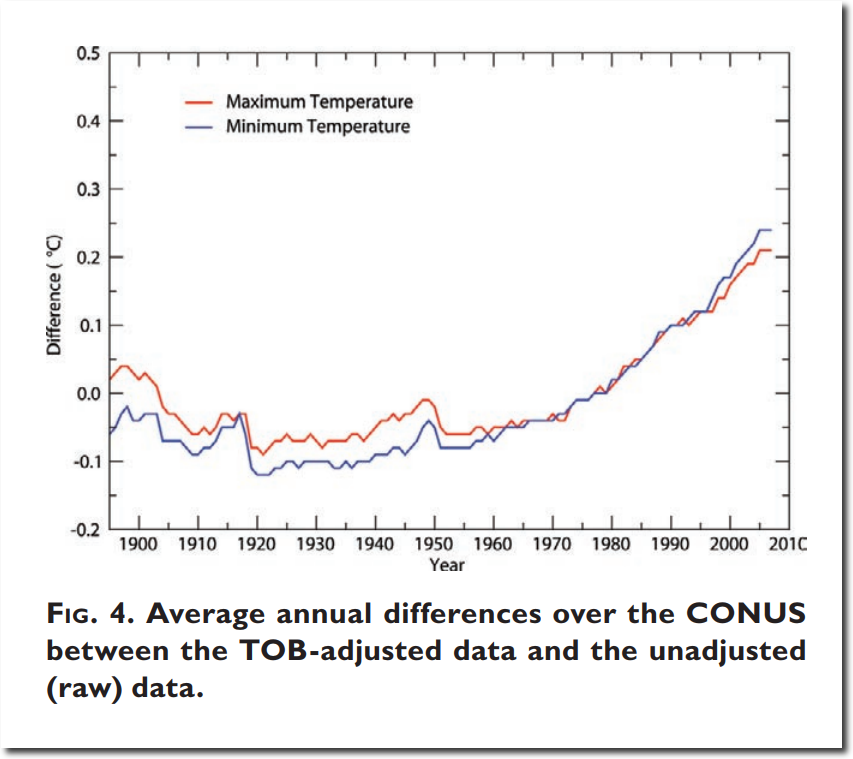
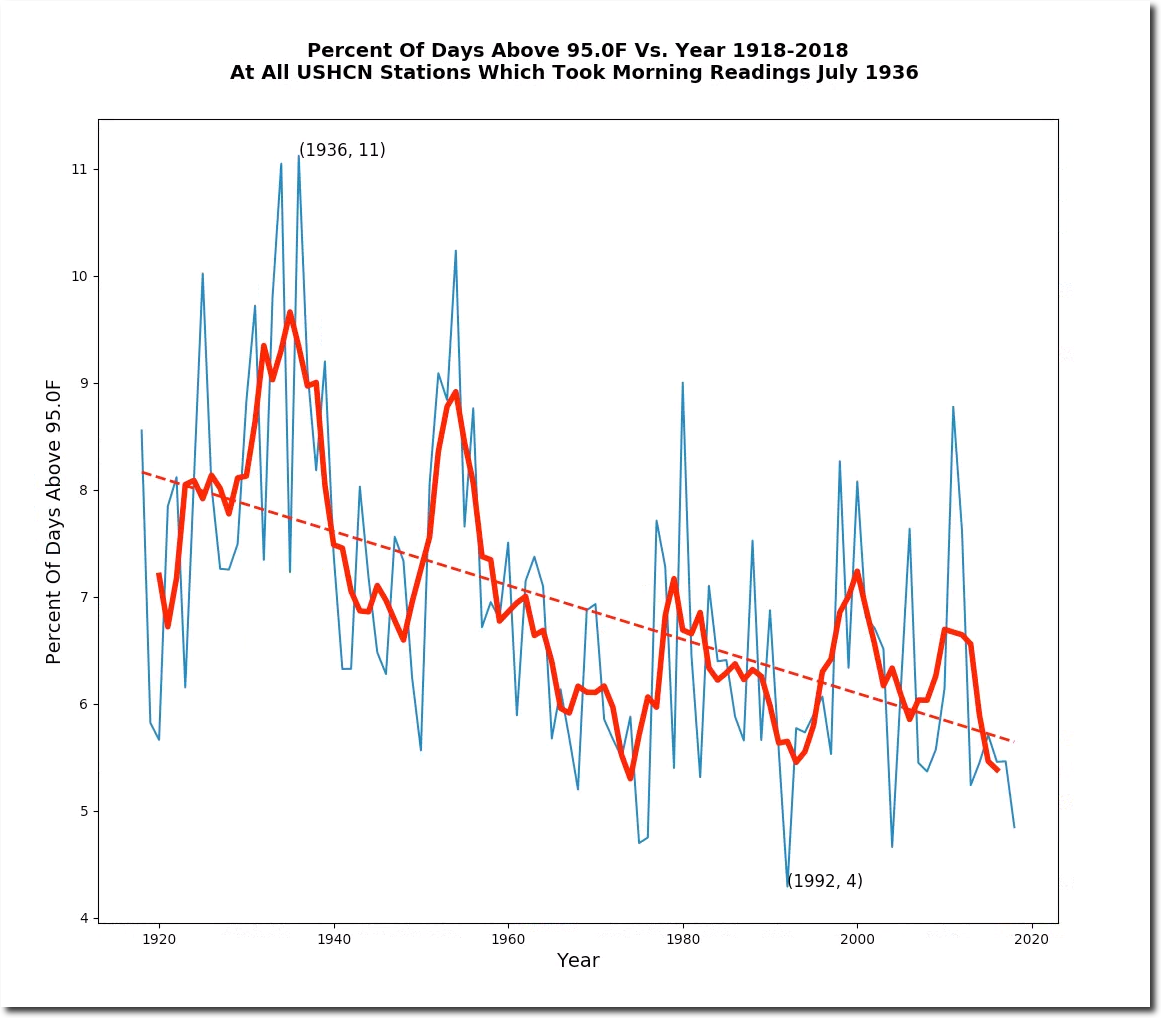
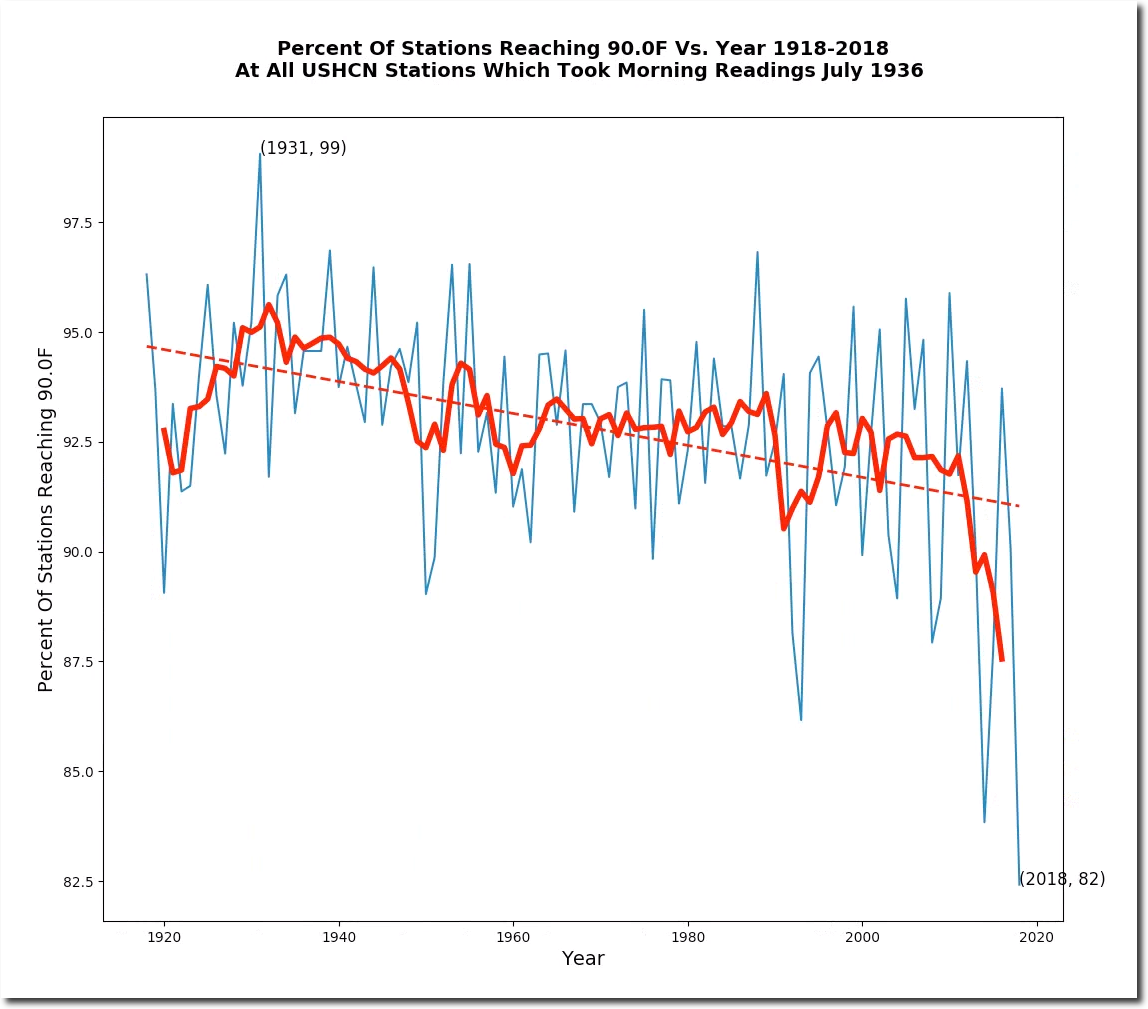
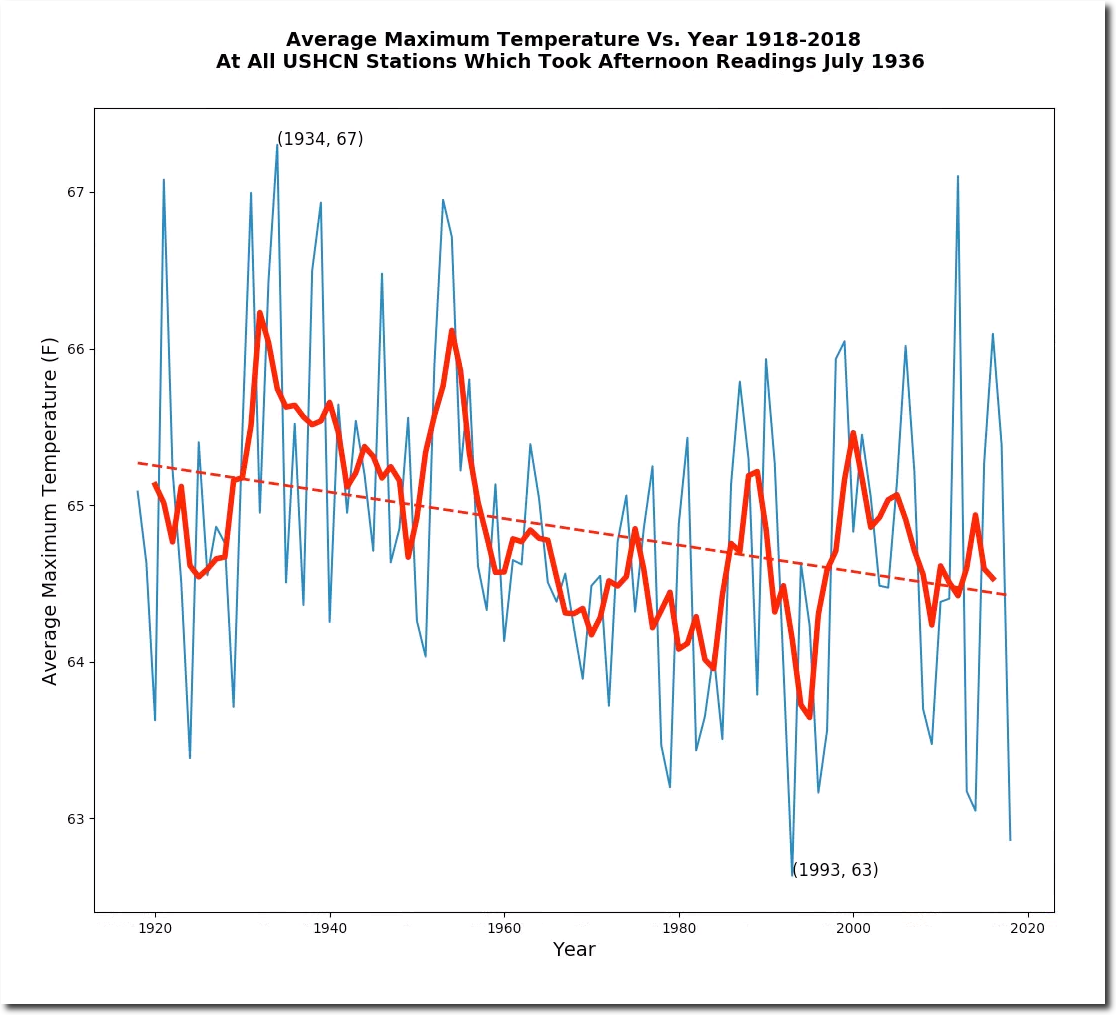
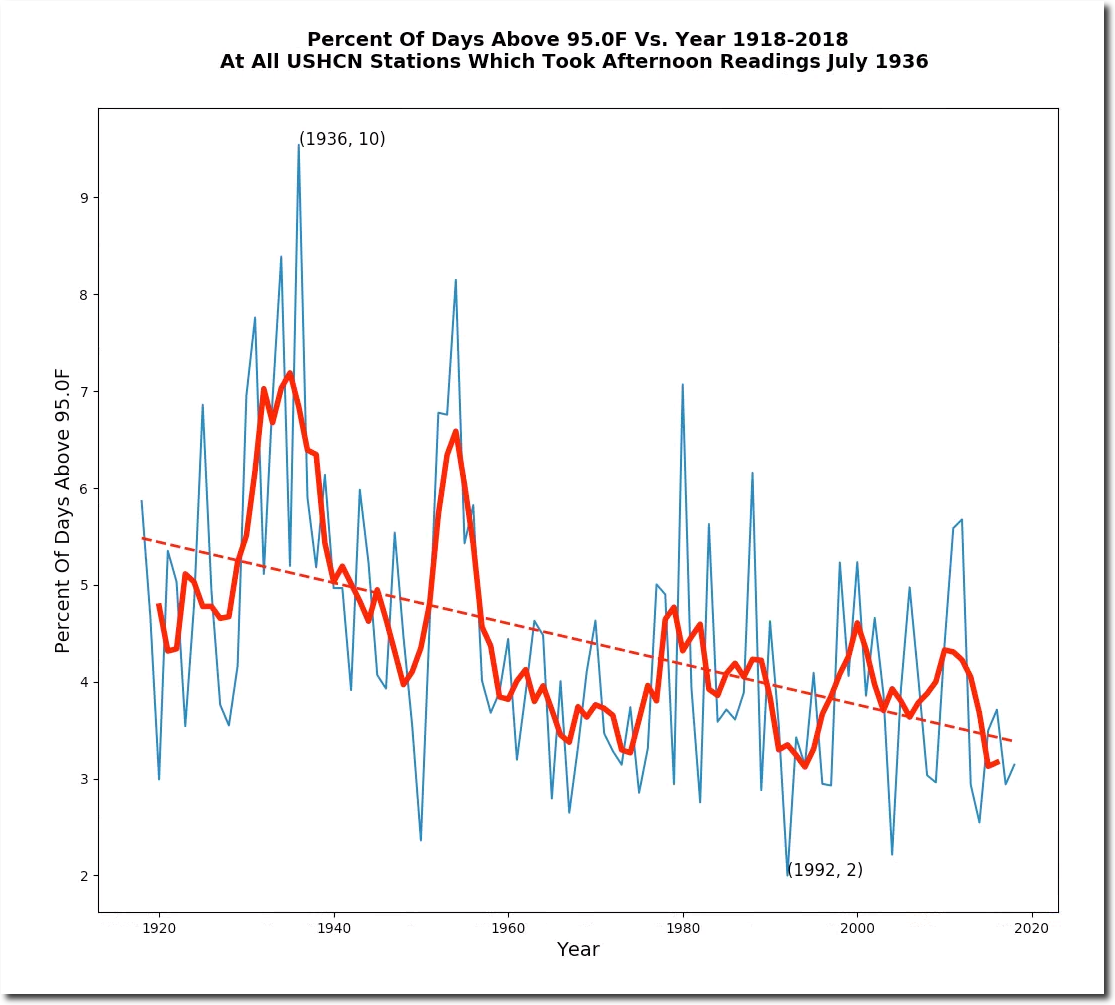
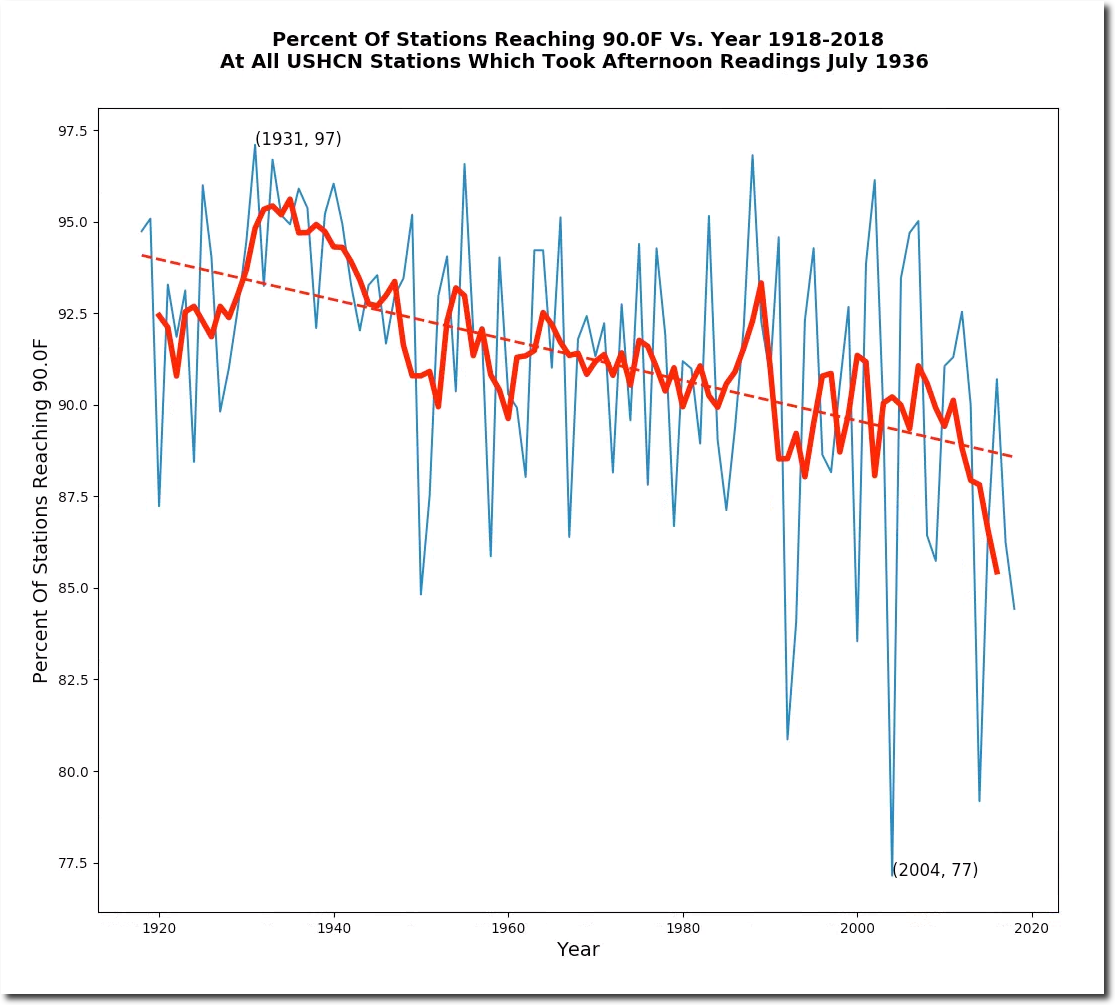
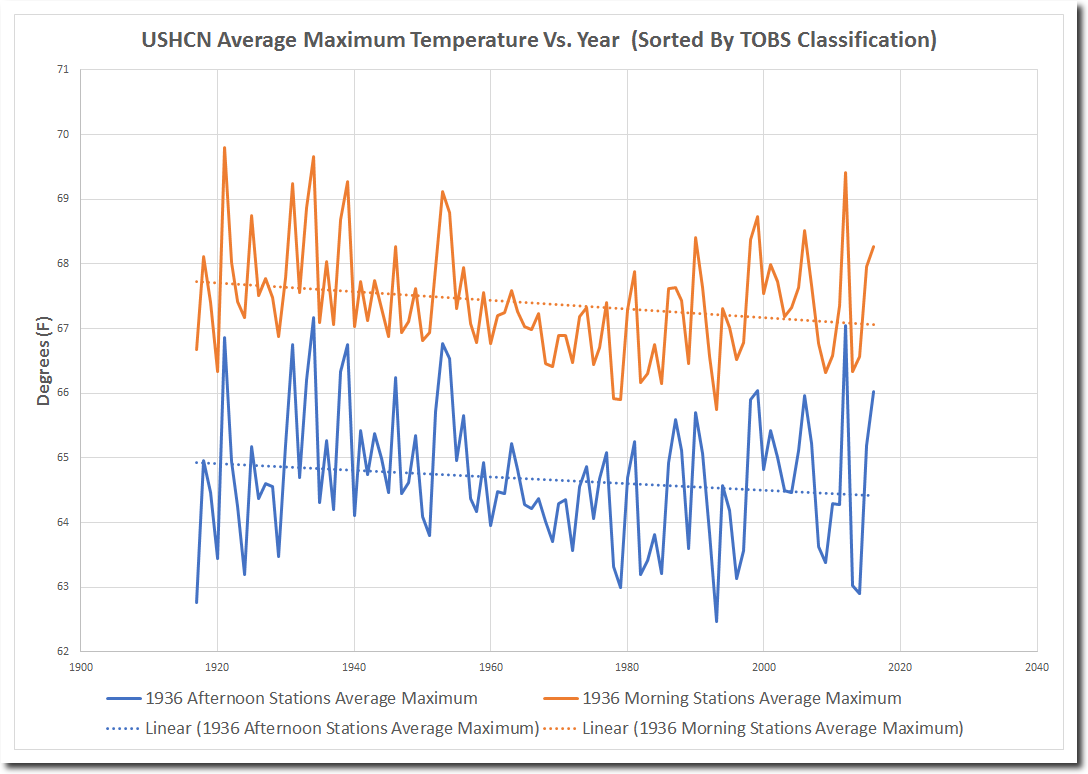
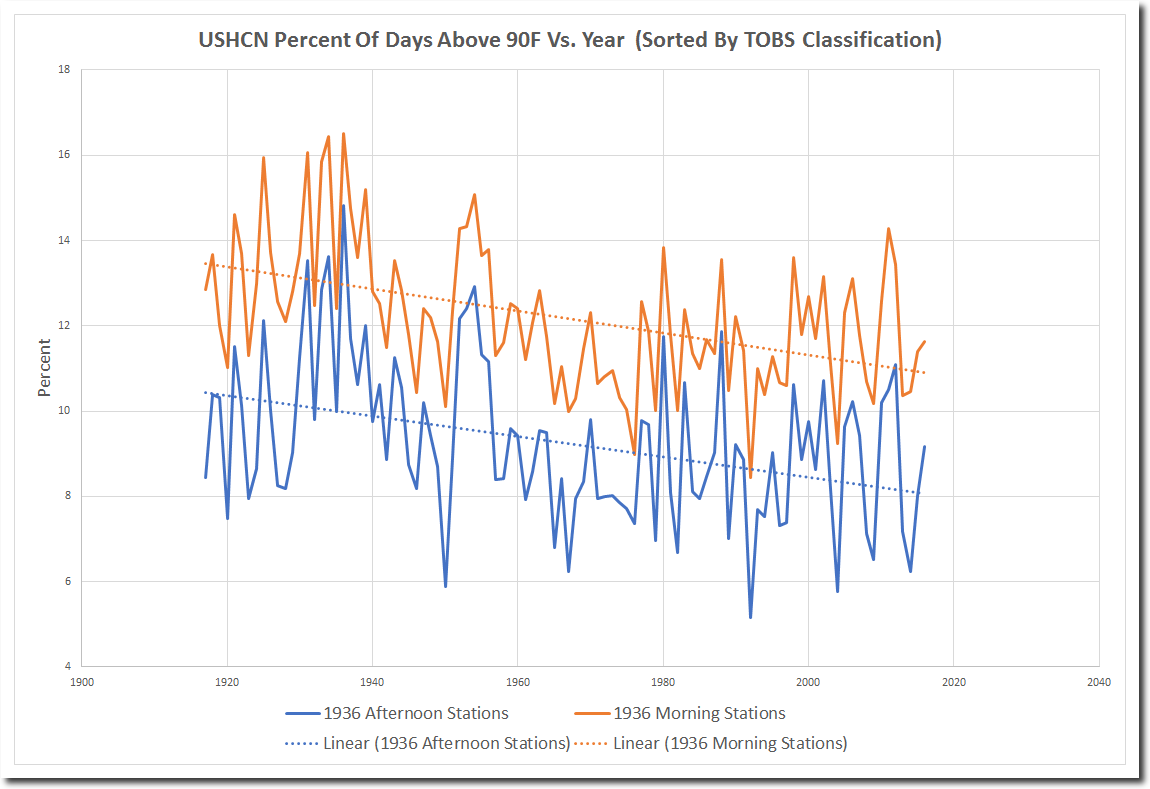
The TOBS adjustment is based on the theory that if you reset your min/max thermometer in the afternoon, you will double count some hot days – and that people used to reset thermometers in the afternoon, but now do it in the morning. This is easy enough to test out, by comparing trends at stations which took their readings in the morning or night during July 1936, versus stations which took their readings in the afternoon. The data shows that there is no difference in the trends between the two groups of stations. Both data sets show a sharp decline in maximum temperatures.
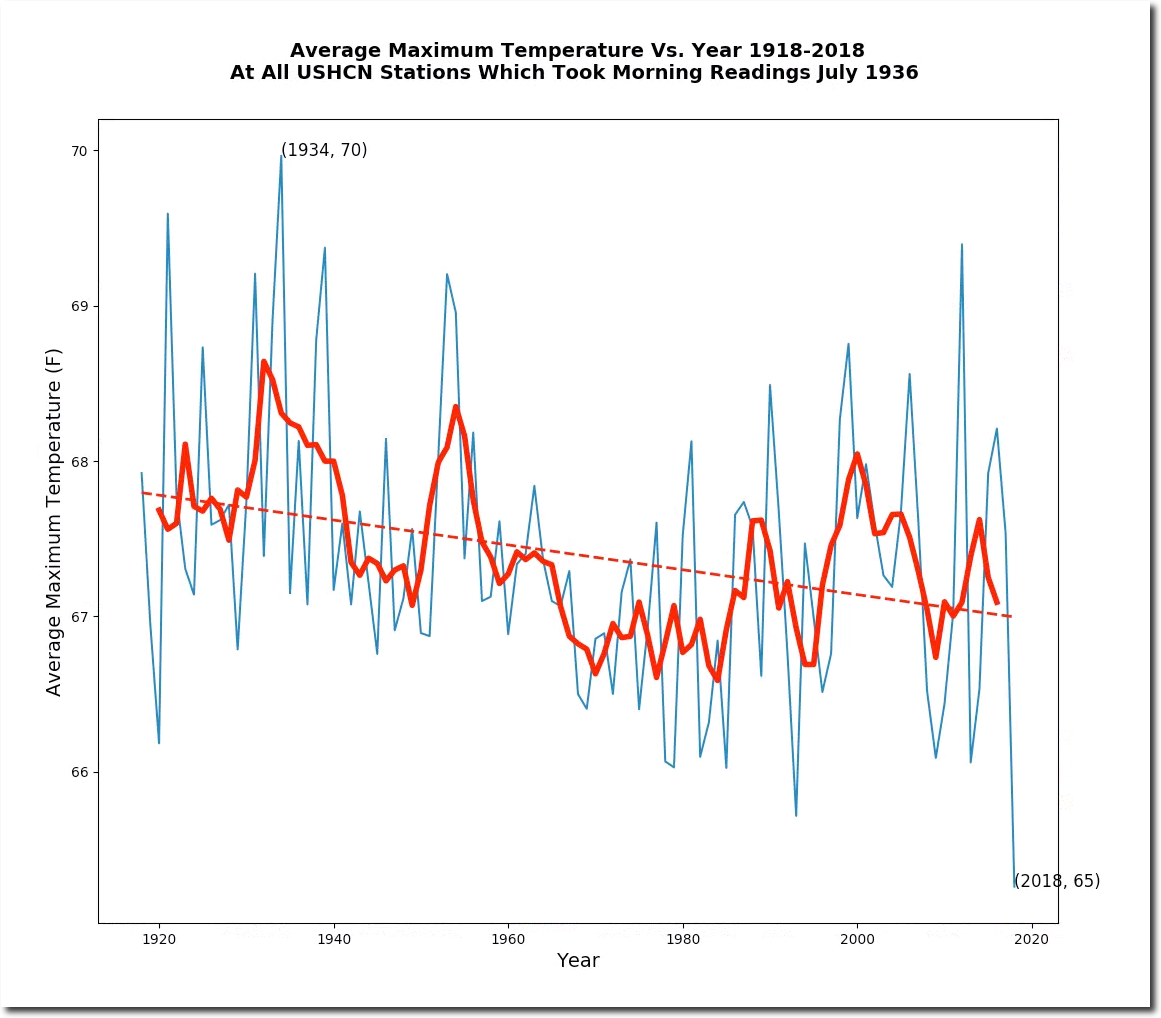
The only difference is that morning stations tend to be hotter, because they tend to be located at lower latitudes where people like to go outside earlier.
Looking specifically at Missouri temperatures during July/August 1936, there is no difference in temperatures between the two groups. Both averaged 99.8 degrees. Compare vs July 2018, which has seen no 100 degree days in Missouri, and an average temperature of 89.8 degrees – ten degrees cooler than 1936.
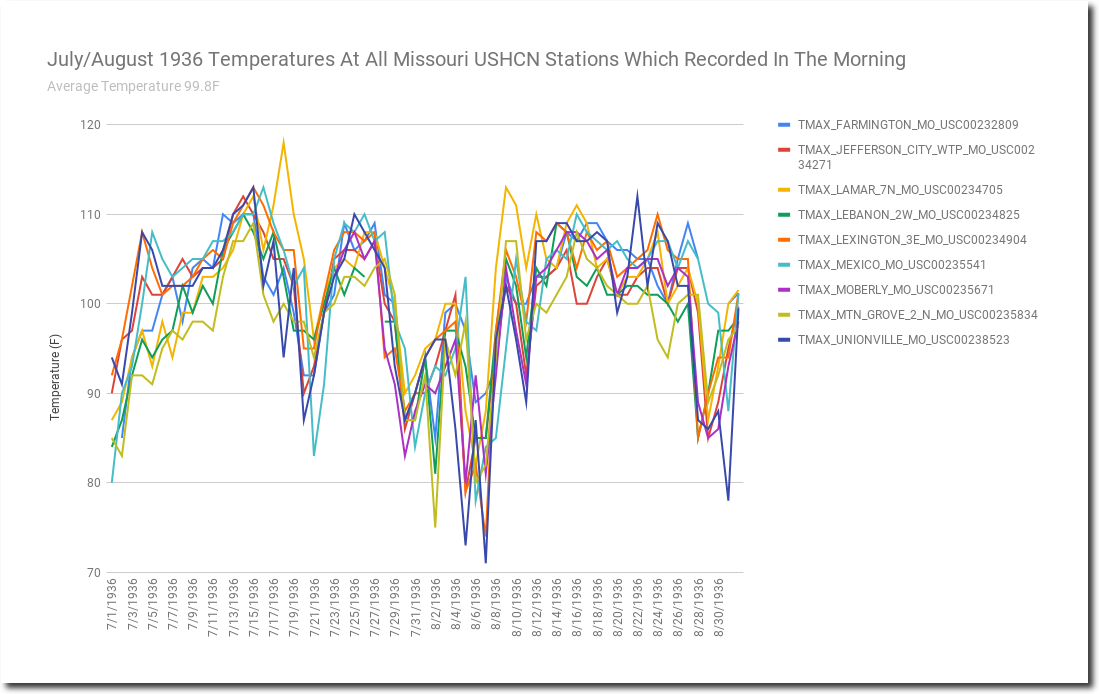
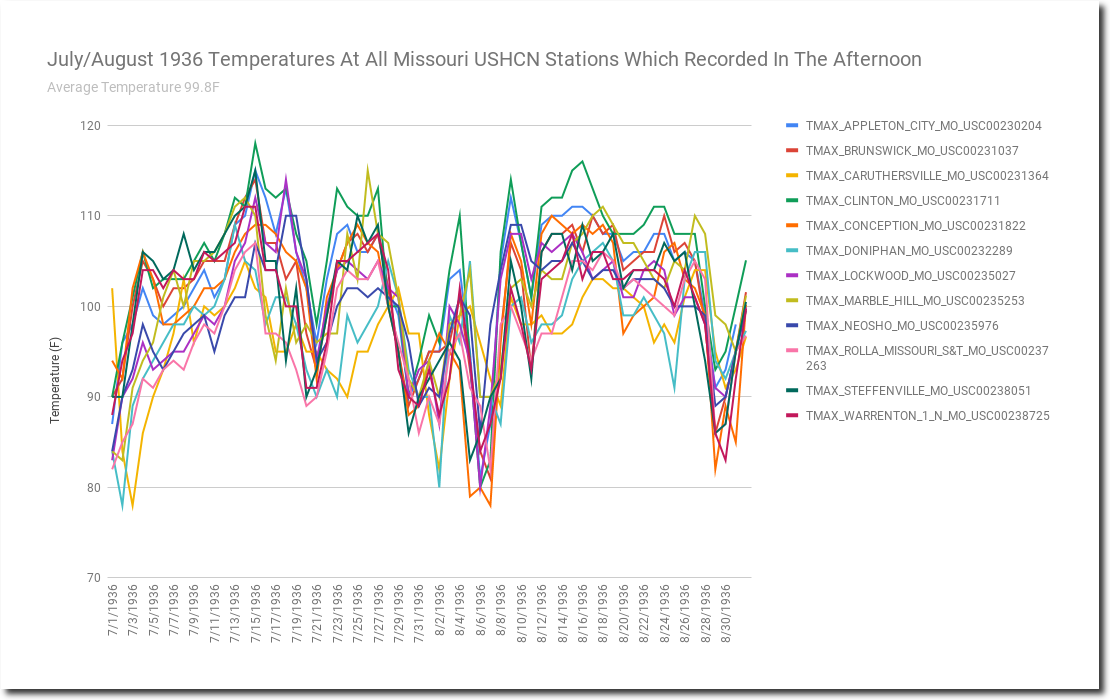
Mexico, Missouri took their readings in the morning, and averaged 101 degrees during July/August 1936. Warrenton, Missouri took their readings in the afternoon, and averaged 100 degrees.
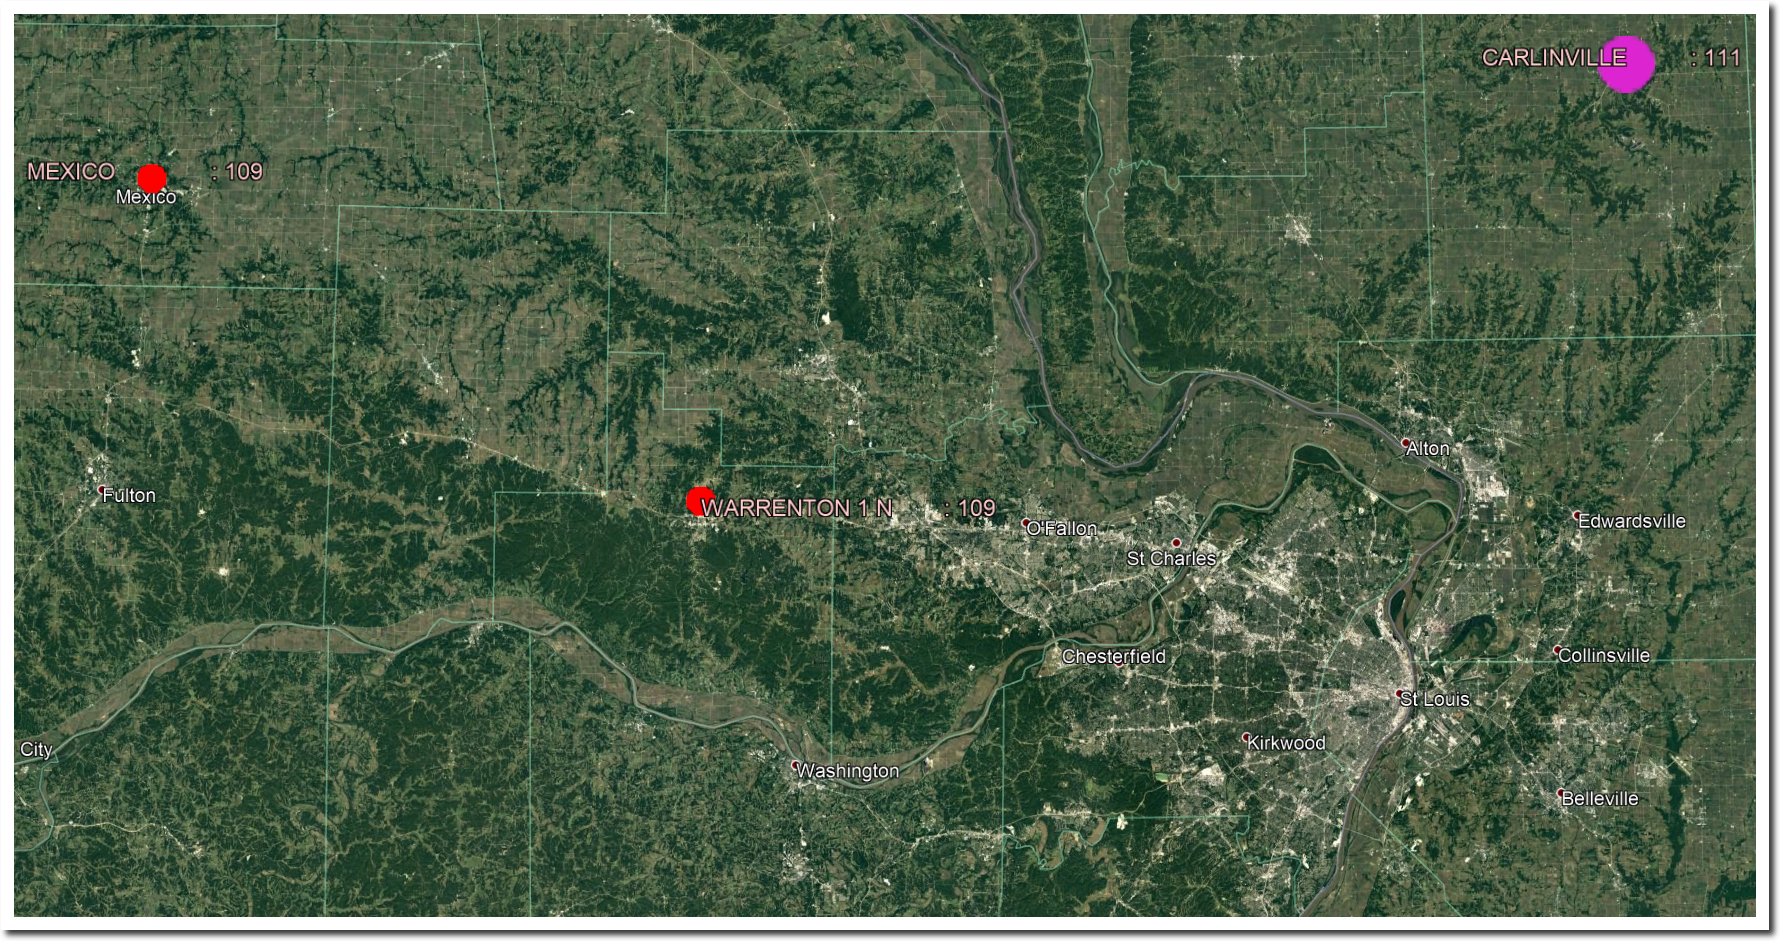
One difference is that the morning station (Mexico) tends to be shifted by a day, because they report maximum temperatures from the day before.
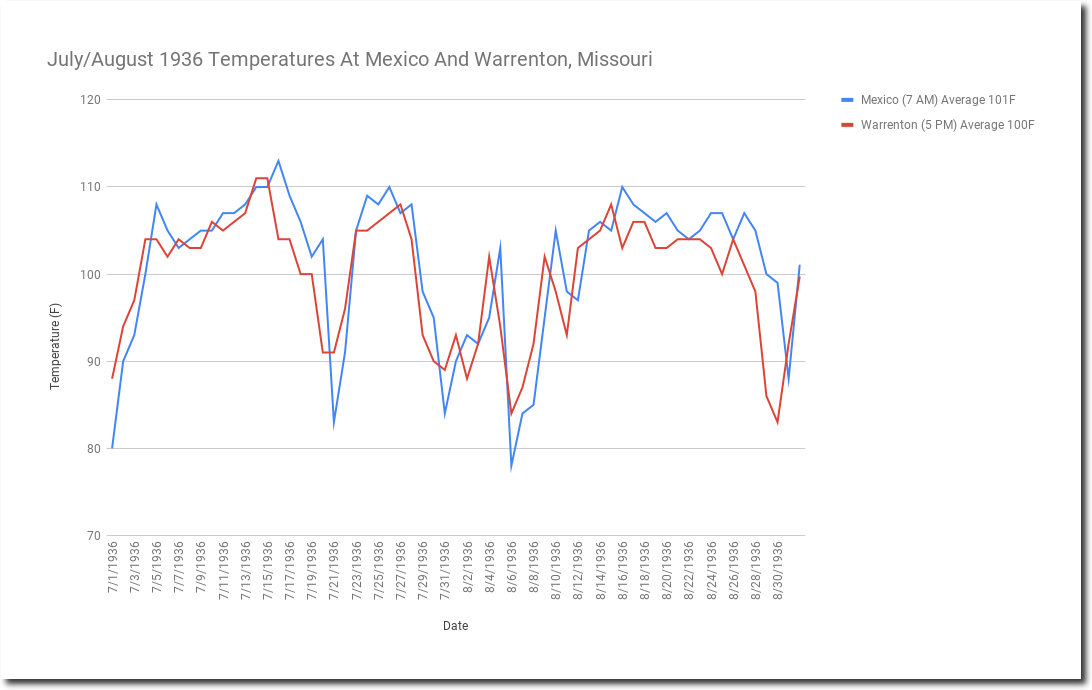
For example on this date (July 29) in 1930, Mexico, Missouri reported 113 degrees when none of the other stations came close to that. The really hot day was July 28.
The bottom line is that the NOAA US temperature adjustments are completely fraudulent and destroy perceptions of the US temperature trend. They turn a long term cooling trend into a long term warming trend. And this was done to justify the even more fraudulent global temperature record.


