Number Of US Forest Fires Continues To Decline

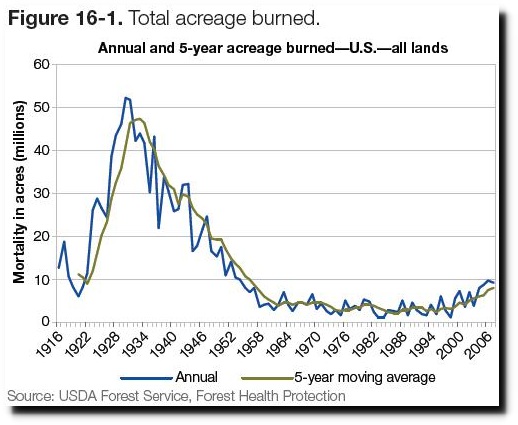
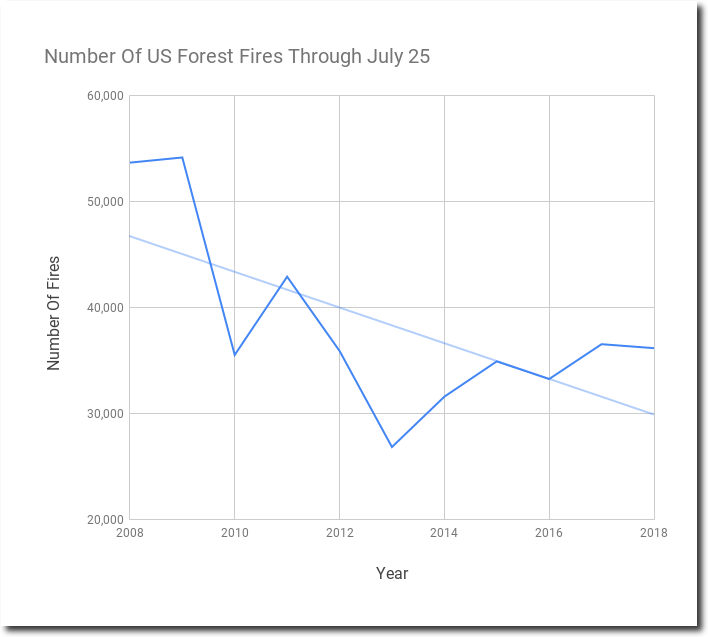
US forest fire burn acreage and number of fires is down 80% over the last 80 years.

Indicator 3.16: Area and percent of forest affected by abiotic agents

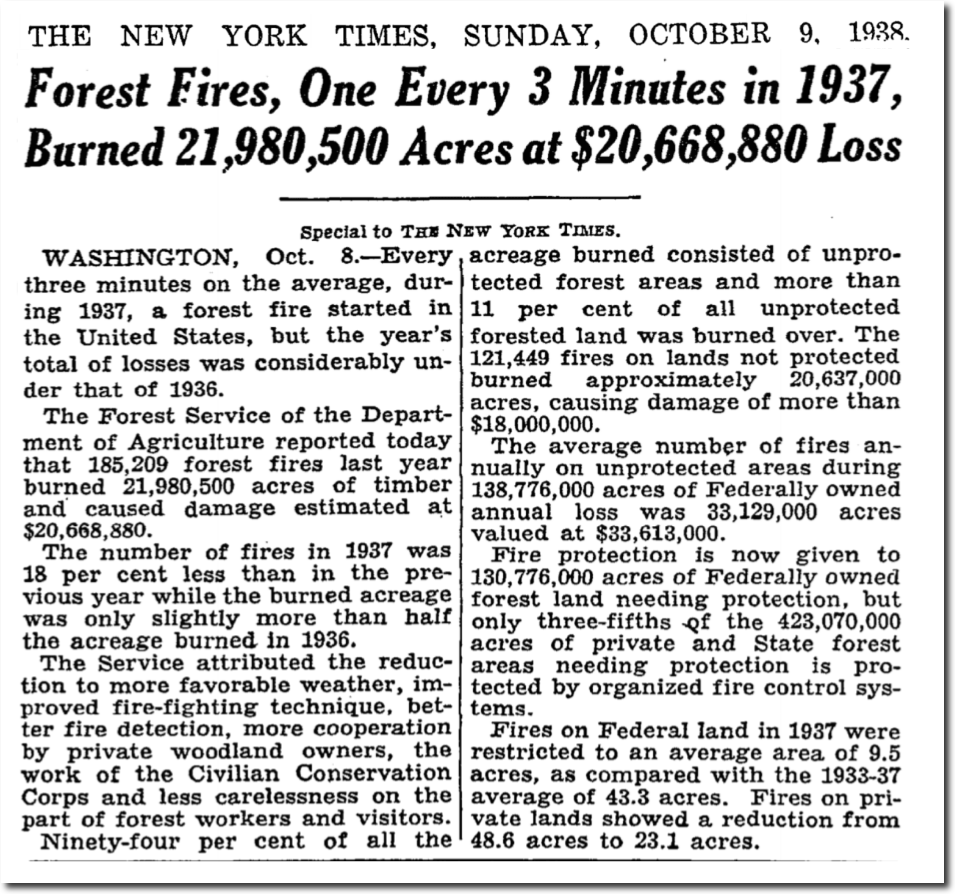
There were 185,209 fires in 1937, and more than 200,000 in 1936.

October 9, 1938 – NYTimes

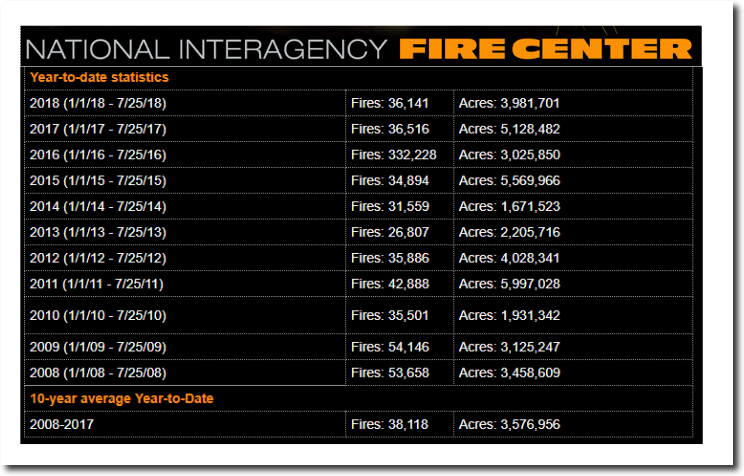
The decline continues. This year there have been less than 40,000 fires so far,

(Assuming the 2016 number is a typo)

National Interagency Fire Center

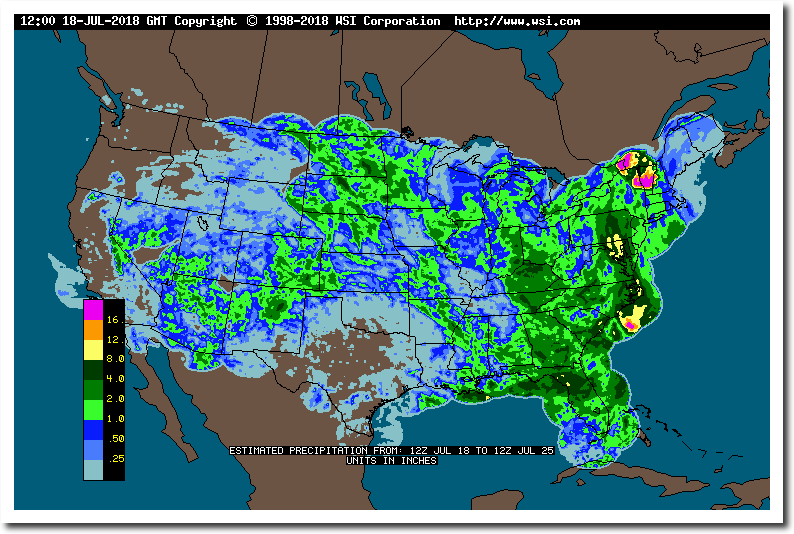
There is lots of rain falling in the southwest, so there won’t be much fire activity there in the foreseeable future.

Intellicast – Weekly Precipitation in United States

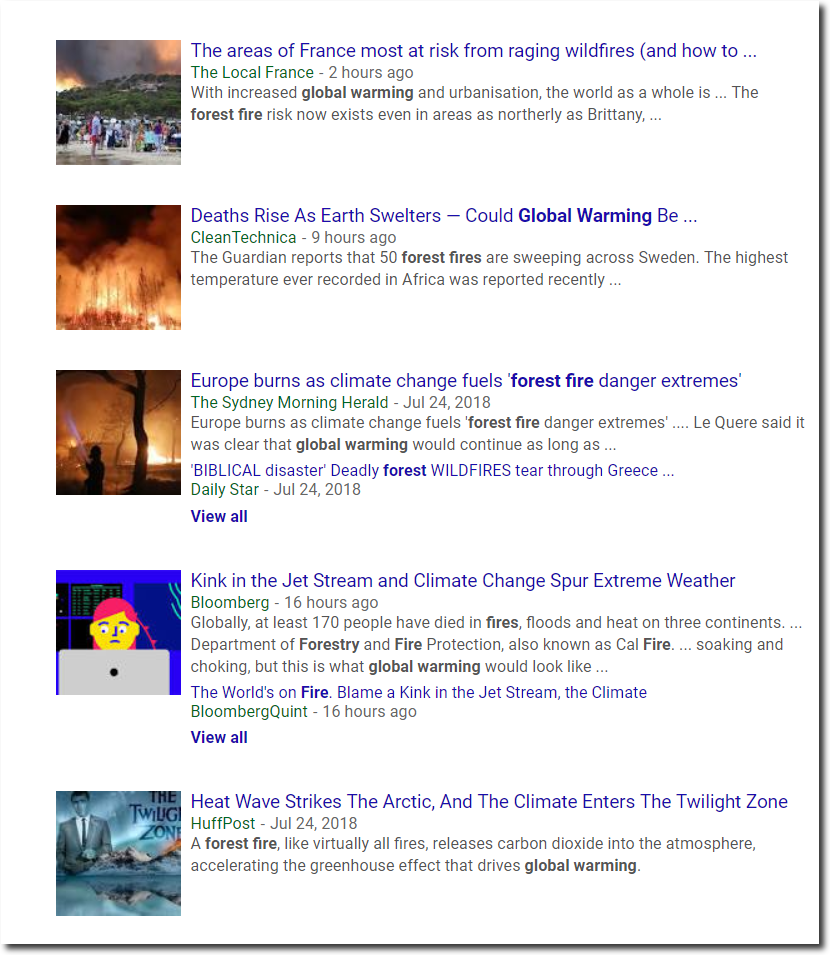
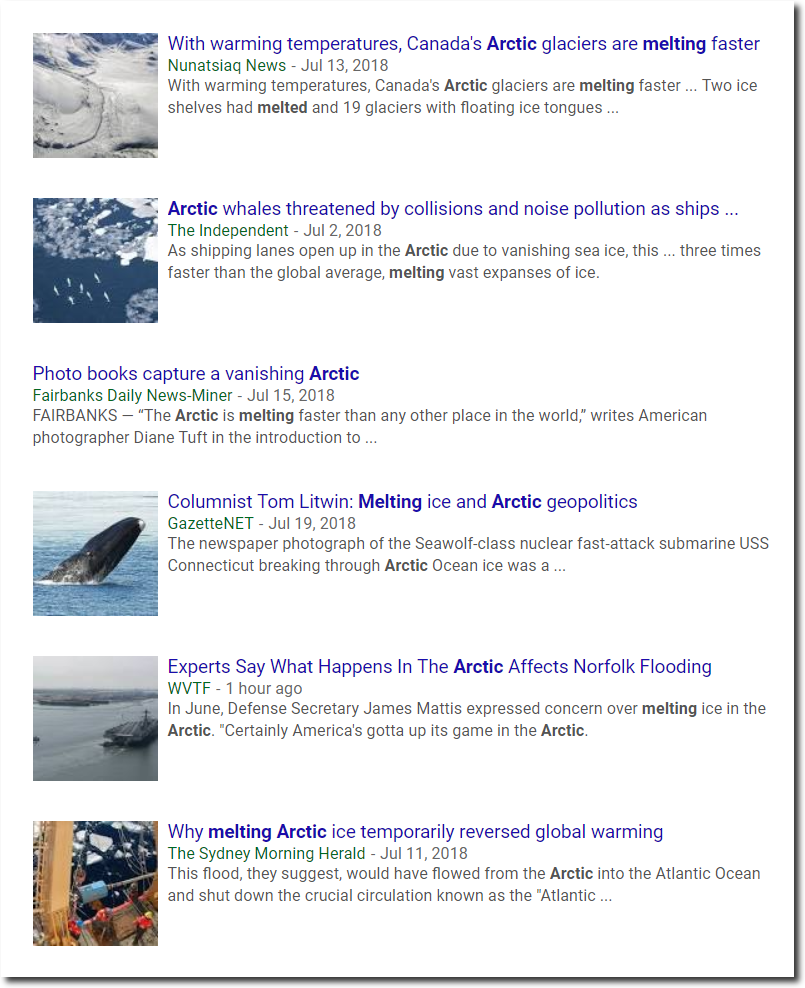
Meanwhile, the press continues their usual hysterical nonsense.

Posted in Uncategorized | Leave a comment

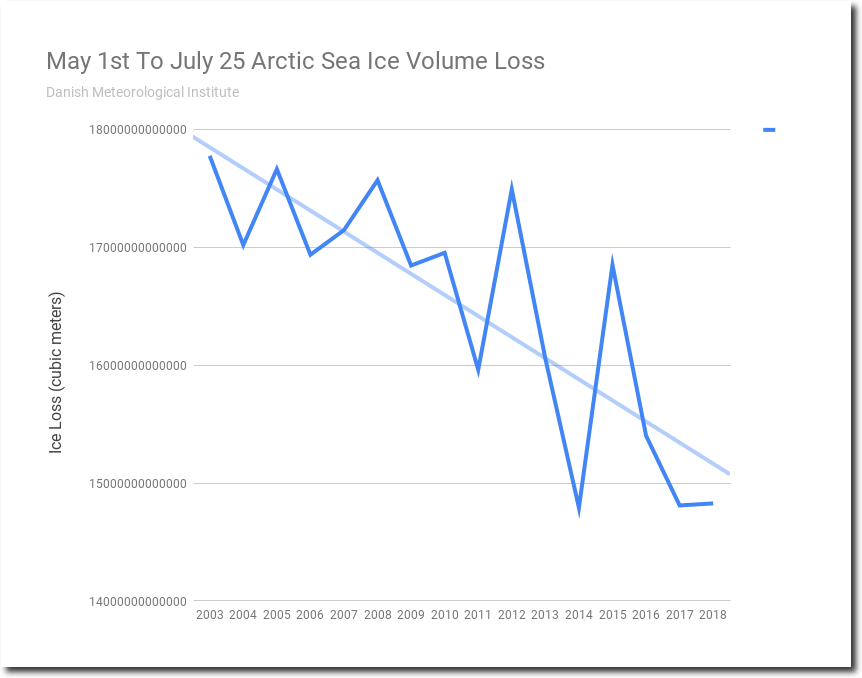
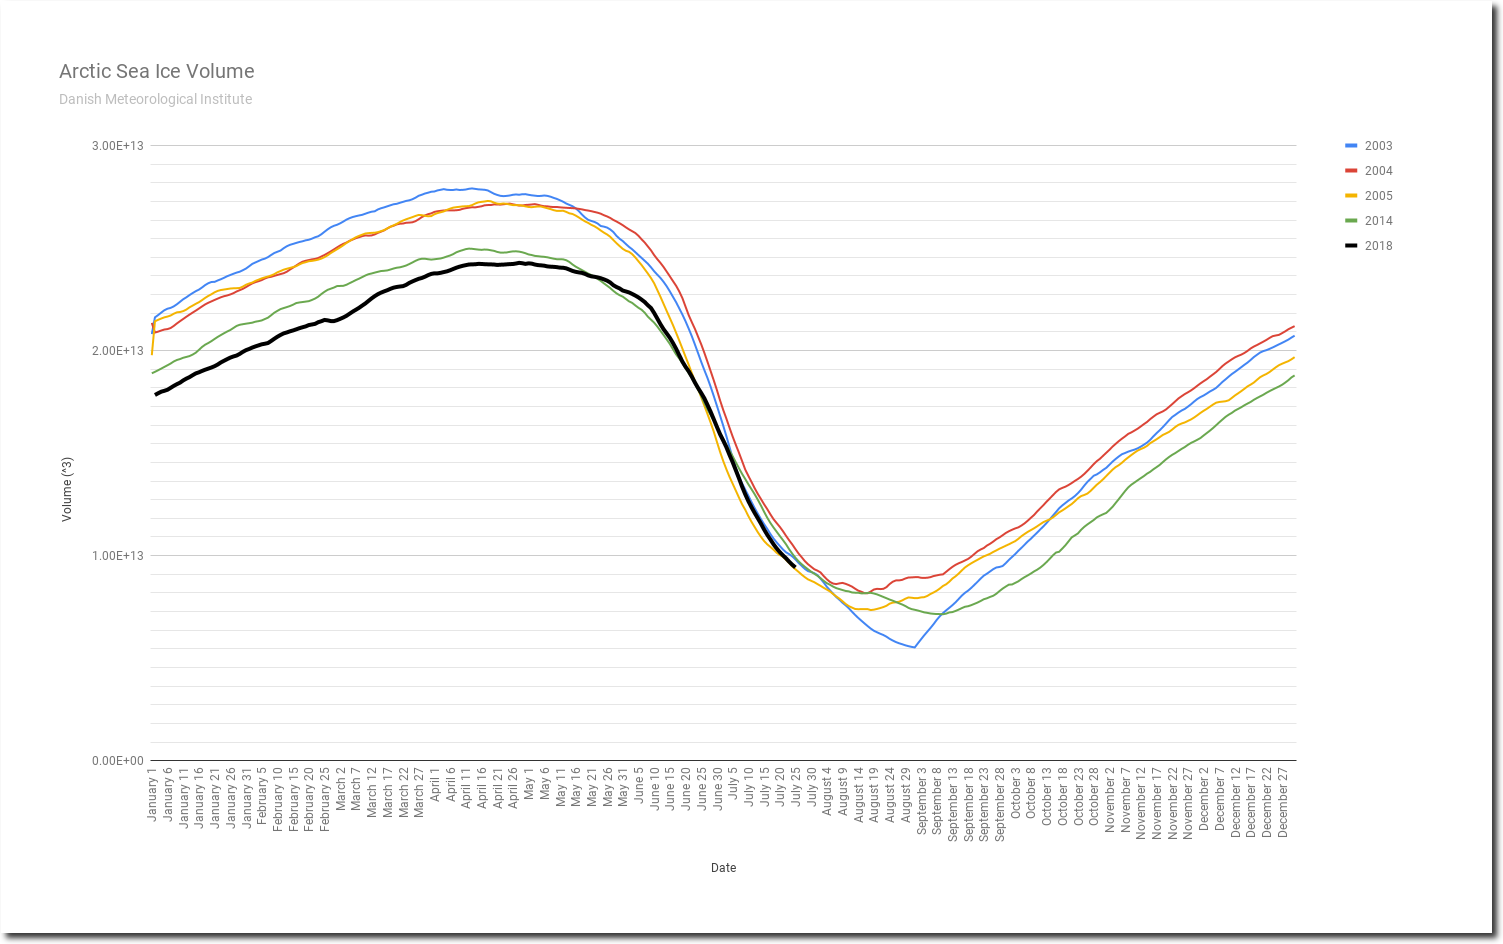
Arctic Sea Ice Melt Rates Continue To Decline

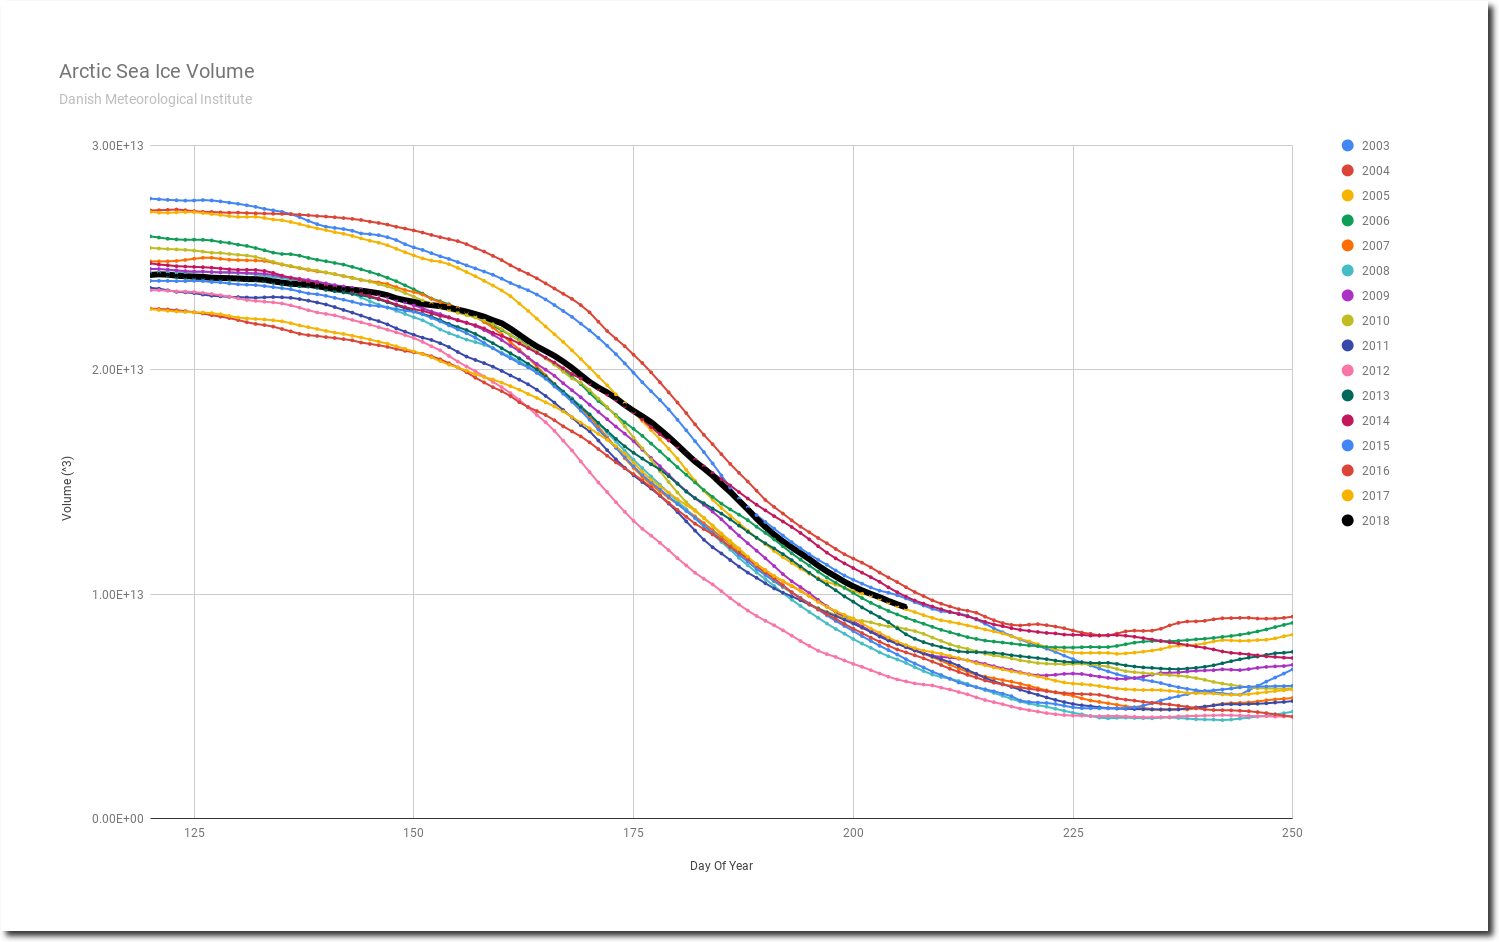
Over the past 15 years, the amount of sea ice melting between May 1 and July 25 has plummeted.

http://ocean.dmi.dk/arctic/icethickness/txt/IceVol.txt

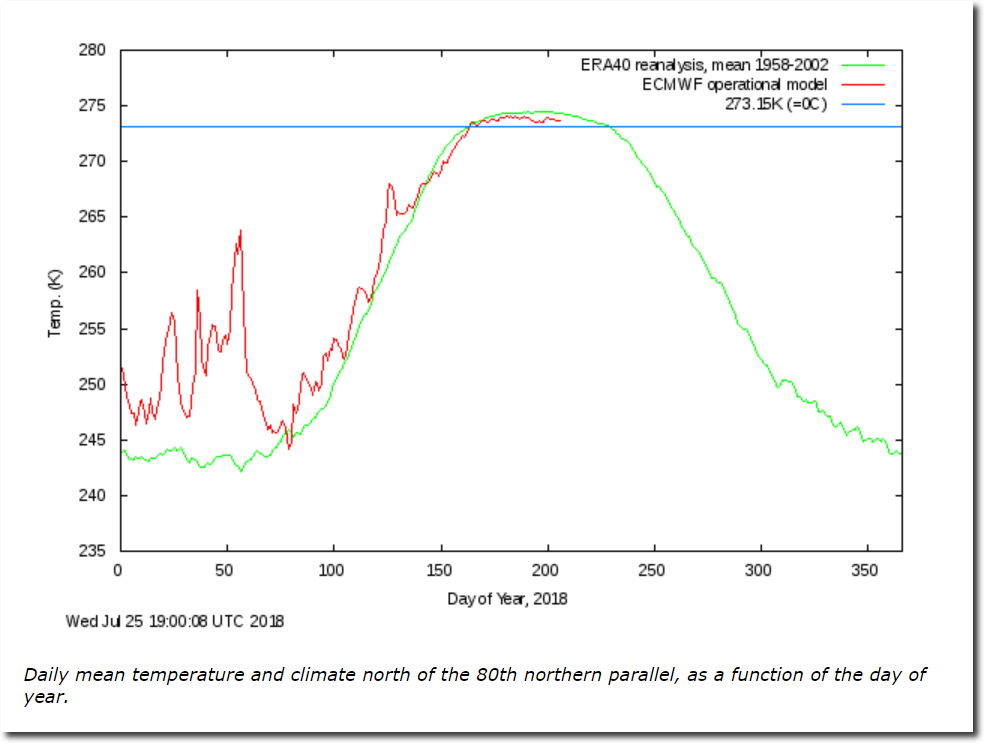
This is not surprising, because Arctic summers have been getting colder.

Ocean and Ice Services | Danmarks Meteorologiske Institut

Arctic sea ice volume is likely to end the summer close to the highest in the Danish Meteorological Institute record.

Spreadsheet    Data

Reality has no place among Democrats and the left however. They simply make up lies to suit their political agenda.

Posted in Uncategorized | Leave a comment

The Record Heatwave Of 2018

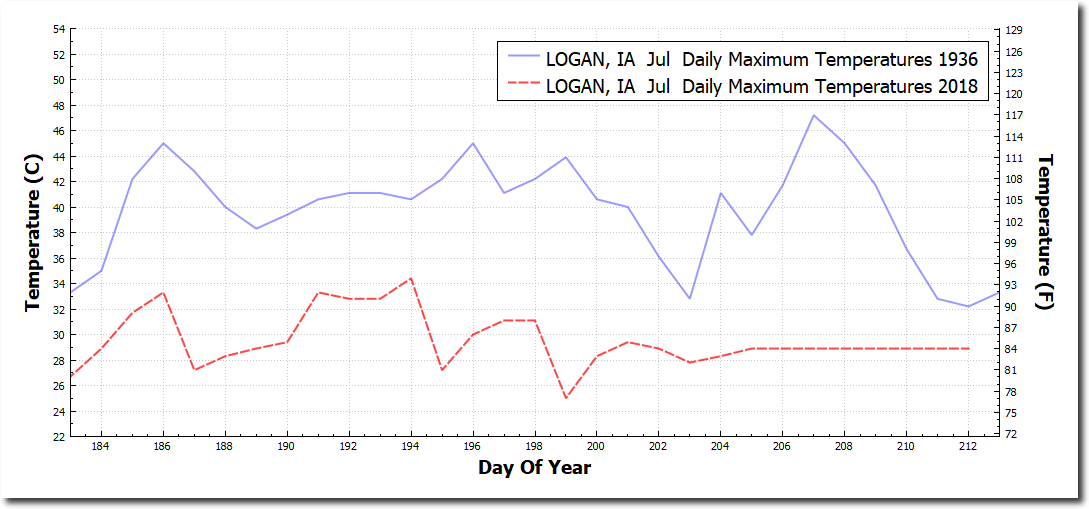
July 2018 maximum temperatures at Logan, Iowa have been 18 degrees cooler than 1936. That gap will likely increase as the month proceeds.

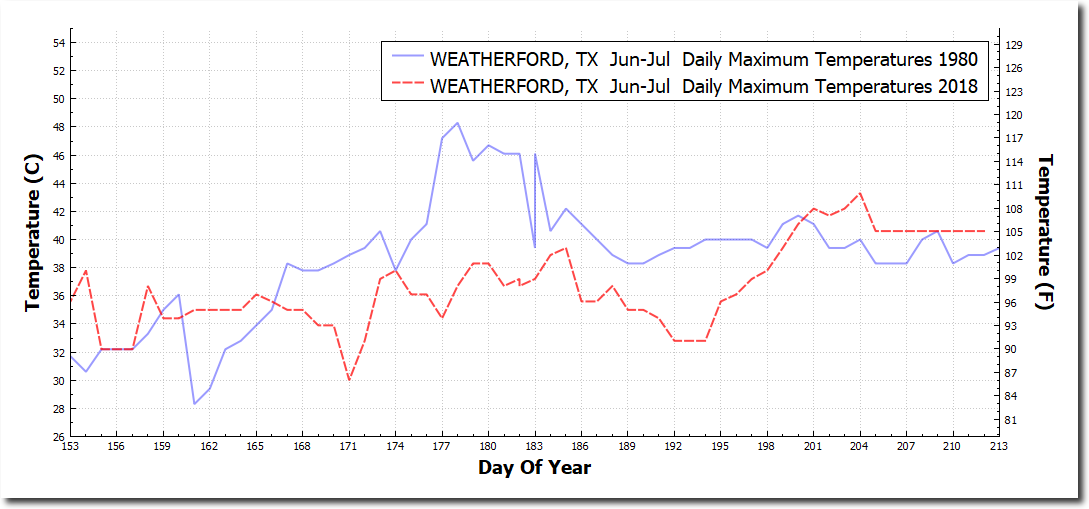
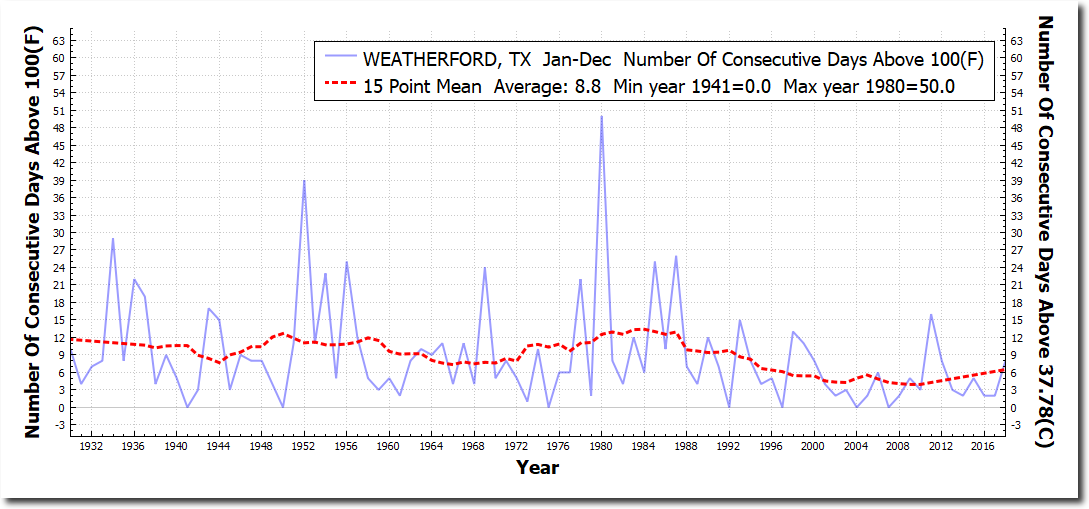
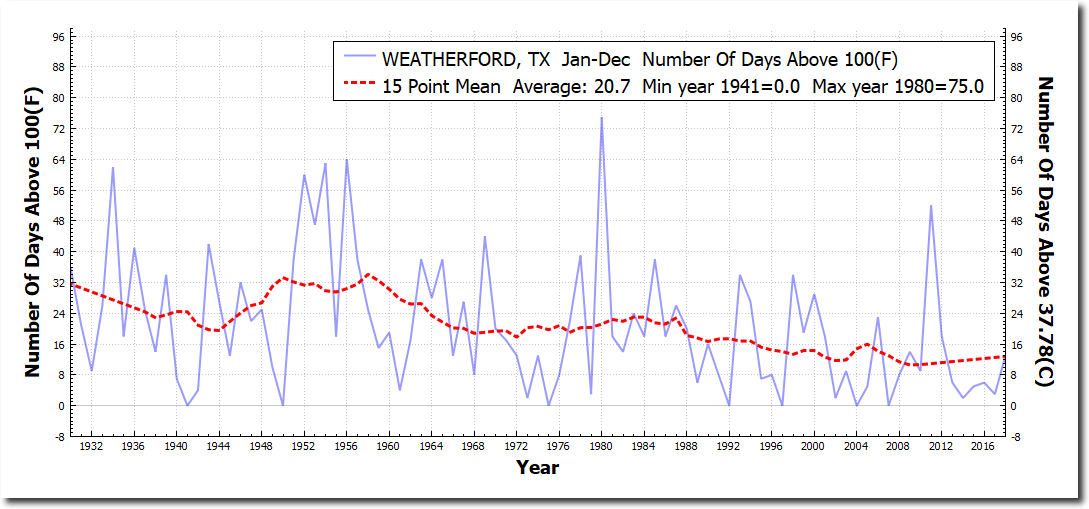
Summer in the Dallas/Fort Worth area has seen afternoon temperatures four degrees cooler than 1980, when they had 50 consecutive days over 100 degrees.

Summers are getting cooler, but left-wing snowflakes are melting much easier than in the past.

Posted in Uncategorized | Leave a comment

Latest Pix

Posted in Uncategorized | Leave a comment

NOAA Hiding The Decline

Making the heat of the 1930’s disappear is very important for the global warming scam.  Not only were CO2 levels low in the 1930’s but atmospheric H2O levels were also very low.

Spreadsheet    Data

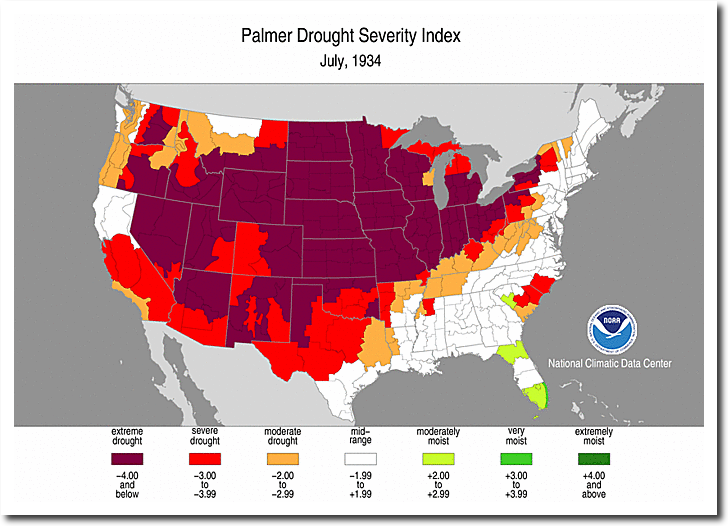
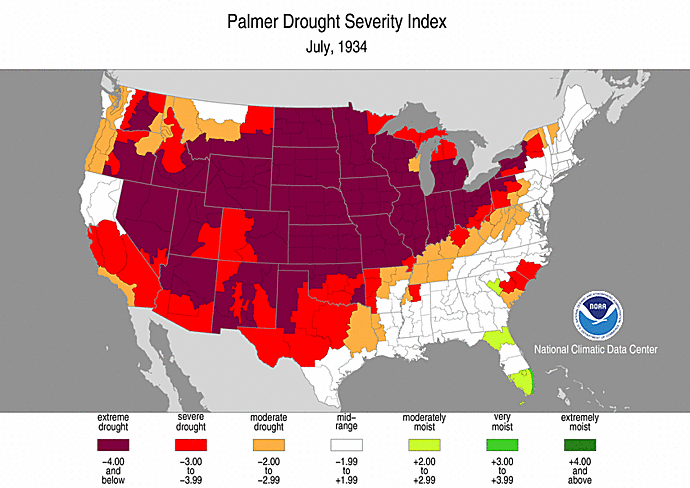
The US had severe or extreme drought coast to coast in 1934, meaning low levels of greenhouse gas H2O in the atmosphere.

psi-193407.gif (690×488)

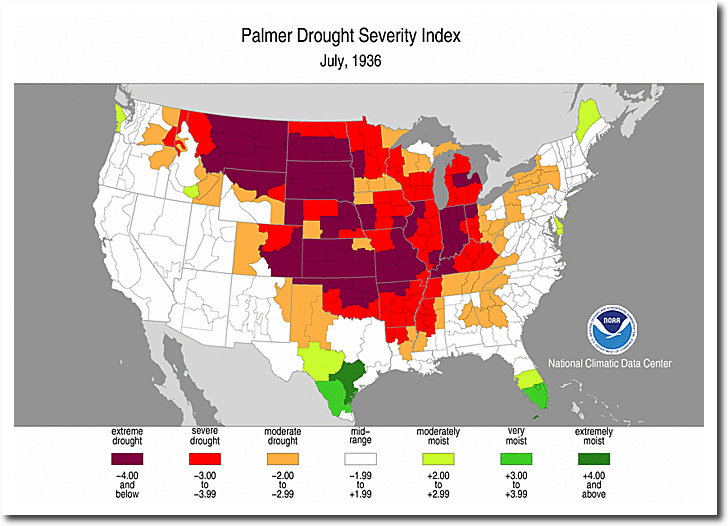
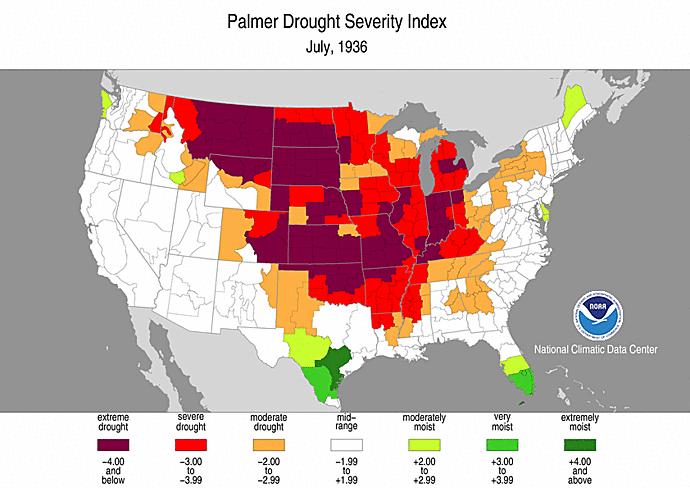
And not much better in 1936.

psi-193607.gif (690×488)

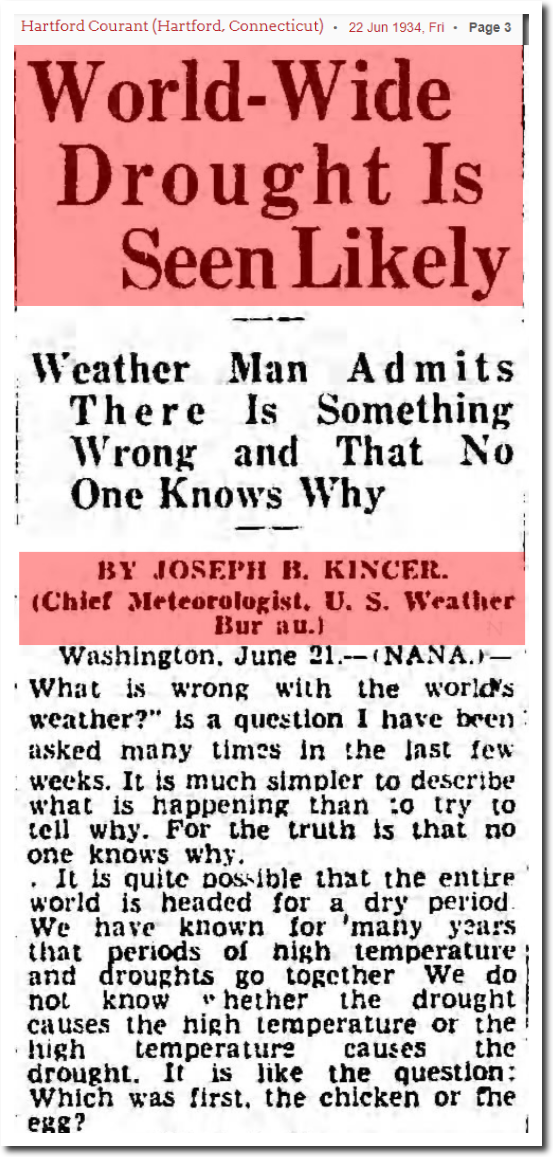
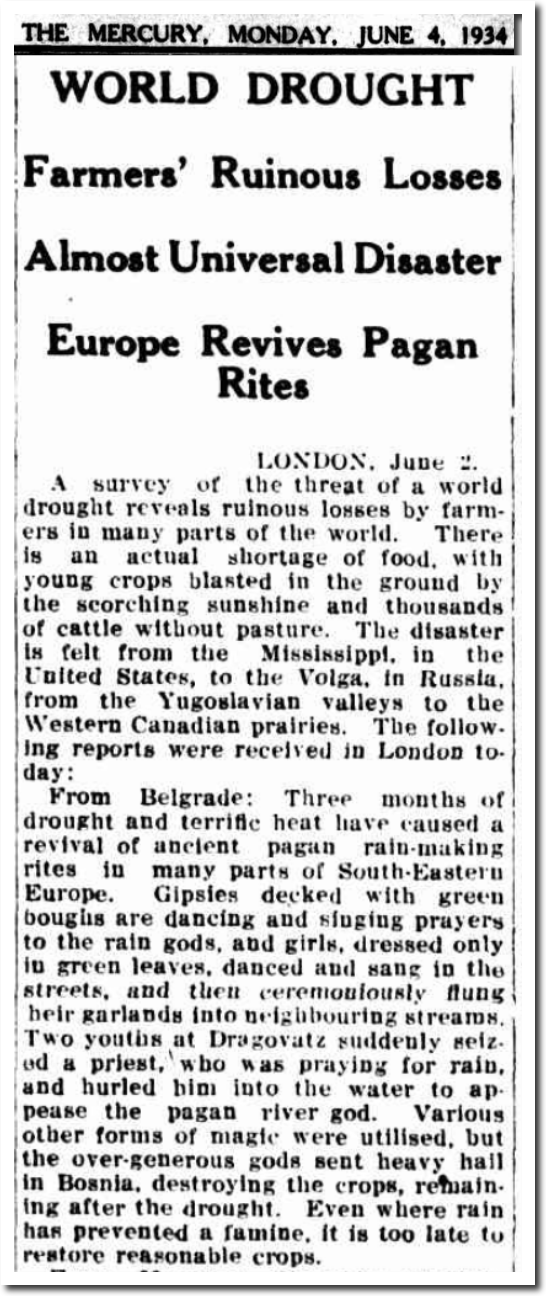
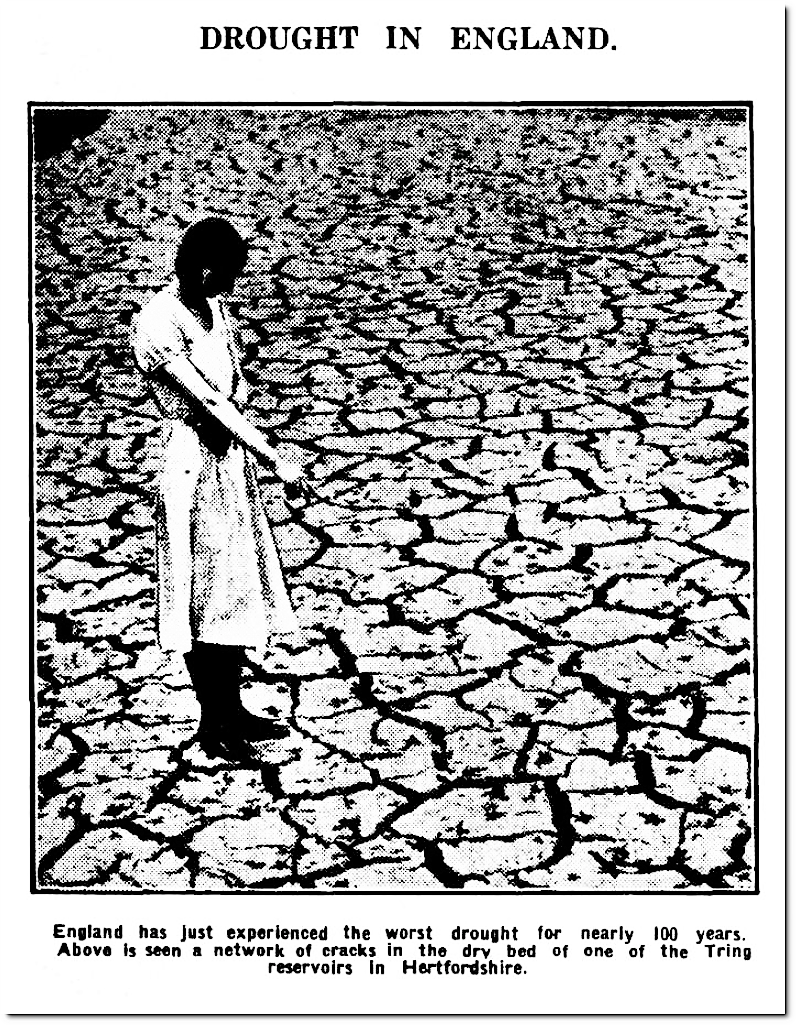
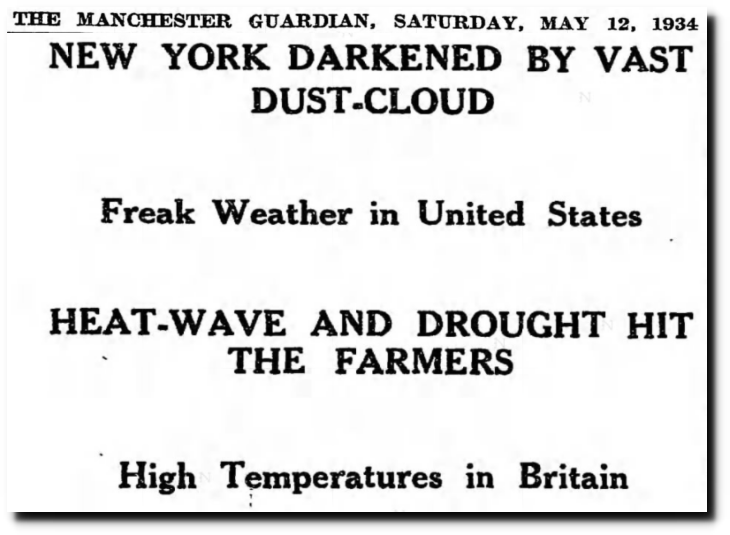
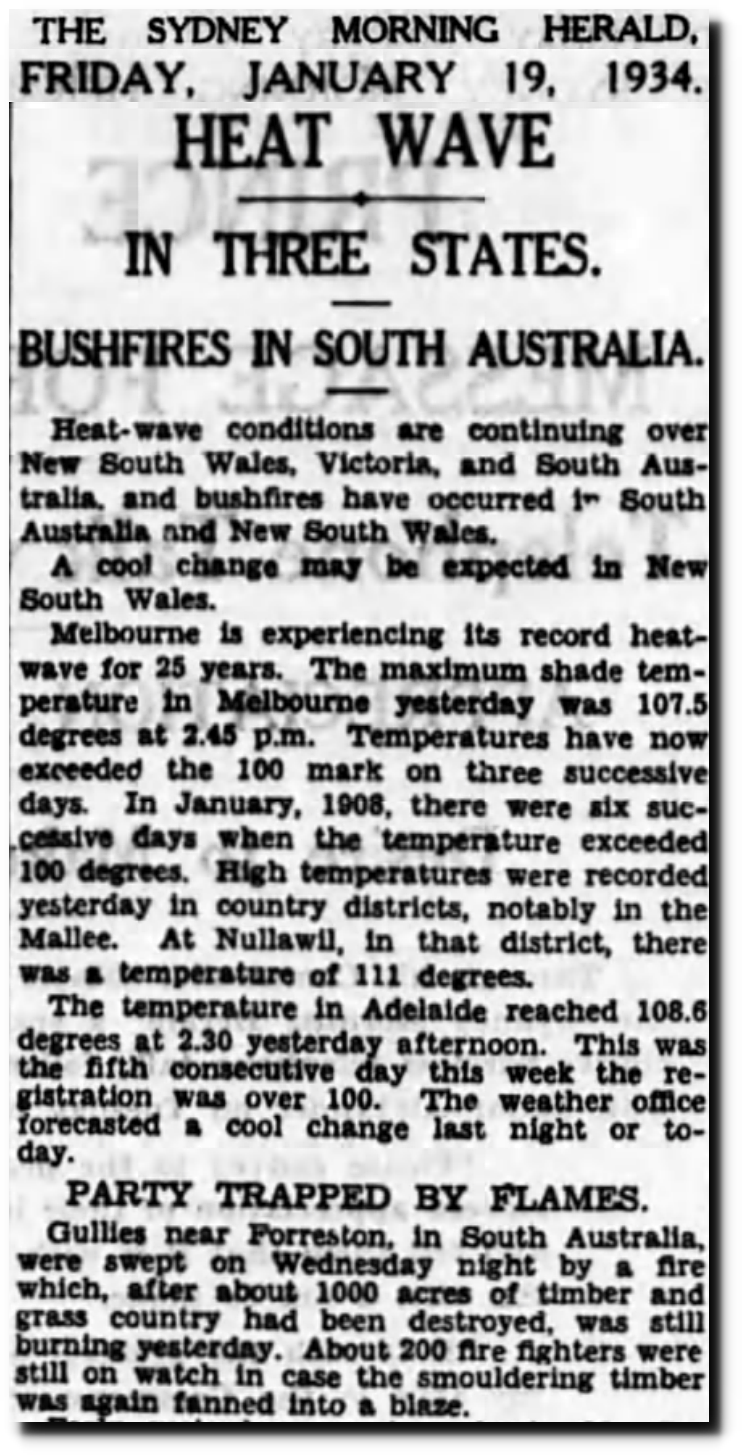
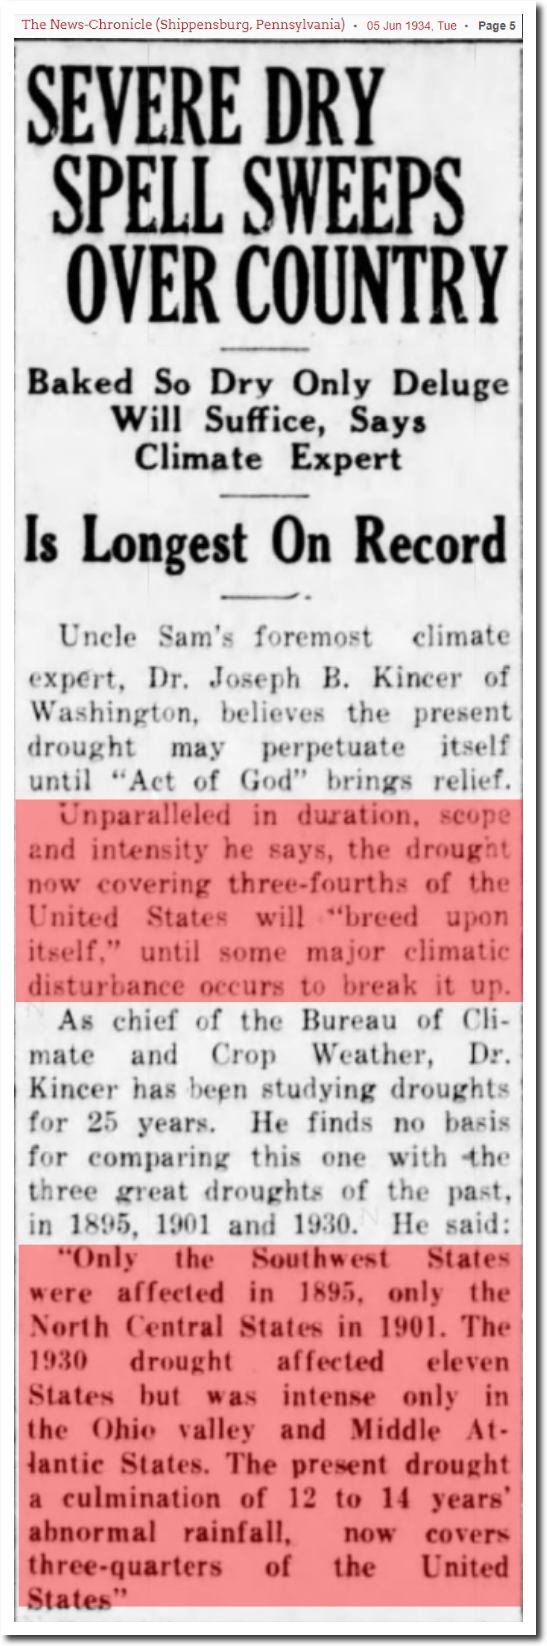
The drought was world-wide.

22 Jun 1934, Page 3 – Hartford Courant at Newspapers.com

04 Jun 1934 – WORLD DROUGHT – Trove

19 Jul 1934 – DROUGHT IN ENGLAND. – Trove

12 May 1934, 13 – The Guardian at Newspapers.com

19 Jan 1934, Page 10 – The Sydney Morning Herald at Newspapers.com

05 Jun 1934, Page 5 – The News-Chronicle at Newspapers.com

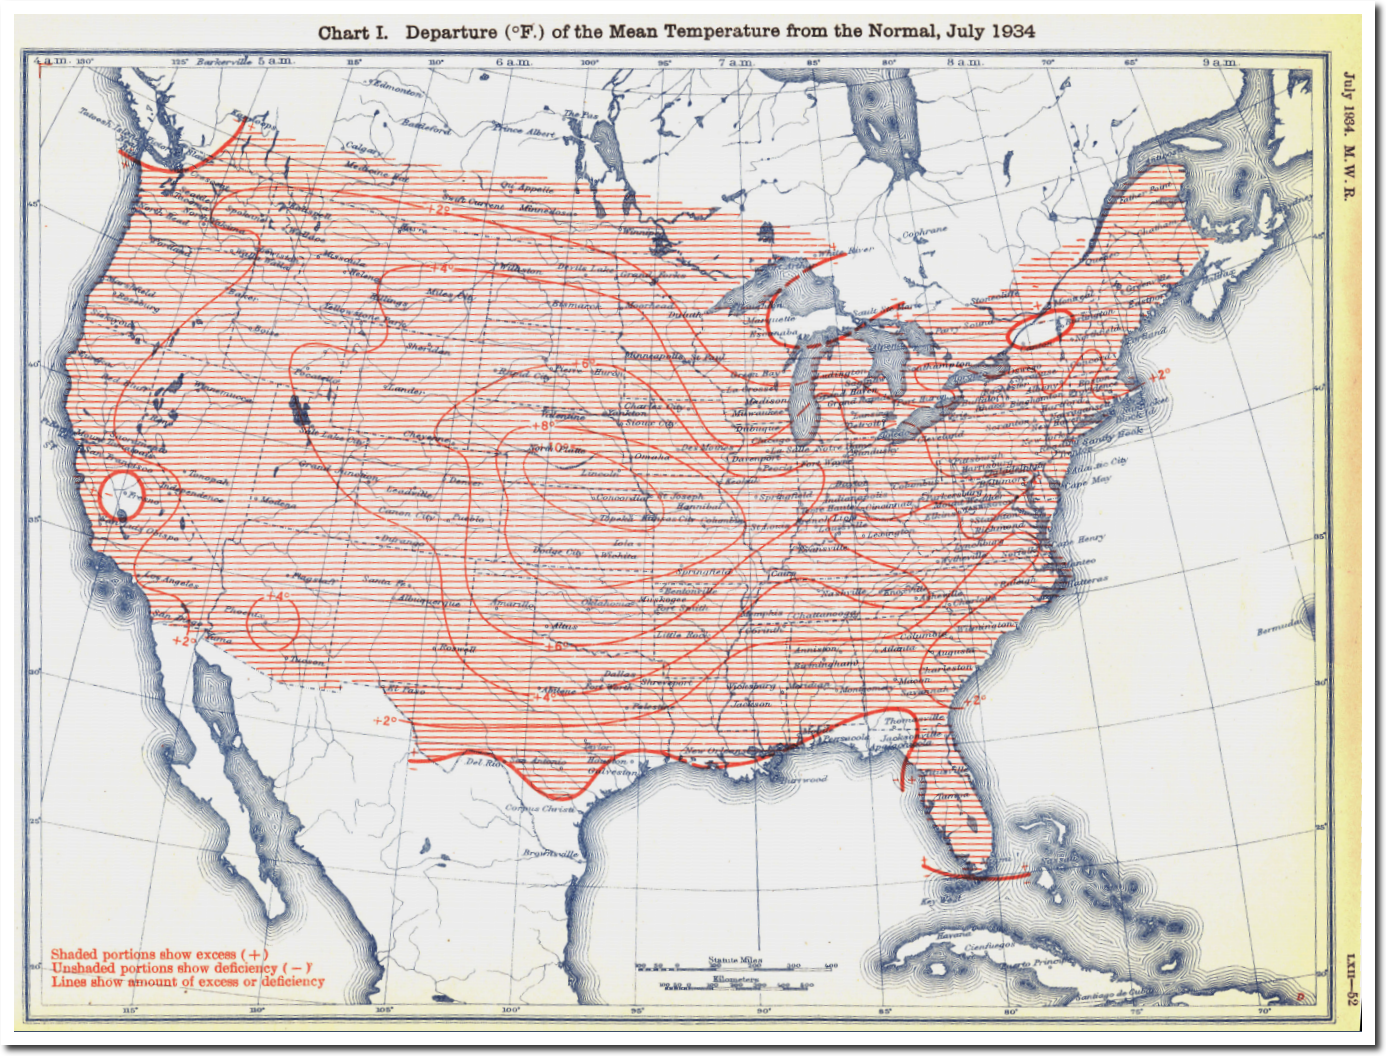
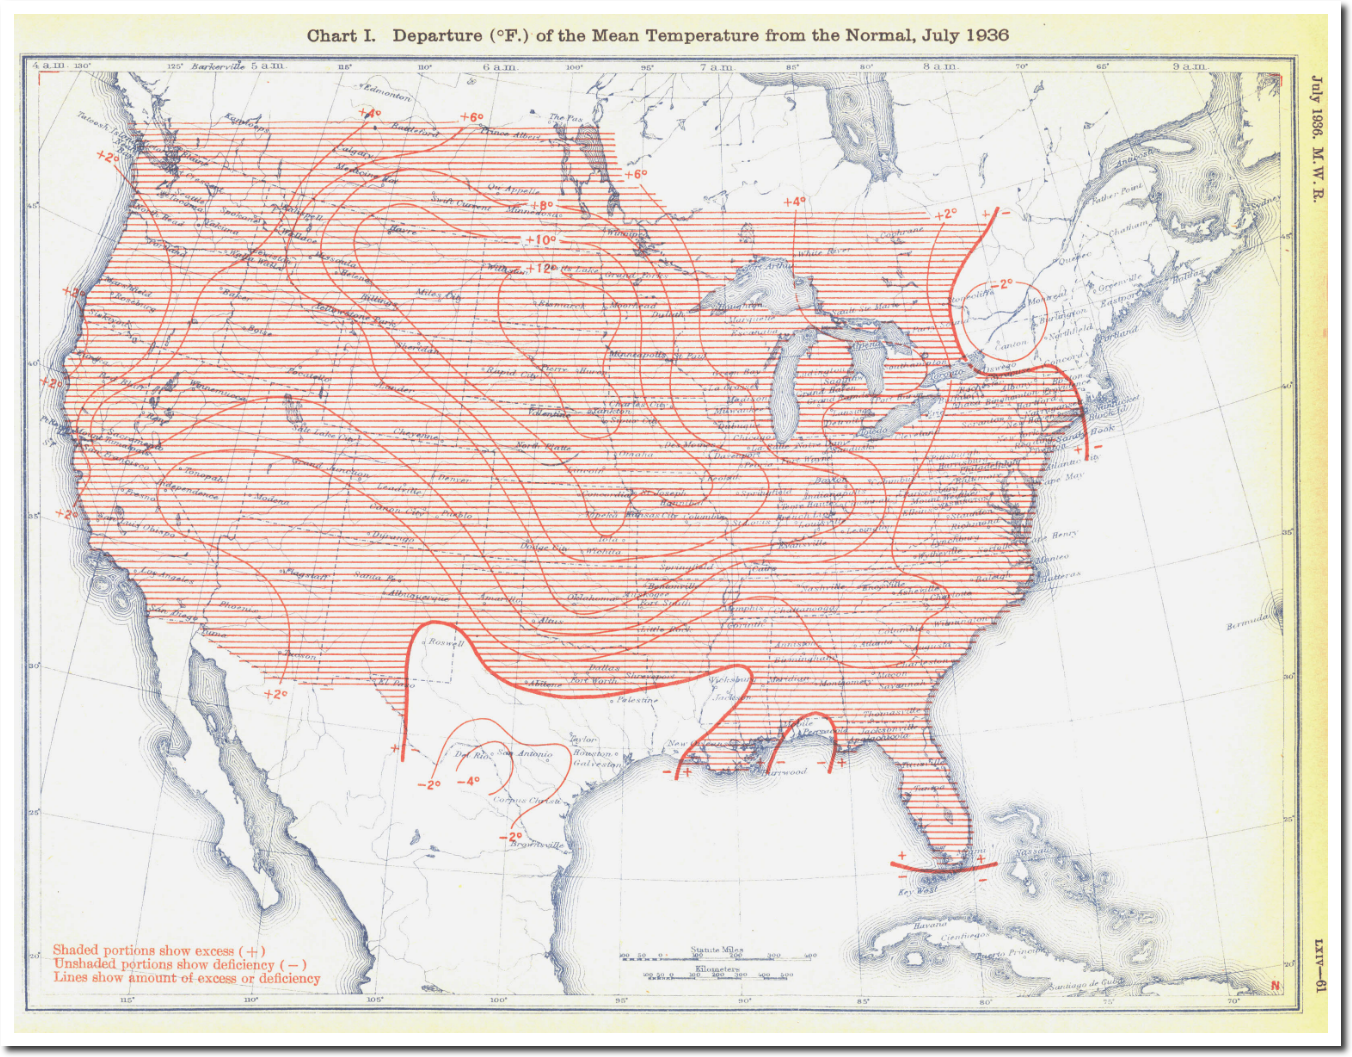
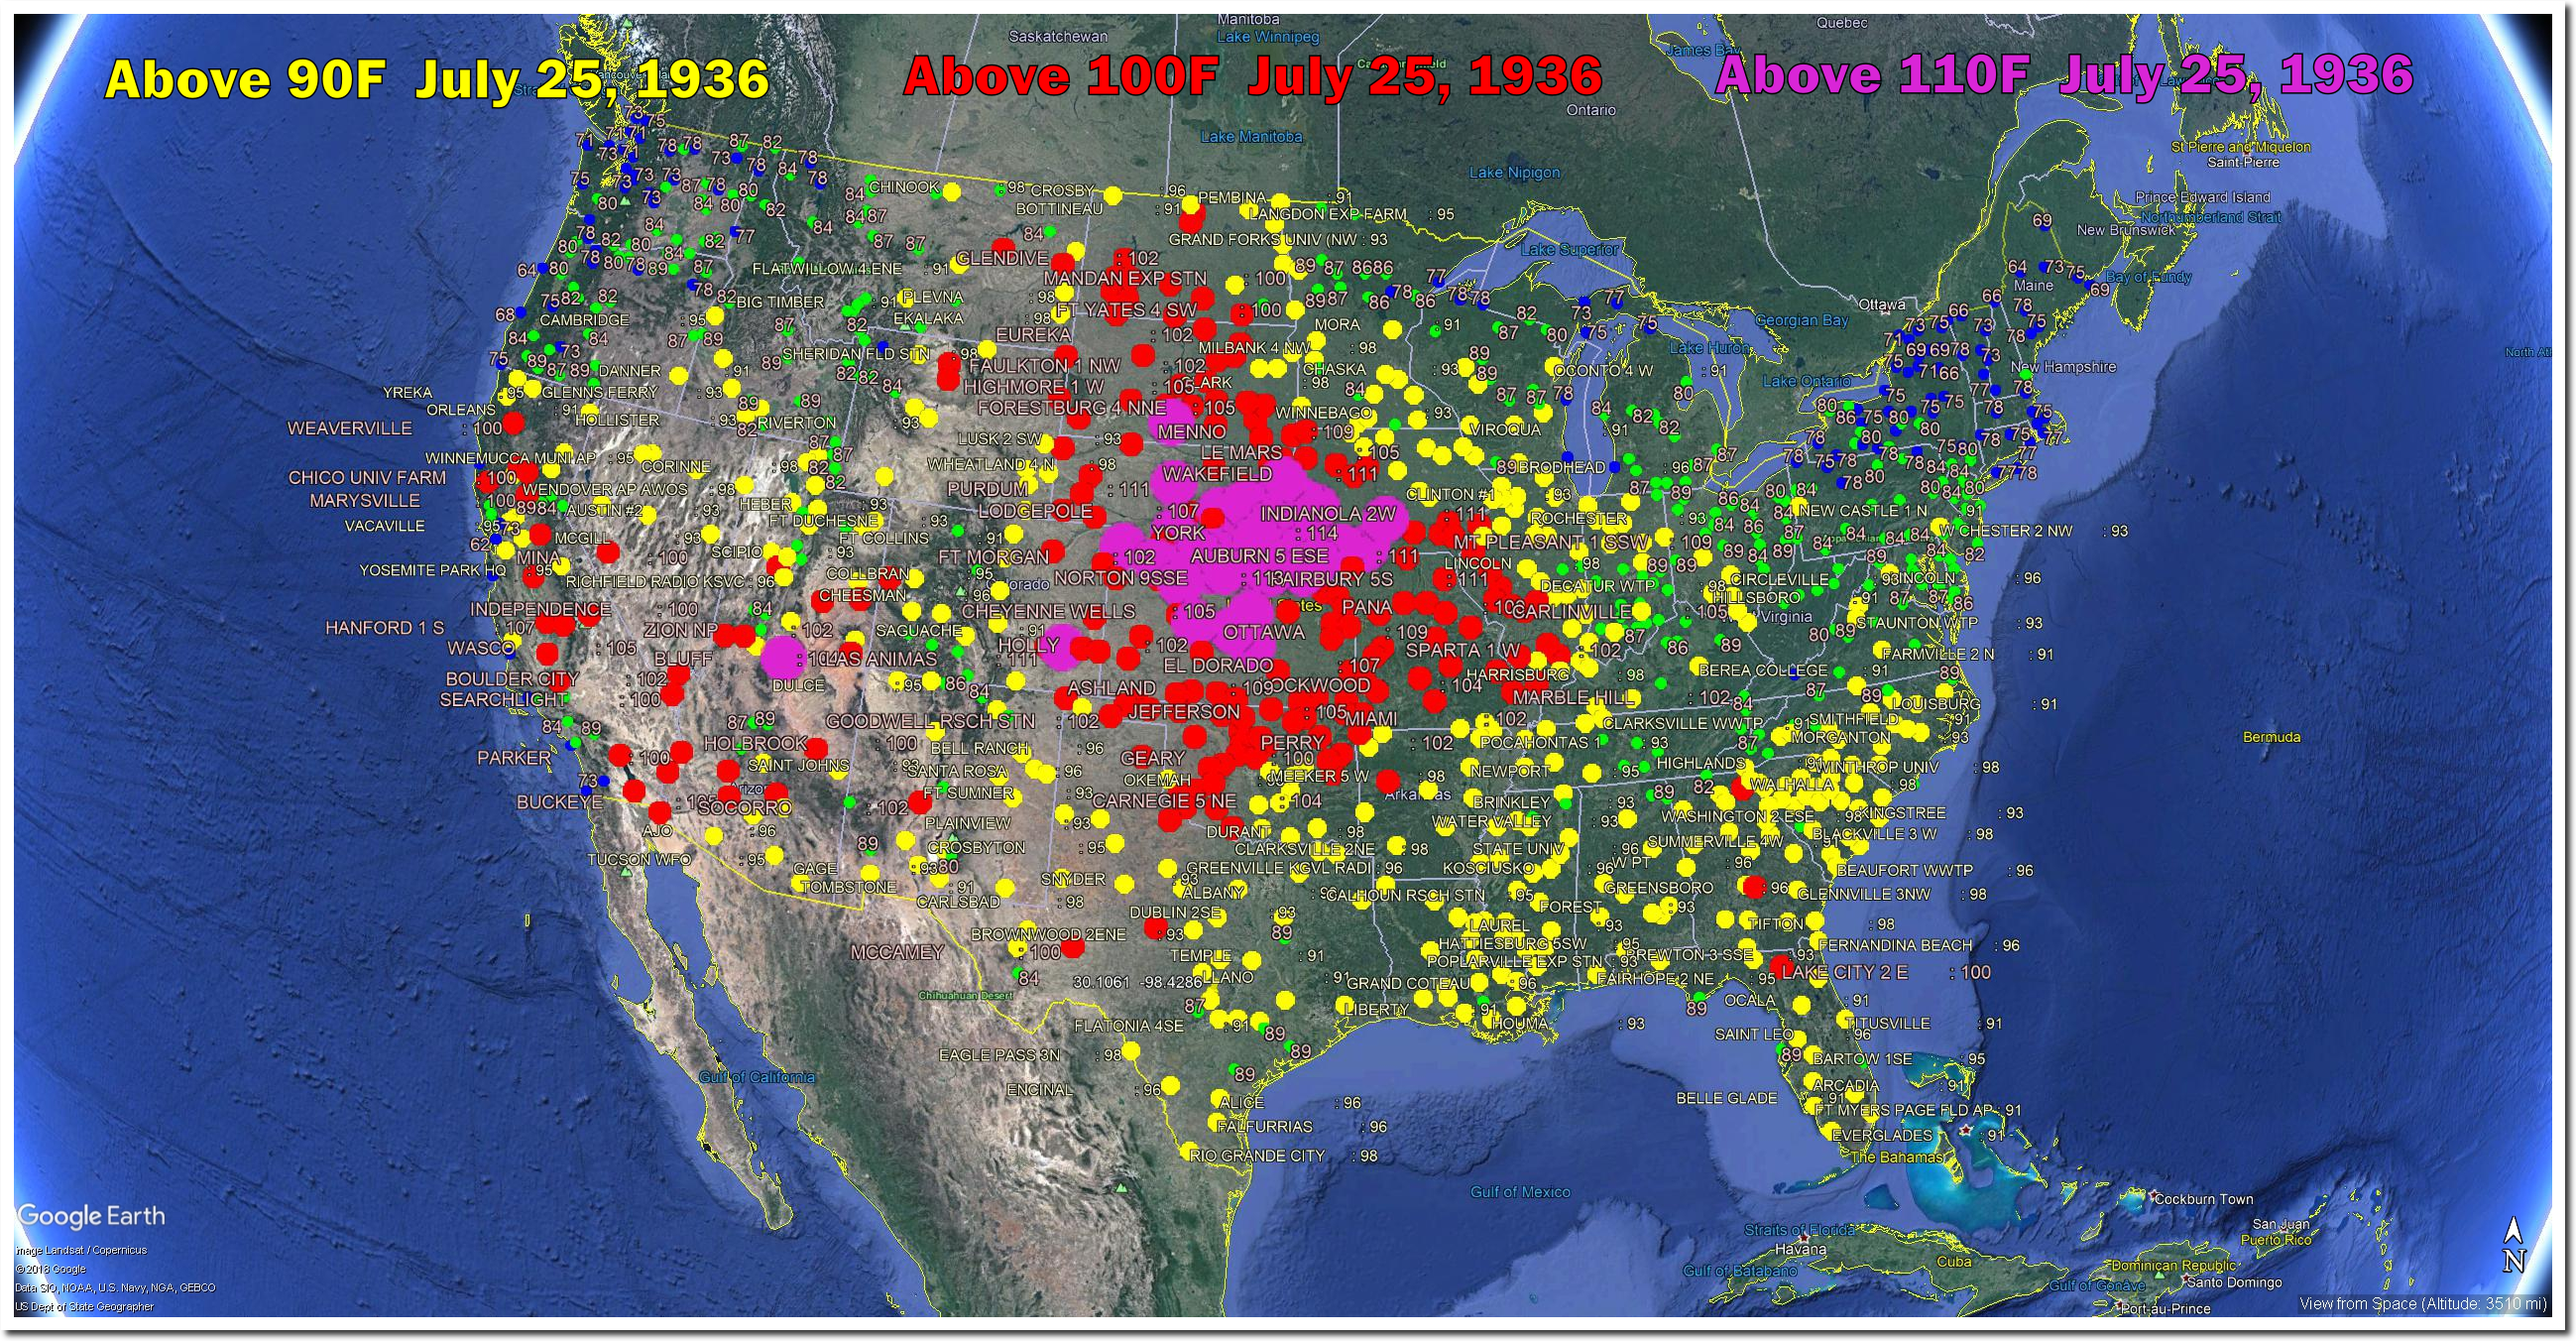
The summers of 1934 and 1936 were incredibly hot across the US.

mwr-062-07-c1.pdf

mwr-064-07-c1.pdf

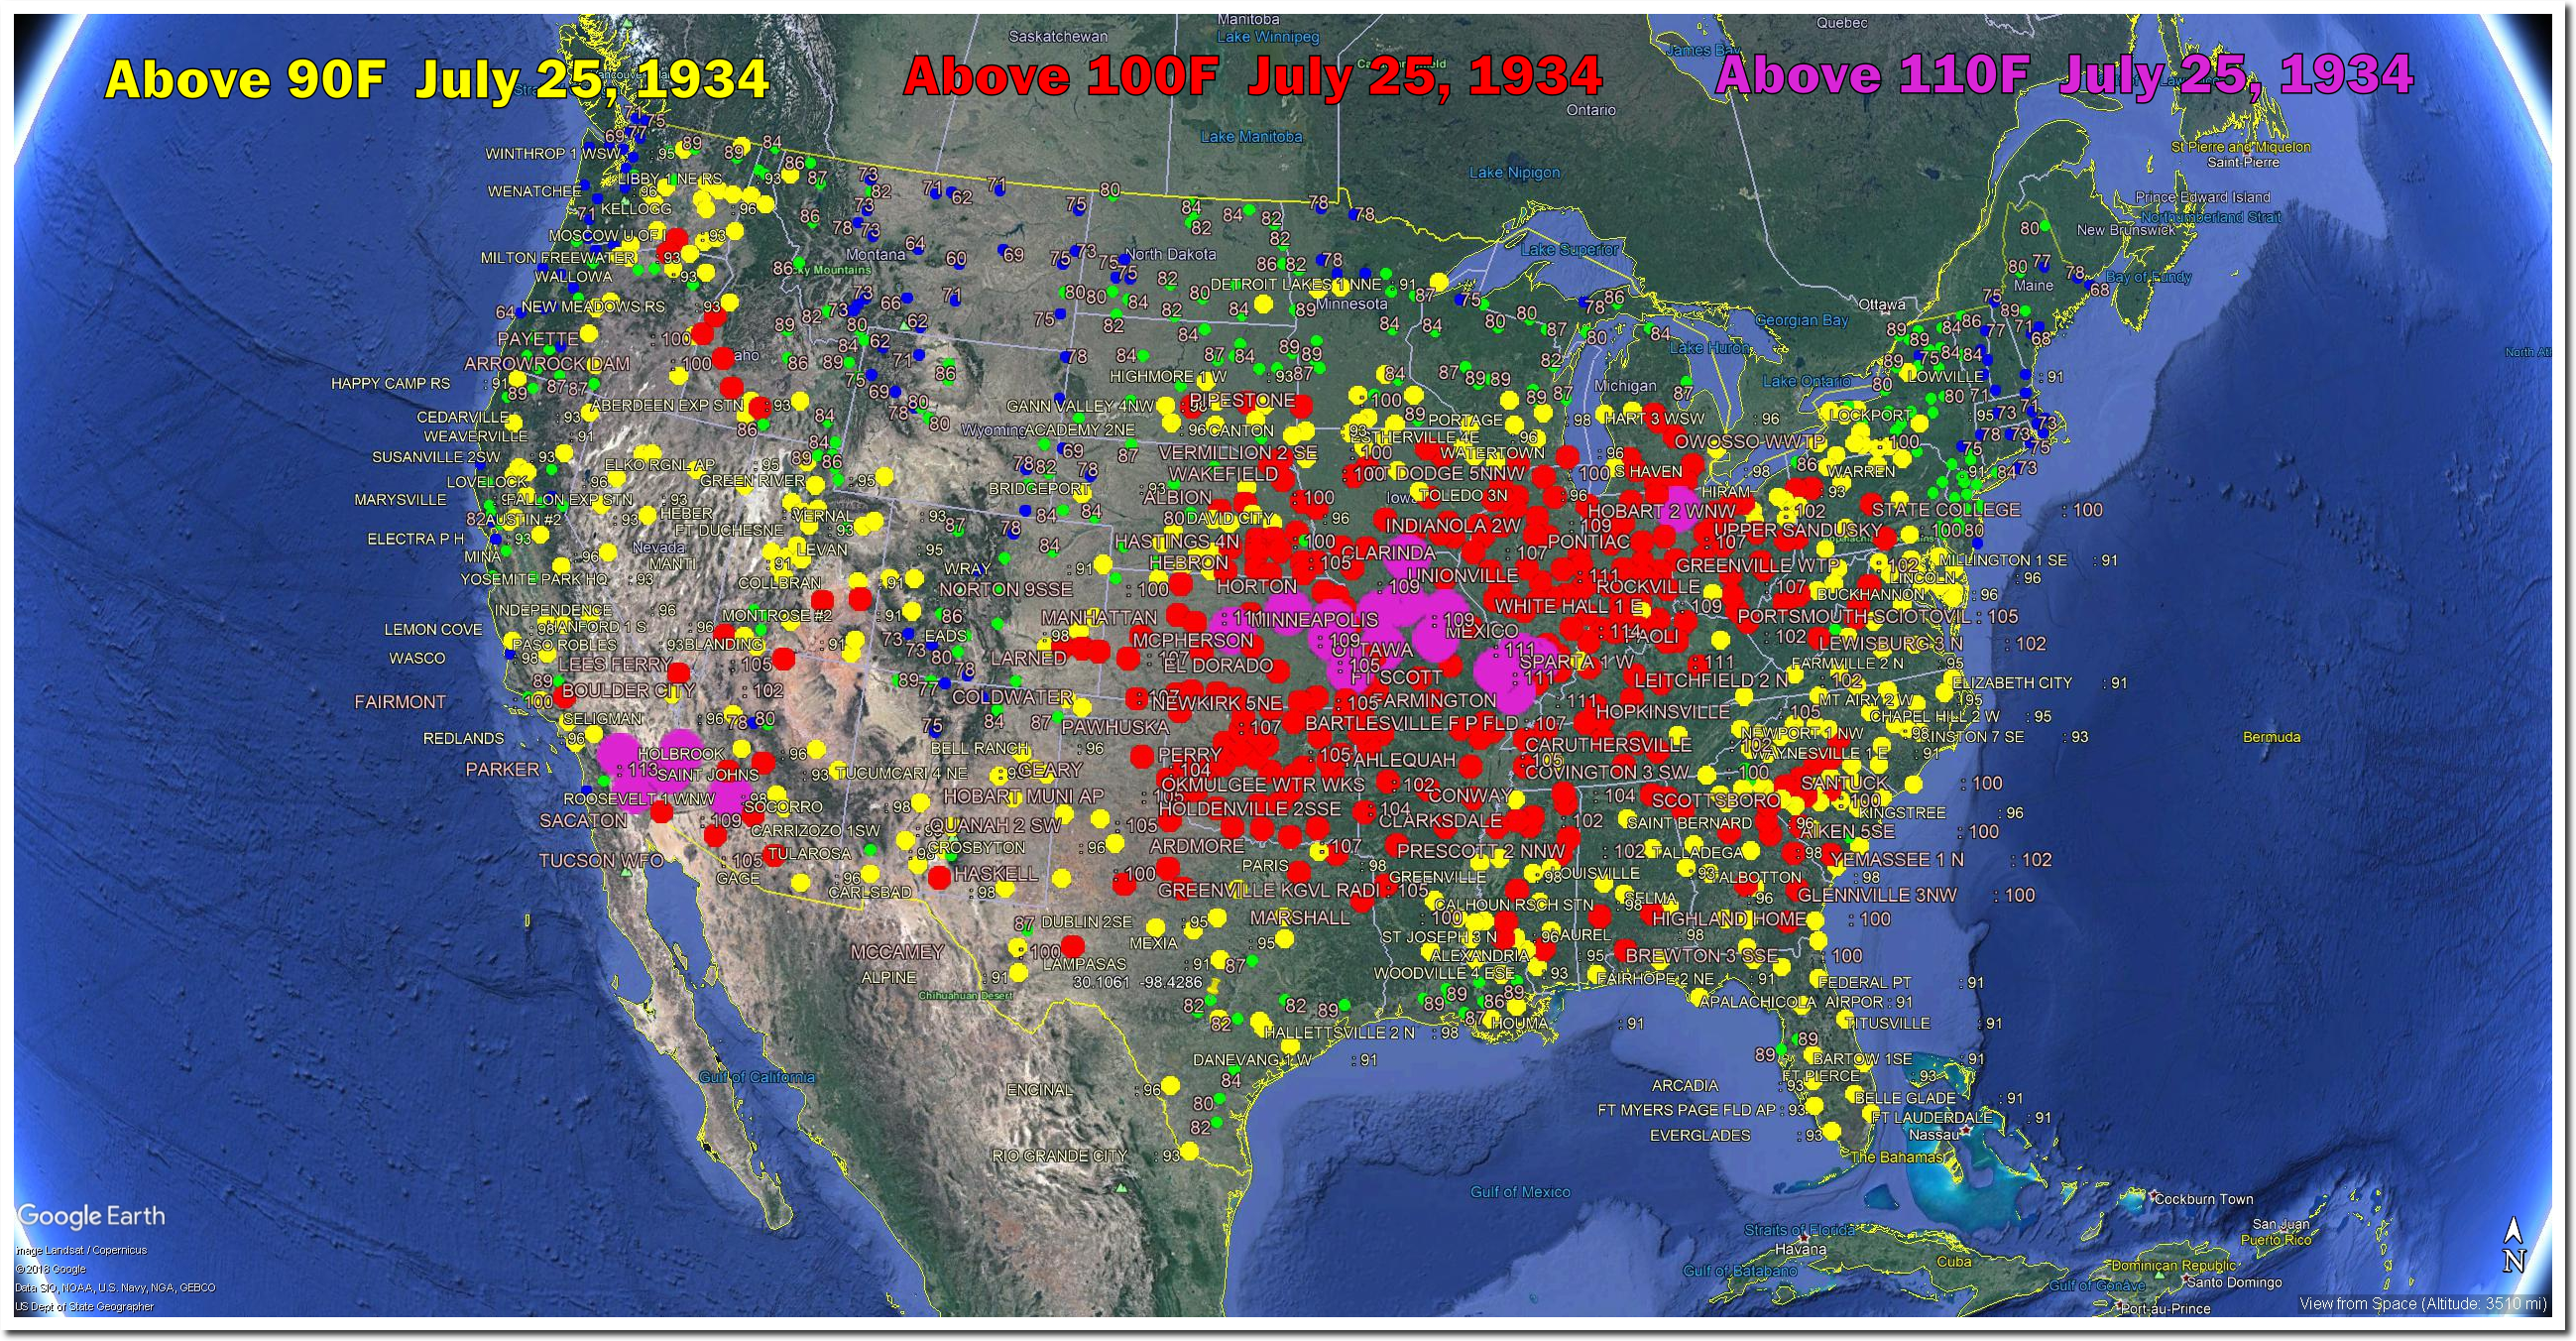
On July 25, 1934 it was 110 degrees in Kentucky, 114 degrees in Missouri, 113 degrees in Illinois, and 111 degrees in Ohio.

On July 25, 1936 it was 117 degrees in Iowa, 116 degrees in South Dakota, and 115 degrees in Nebraska.

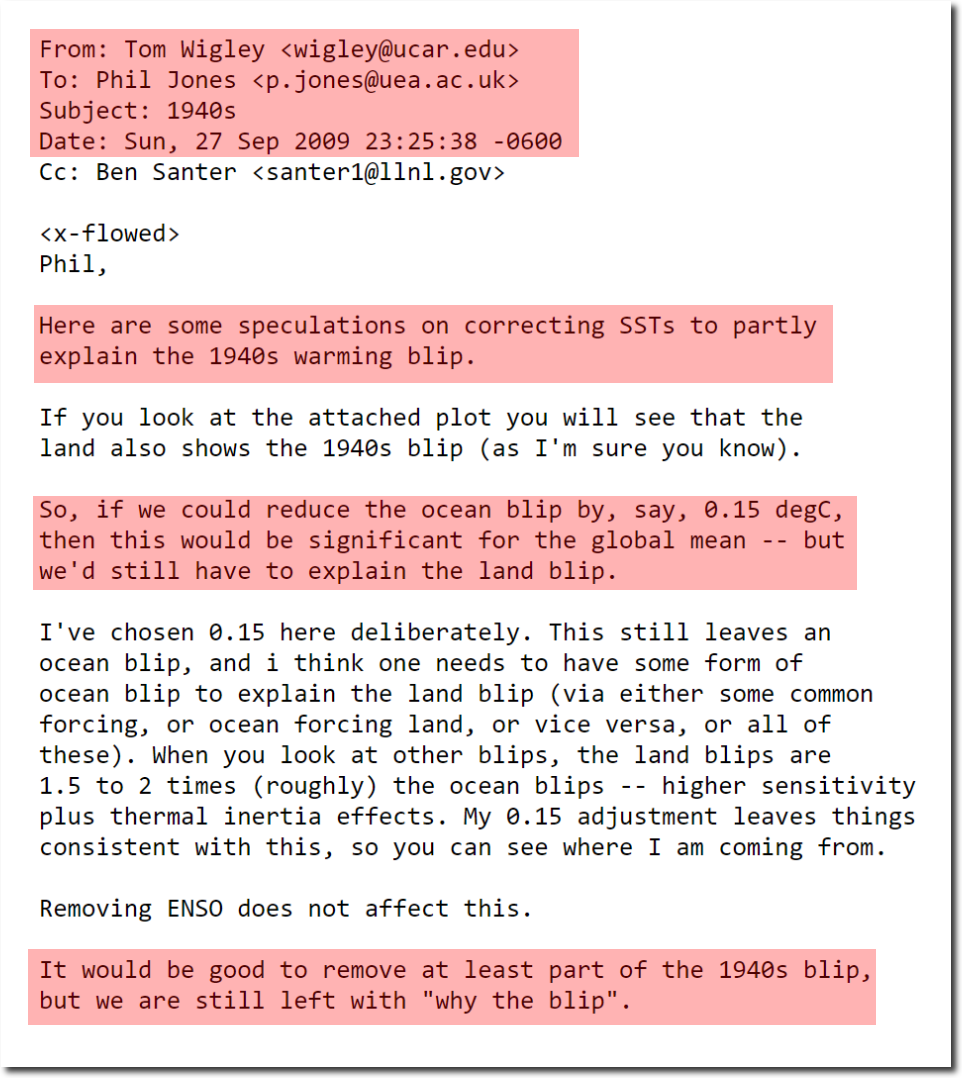
Temperatures that hot don’t occur in the Midwest any more, so it is necessary for fraudsters at NOAA to tamper with the data and make the past heat disappear.  And they don’t do it alone. Scientists around the world colluded to make past global warmth disappear.

di2.nu/foia/1254108338.txt

Posted in Uncategorized | Leave a comment

NOAA US Data Tampering Update

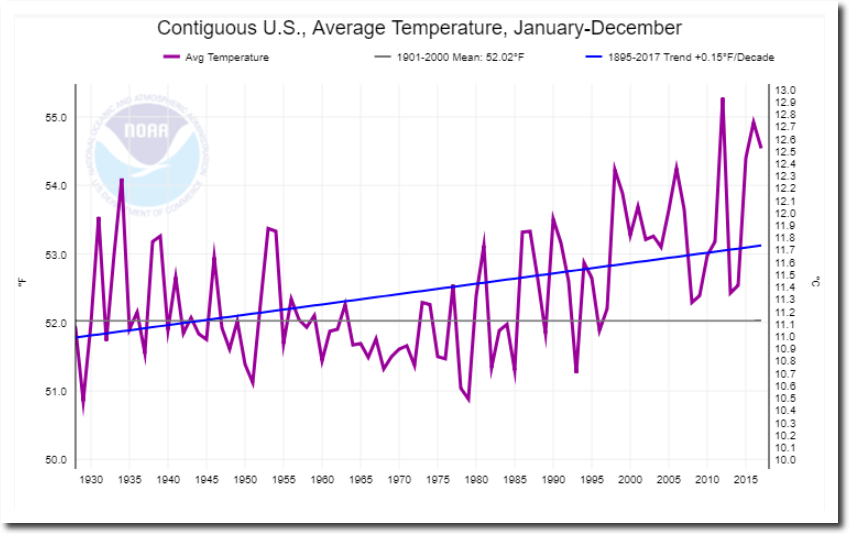
According to NOAA, the US is burning up.

Climate at a Glance | National Centers for Environmental Information (NCEI)

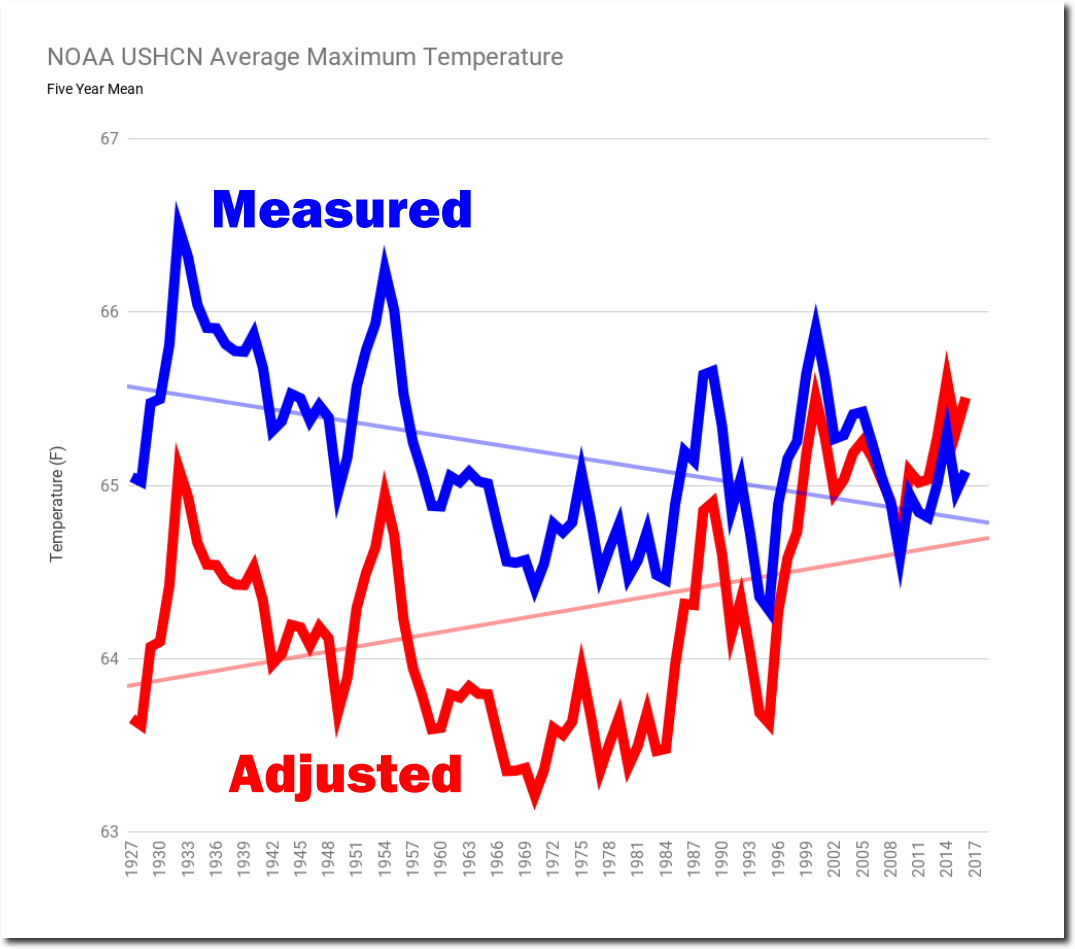
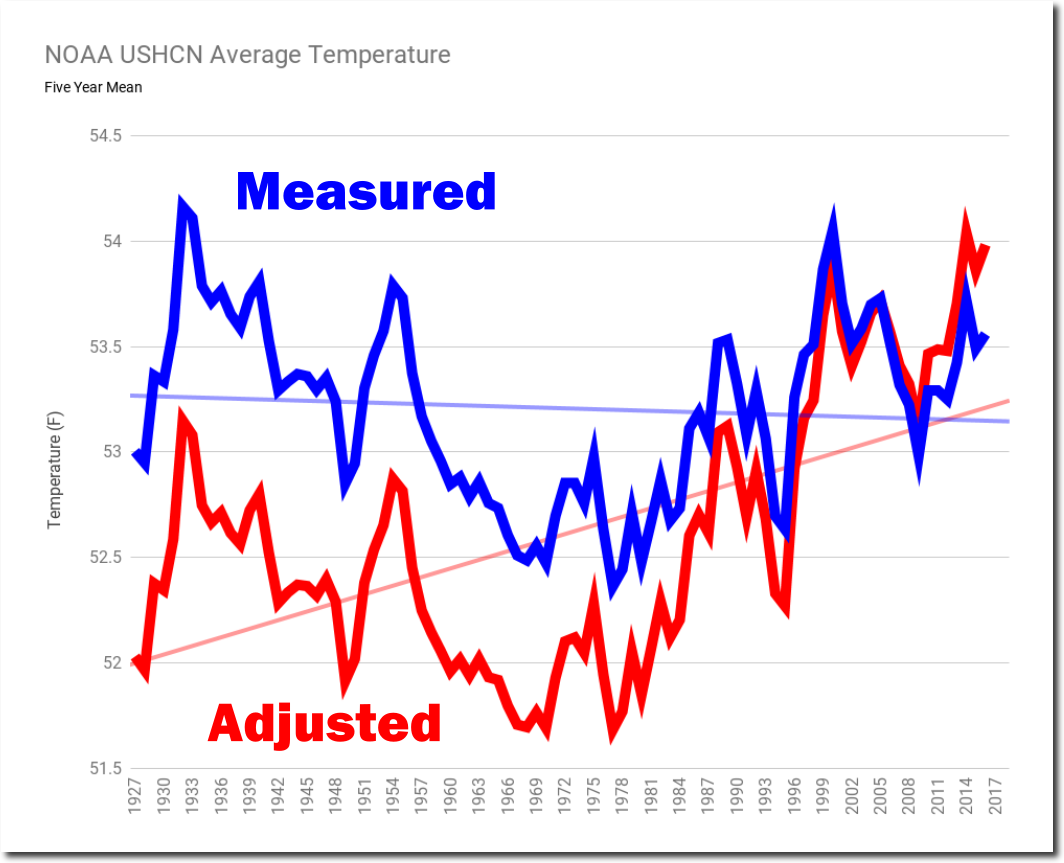
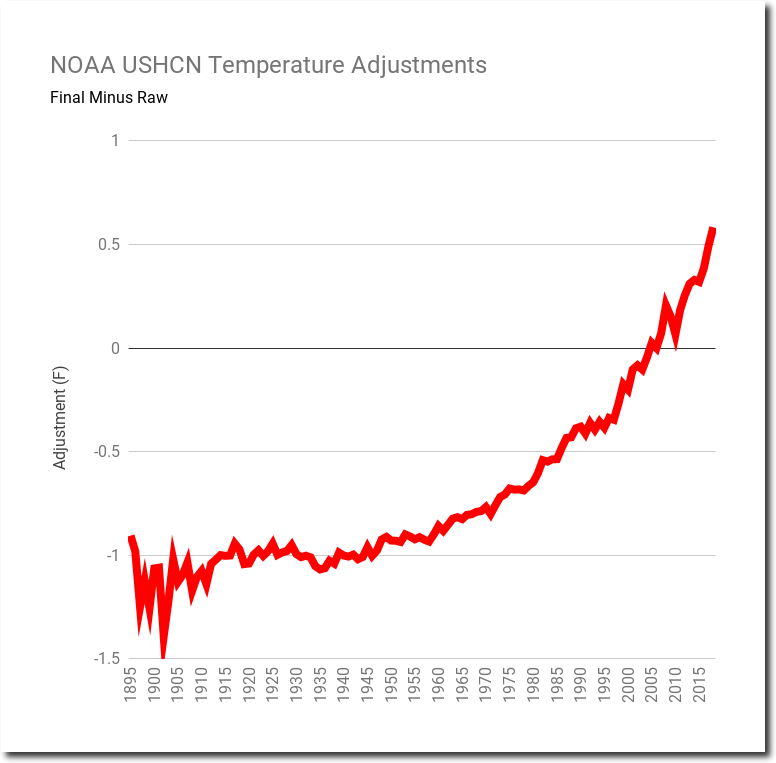
But before data tampering, the US has been cooling for the past 90 years.  The claimed warming trend is entirely due to data tampering.

The data is altered in a spectacular hockey stick – with temperatures before the year 2000 progressively cooled, and temperatures after 2000 progressively warmed.

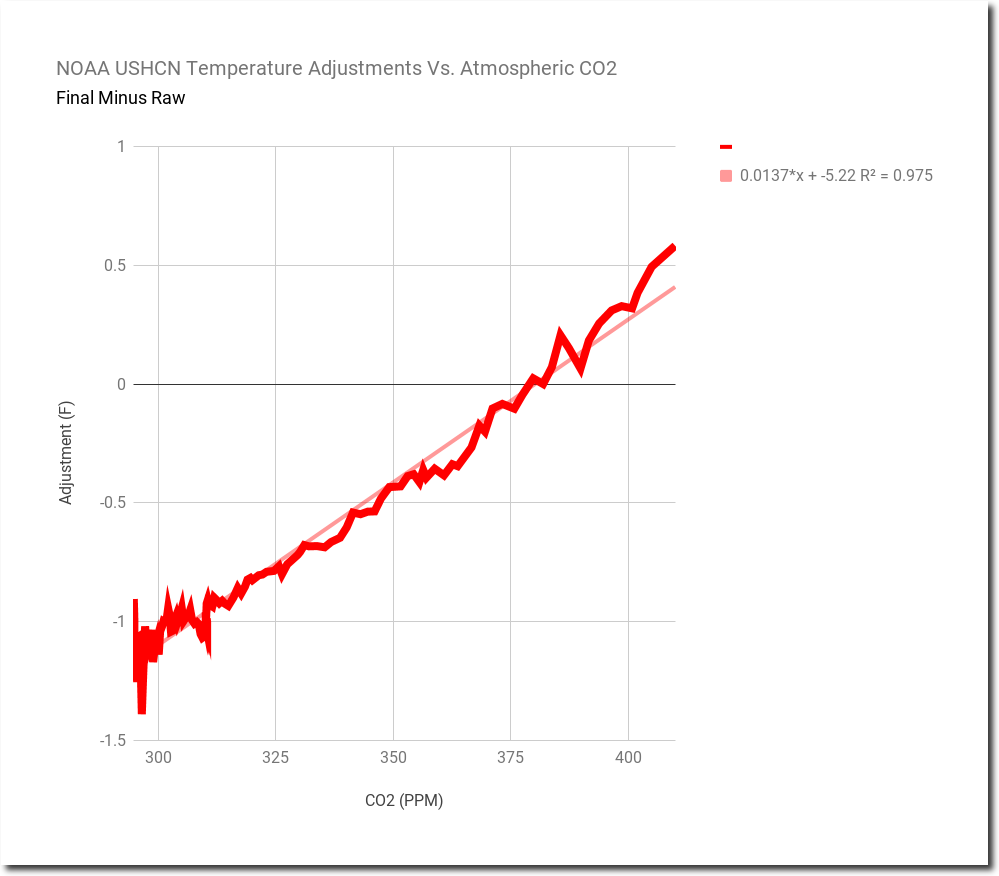
When plotted vs. CO2, it becomes clear that US warming is the ultimate junk science.  The data is being precisely altered to match CO2 theory, with an R² of 0.975.

Spreadsheet    Data

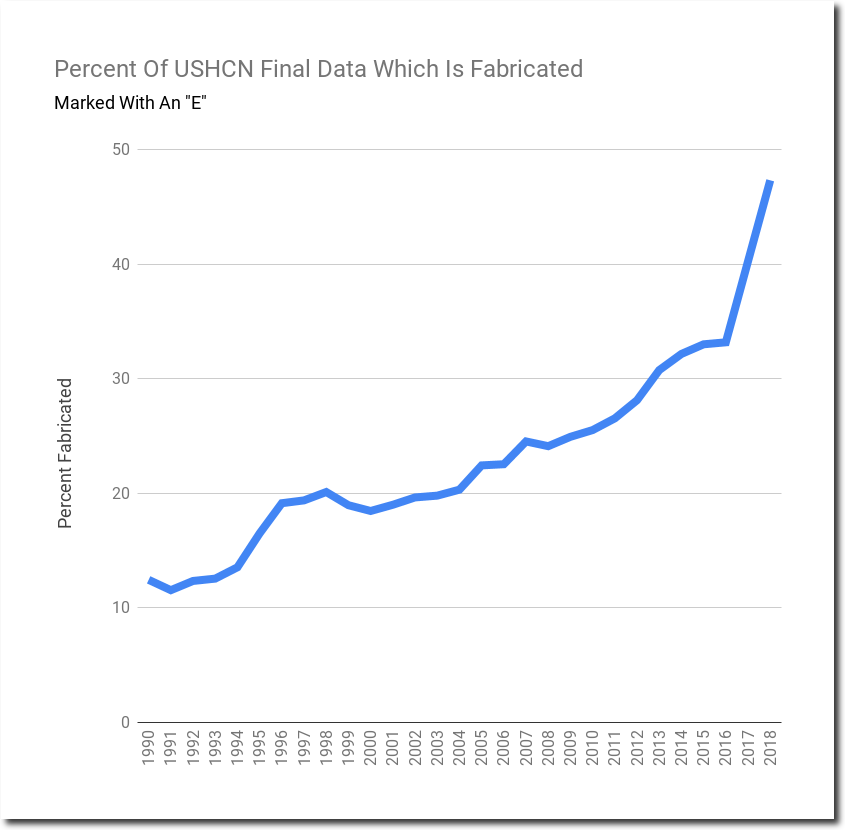
A lot of this fraud is done with good old fashioned “just making stuff up.” Almost half of the data is currently being fabricated. Forty-seven percent of the monthly US temperature data is marked by NOAA with an “E’ – which means it is estimated.

This junk science may seem really, really awful, but you are a racist if you don’t accept the reality of man-made warming data-tampering.

Posted in Uncategorized | Leave a comment

New Ice-Free Arctic Date

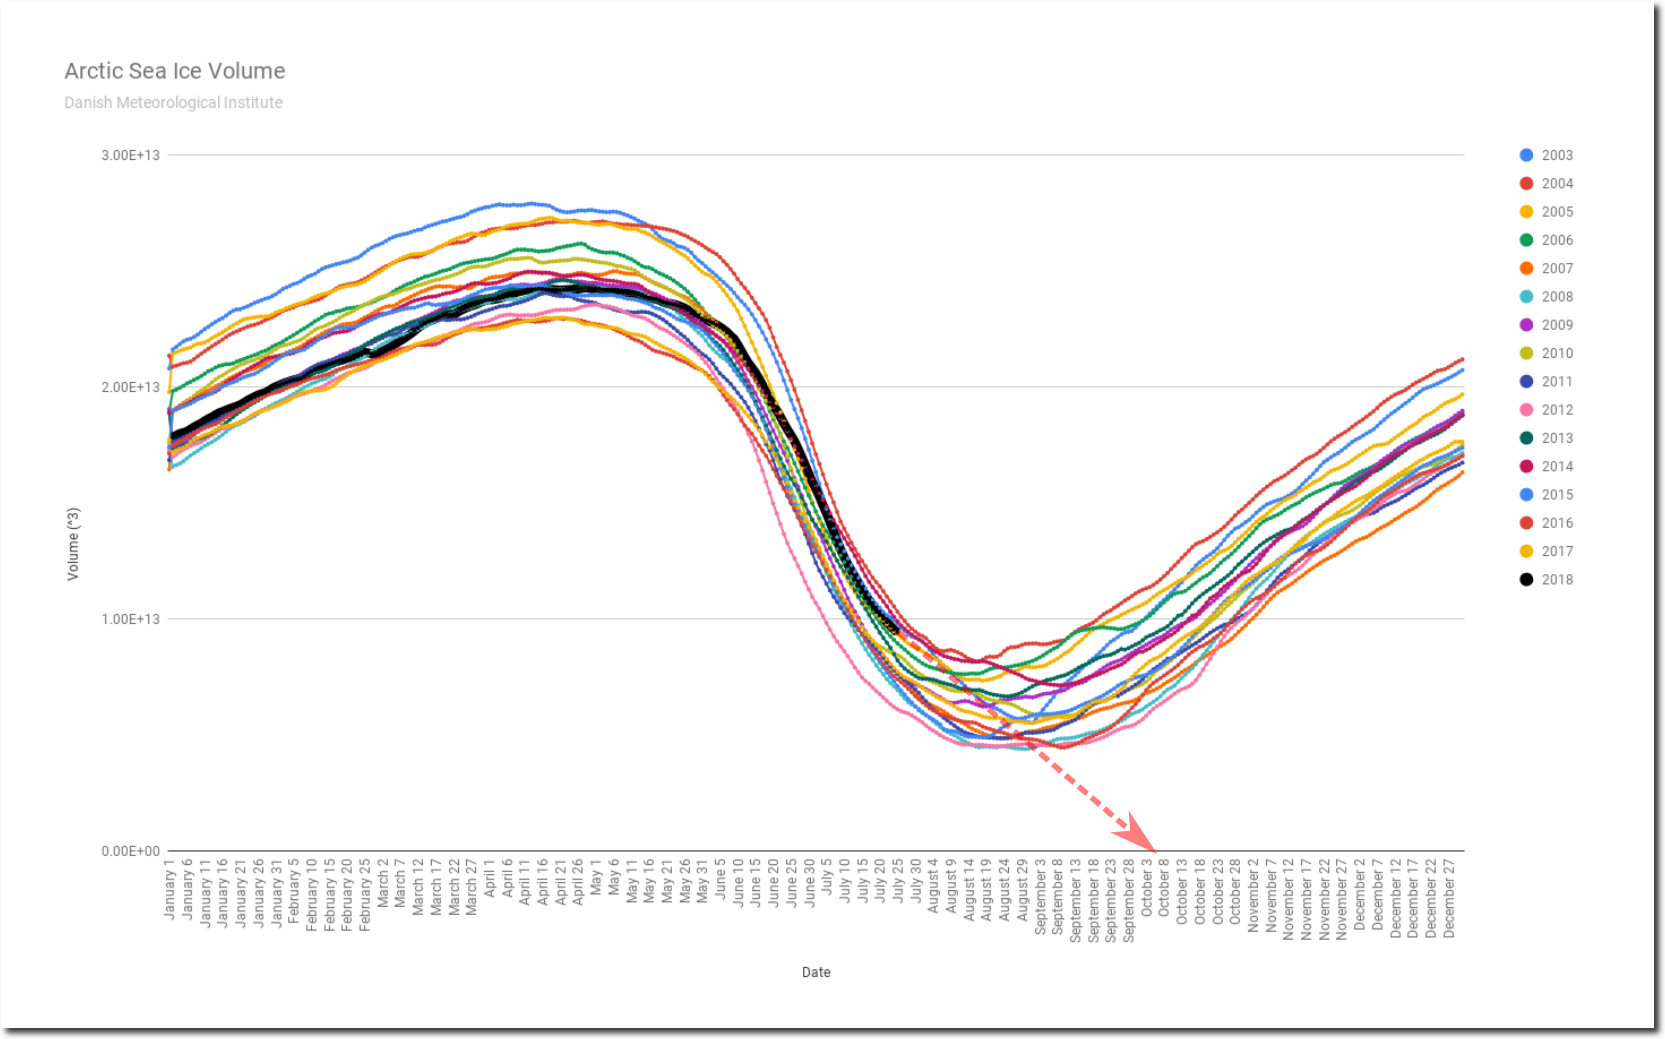
Arctic sea ice volume loss slowed again yesterday, so I am now pushing my ice-free Arctic forecast out to October 5, 2018 at 2:31 am.

Volume is the fourth highest in the DMI record, and likely to move into the #3 spot in about two weeks.

Spreadsheet    Data

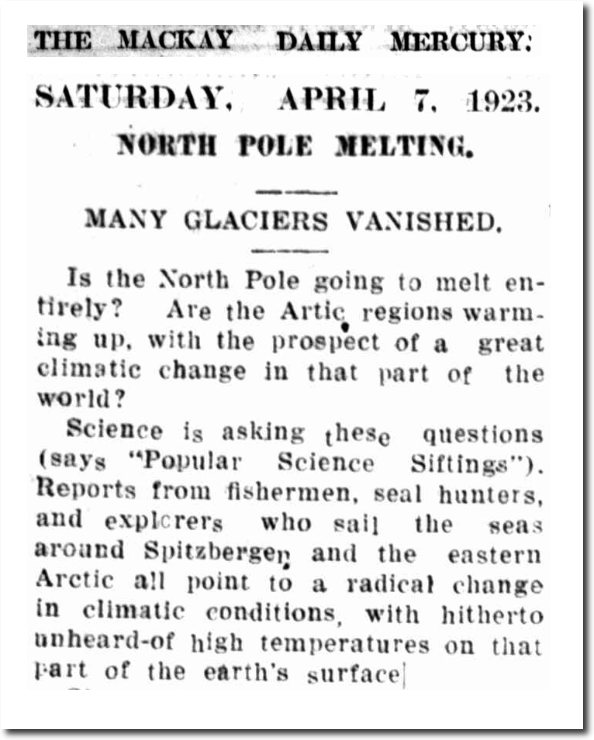
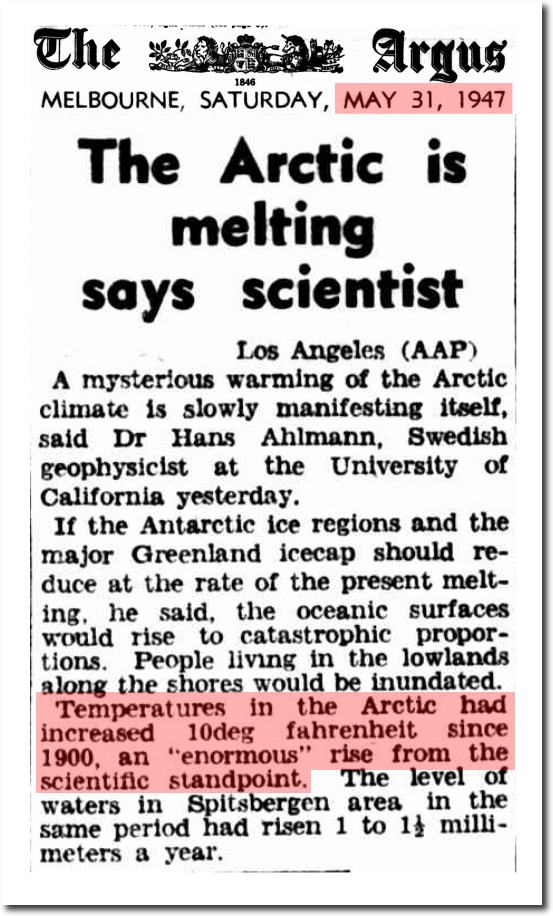
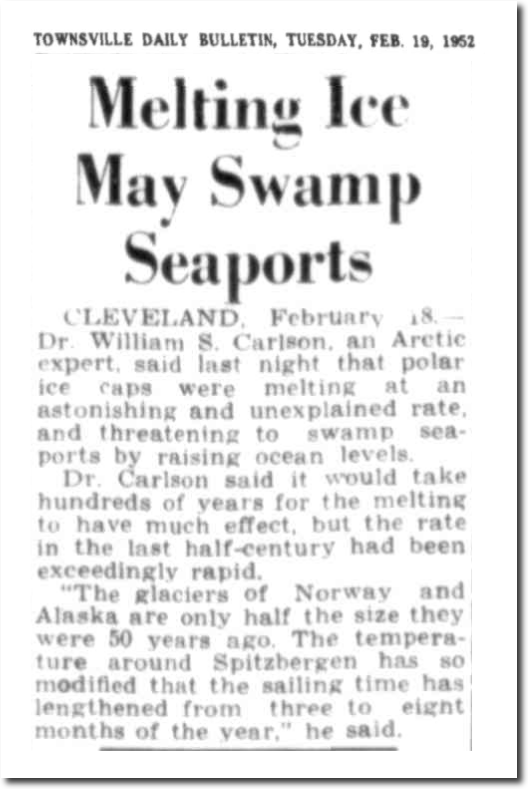
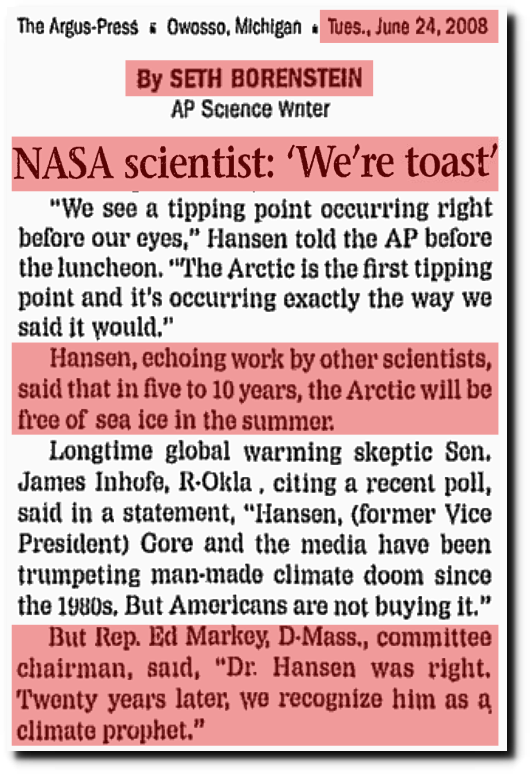
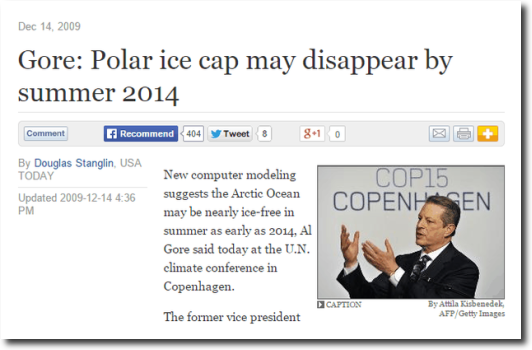
Scientists, Nobel Prize winners and Democratic Party prophets have been predicting the ice-free Arctic for a very long time, and now we are only a few weeks away.

07 Apr 1923 – NORTH POLE MELTING. – Trove

31 May 1947 – The Arctic is melting says scientist – Trove

19 Feb 1952 – Melting Ice May Swamp Seaports – Trove

The Argus-Press – Google News Archive Search

Gore: Polar ice cap may disappear by summer 2014

Posted in Uncategorized | Leave a comment

Democrats And Morality

“She was a liar. She was an unethical, dishonest lawyer. She conspired to violate the Constitution, the rules of the House, the rules of the committee and the rules of confidentiality.”

  • Jerry Zeifman , Hillary Clinton’s Watergate Committee Boss

And her husband is a rapist.  Democrats nominated Clintons three times, and the most recent time they made the rapist spouse their keynote speaker.

Posted in Uncategorized | Leave a comment

Understanding The Difference Between Treason And Good Journalism

Treason is when you publish private conversations of Democrats.  Pulitzer Prize winning journalism is when you publish private conversations of Republicans.

Posted in Uncategorized | Leave a comment

Hiding The Inconvenient Satellite Data

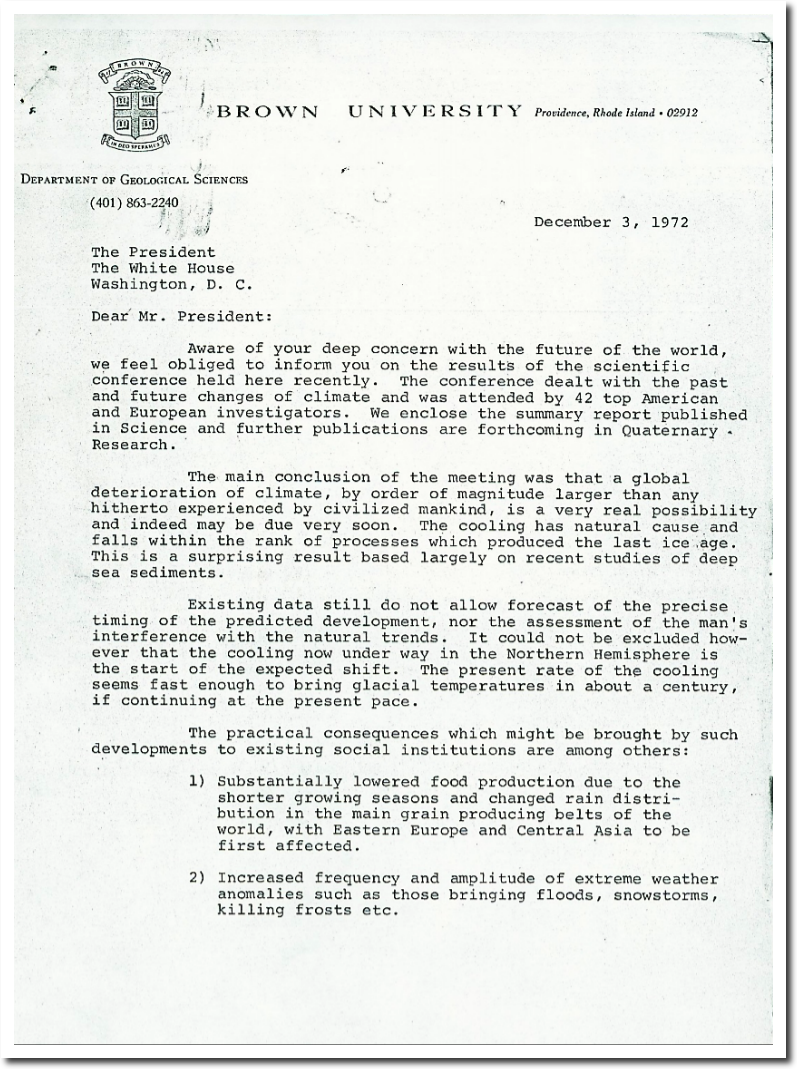
In 1972,  forty-two “top European and American investigators” predicted a rapidly approaching new ice age –  based on an increase in snow and ice cover from 1967-1972.

The technique employed …..  depends on the averaging of information from standard and ‘infra-red satellite weather pictures.

29 Jan 1974, 5 – The Guardian at Newspapers.com

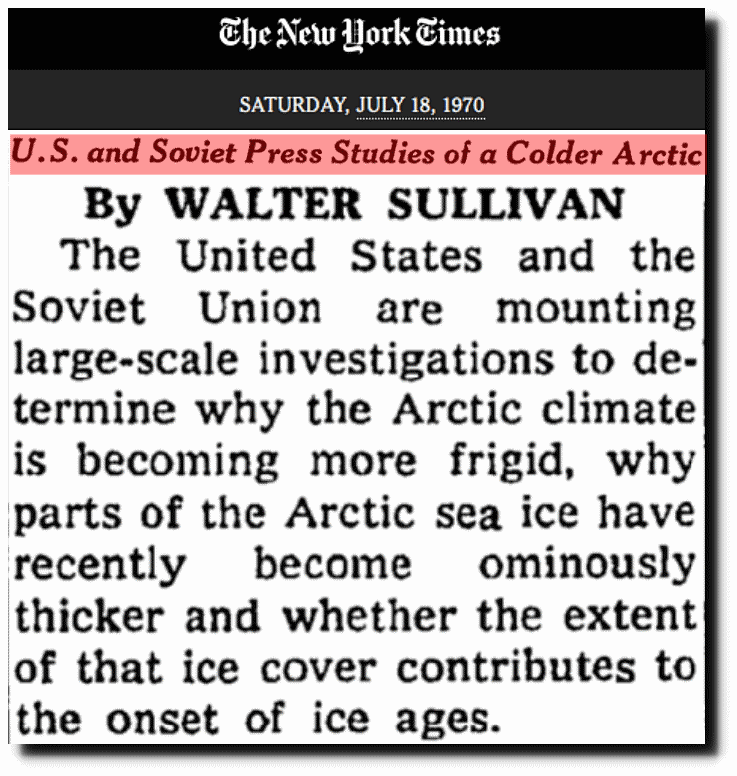
The Arctic climate was becoming more frigid, the ice was getting “ominously thicker.”

U.S. and Soviet Press Studies of a Colder Arctic – The New York Times

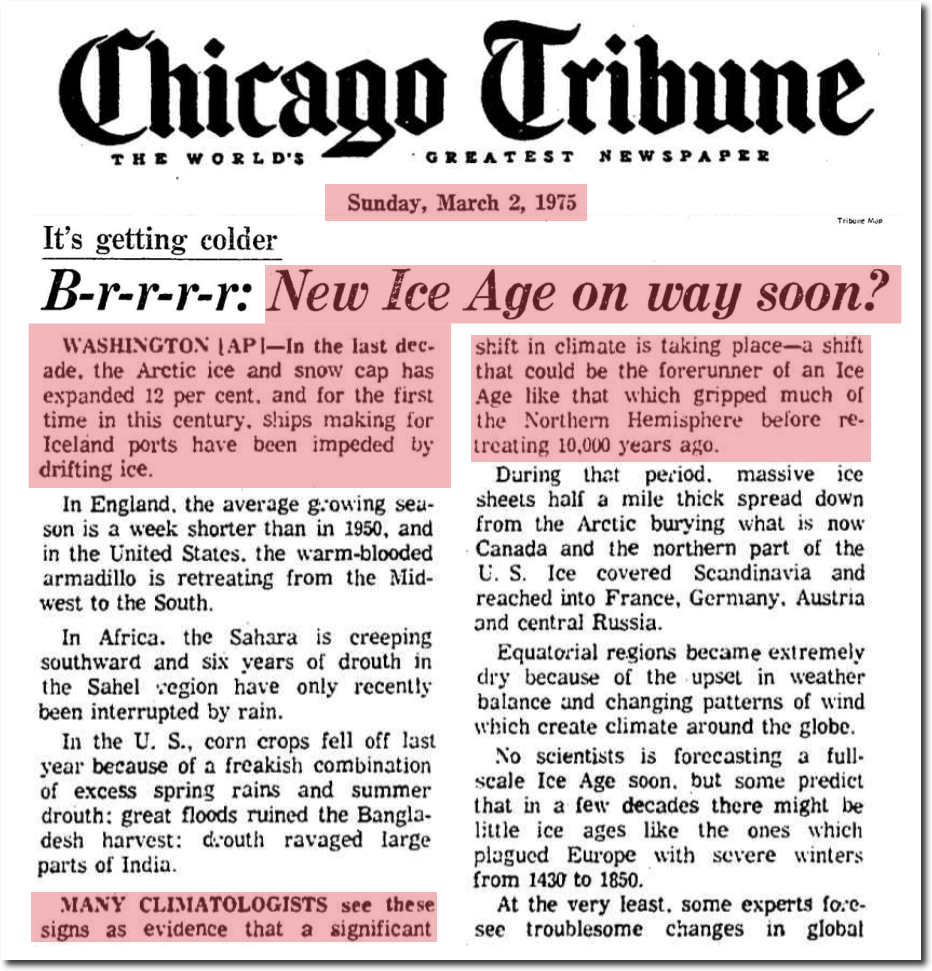
Icelandic ports were blocked with ice for the first time in the 20th century.

March 2, 1975 – B-r-r-r-r: New Ice Age on way soon? | Chicago Tribune Archive

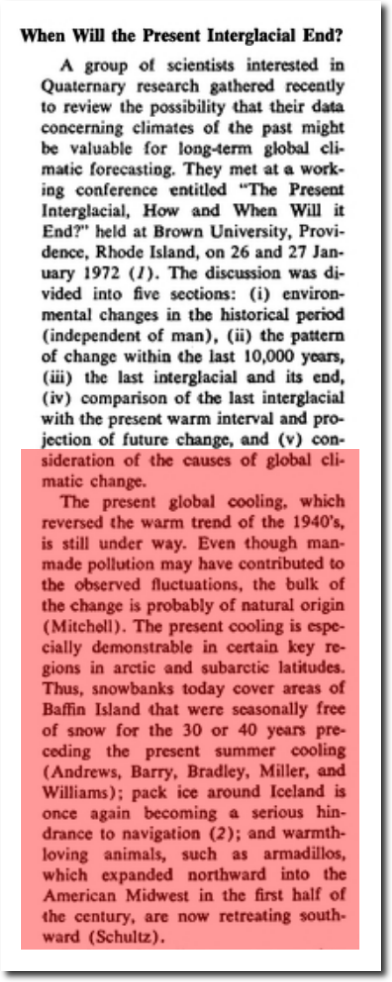
When Will the Present Interglacial End? | Science

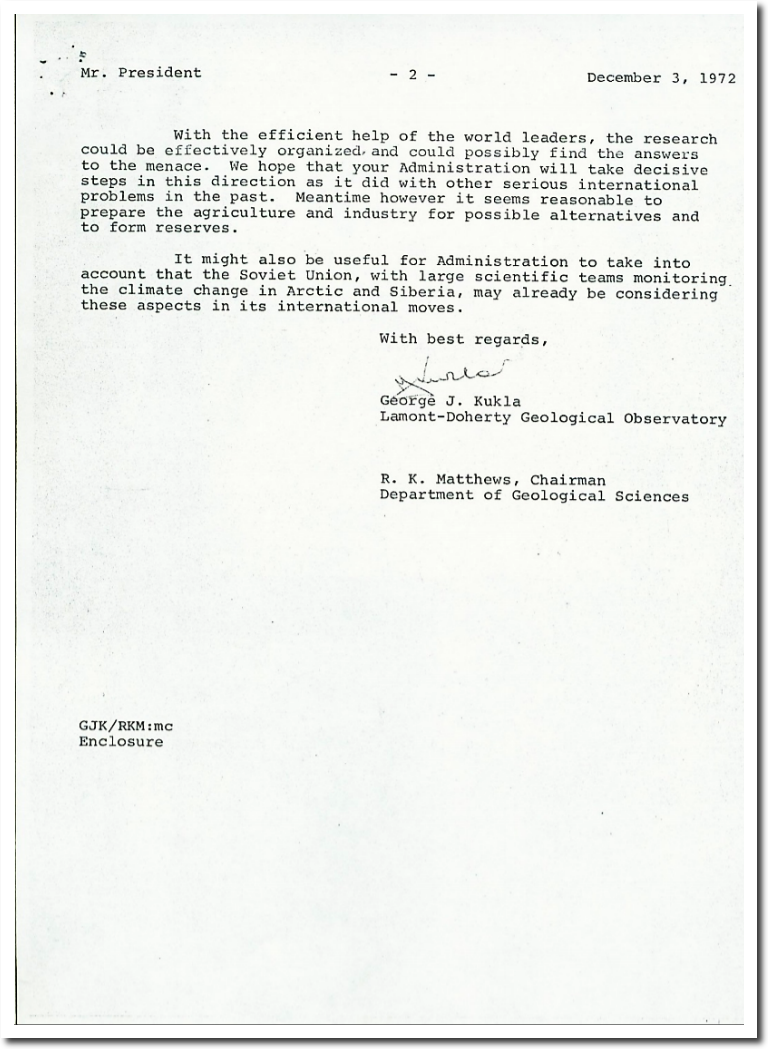
These top scientists sent a letter to President Nixon warning of a new ice age within a century.
THE ROLE OF NOAA’S CLIMATE PREDICTION CENTER IN THE DEVELOPMENT OF CLIMATE SERVICES

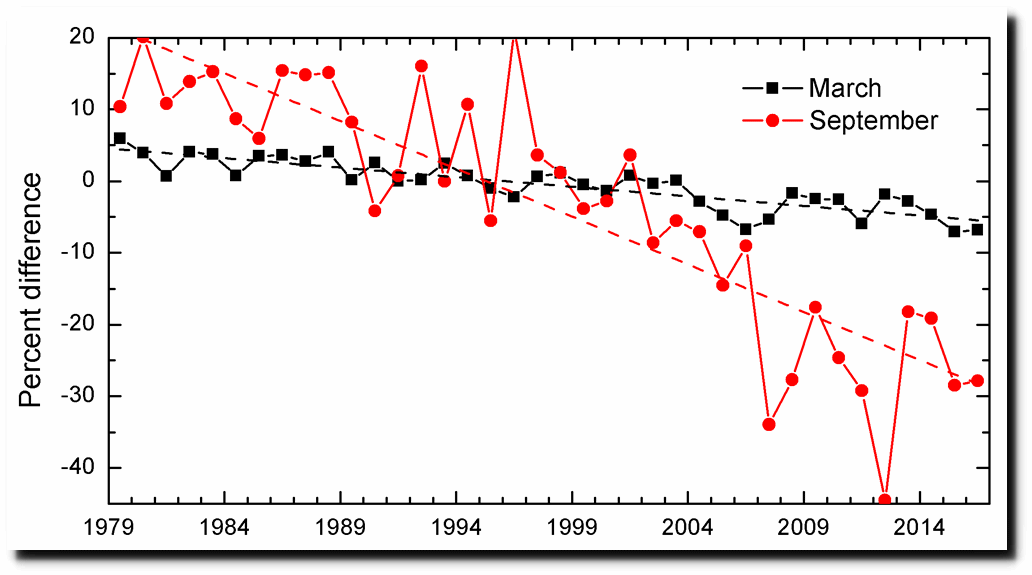
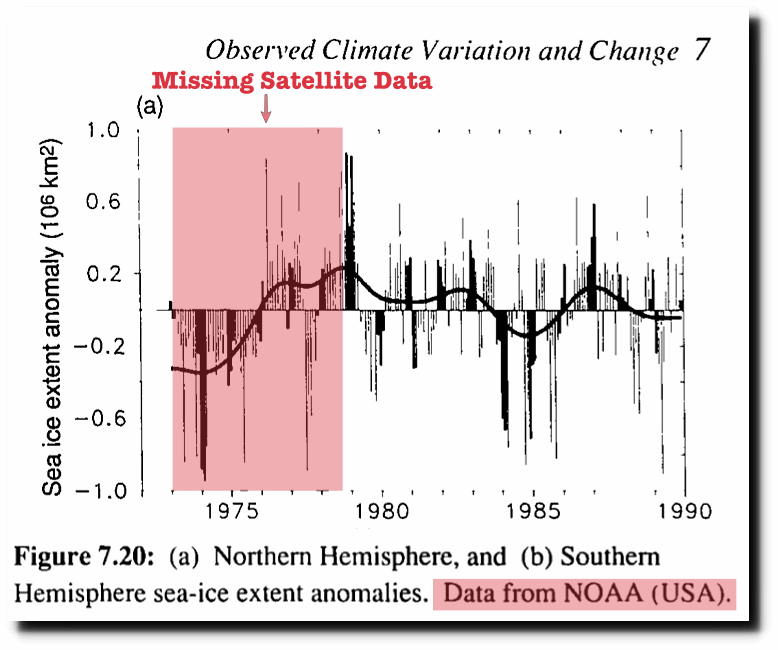
NOAA now pretends that time began in 1979, and that they don’t have any satellite data prior to the 1979 peak.

minimum sea ice extent at the end of summer 2016 tied with 2007 for the second lowest in the satellite record, which started in 1979.
ftp://ftp.oar.noaa.gov/arctic/documents/ArcticReportCard_full_report2016.pdf

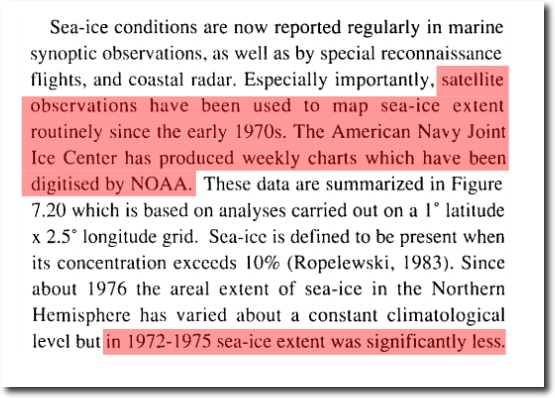
The 1990 IPCC report showed some of the inconvenient data, which NOAA is now hiding. However, it did not show the 12% increase prior to 1972.

satellite observations have been used to map sea-ice extent routinely since the early 1970s. The American Navy Joint Ice Center has produced weekly charts which have been digitised by NOAA.
1990 IPCC Report

The 1985 DOE report (predecessor to the IPCC) showed sea ice extent was much lower in the 1950’s than it was in the 1970’s.
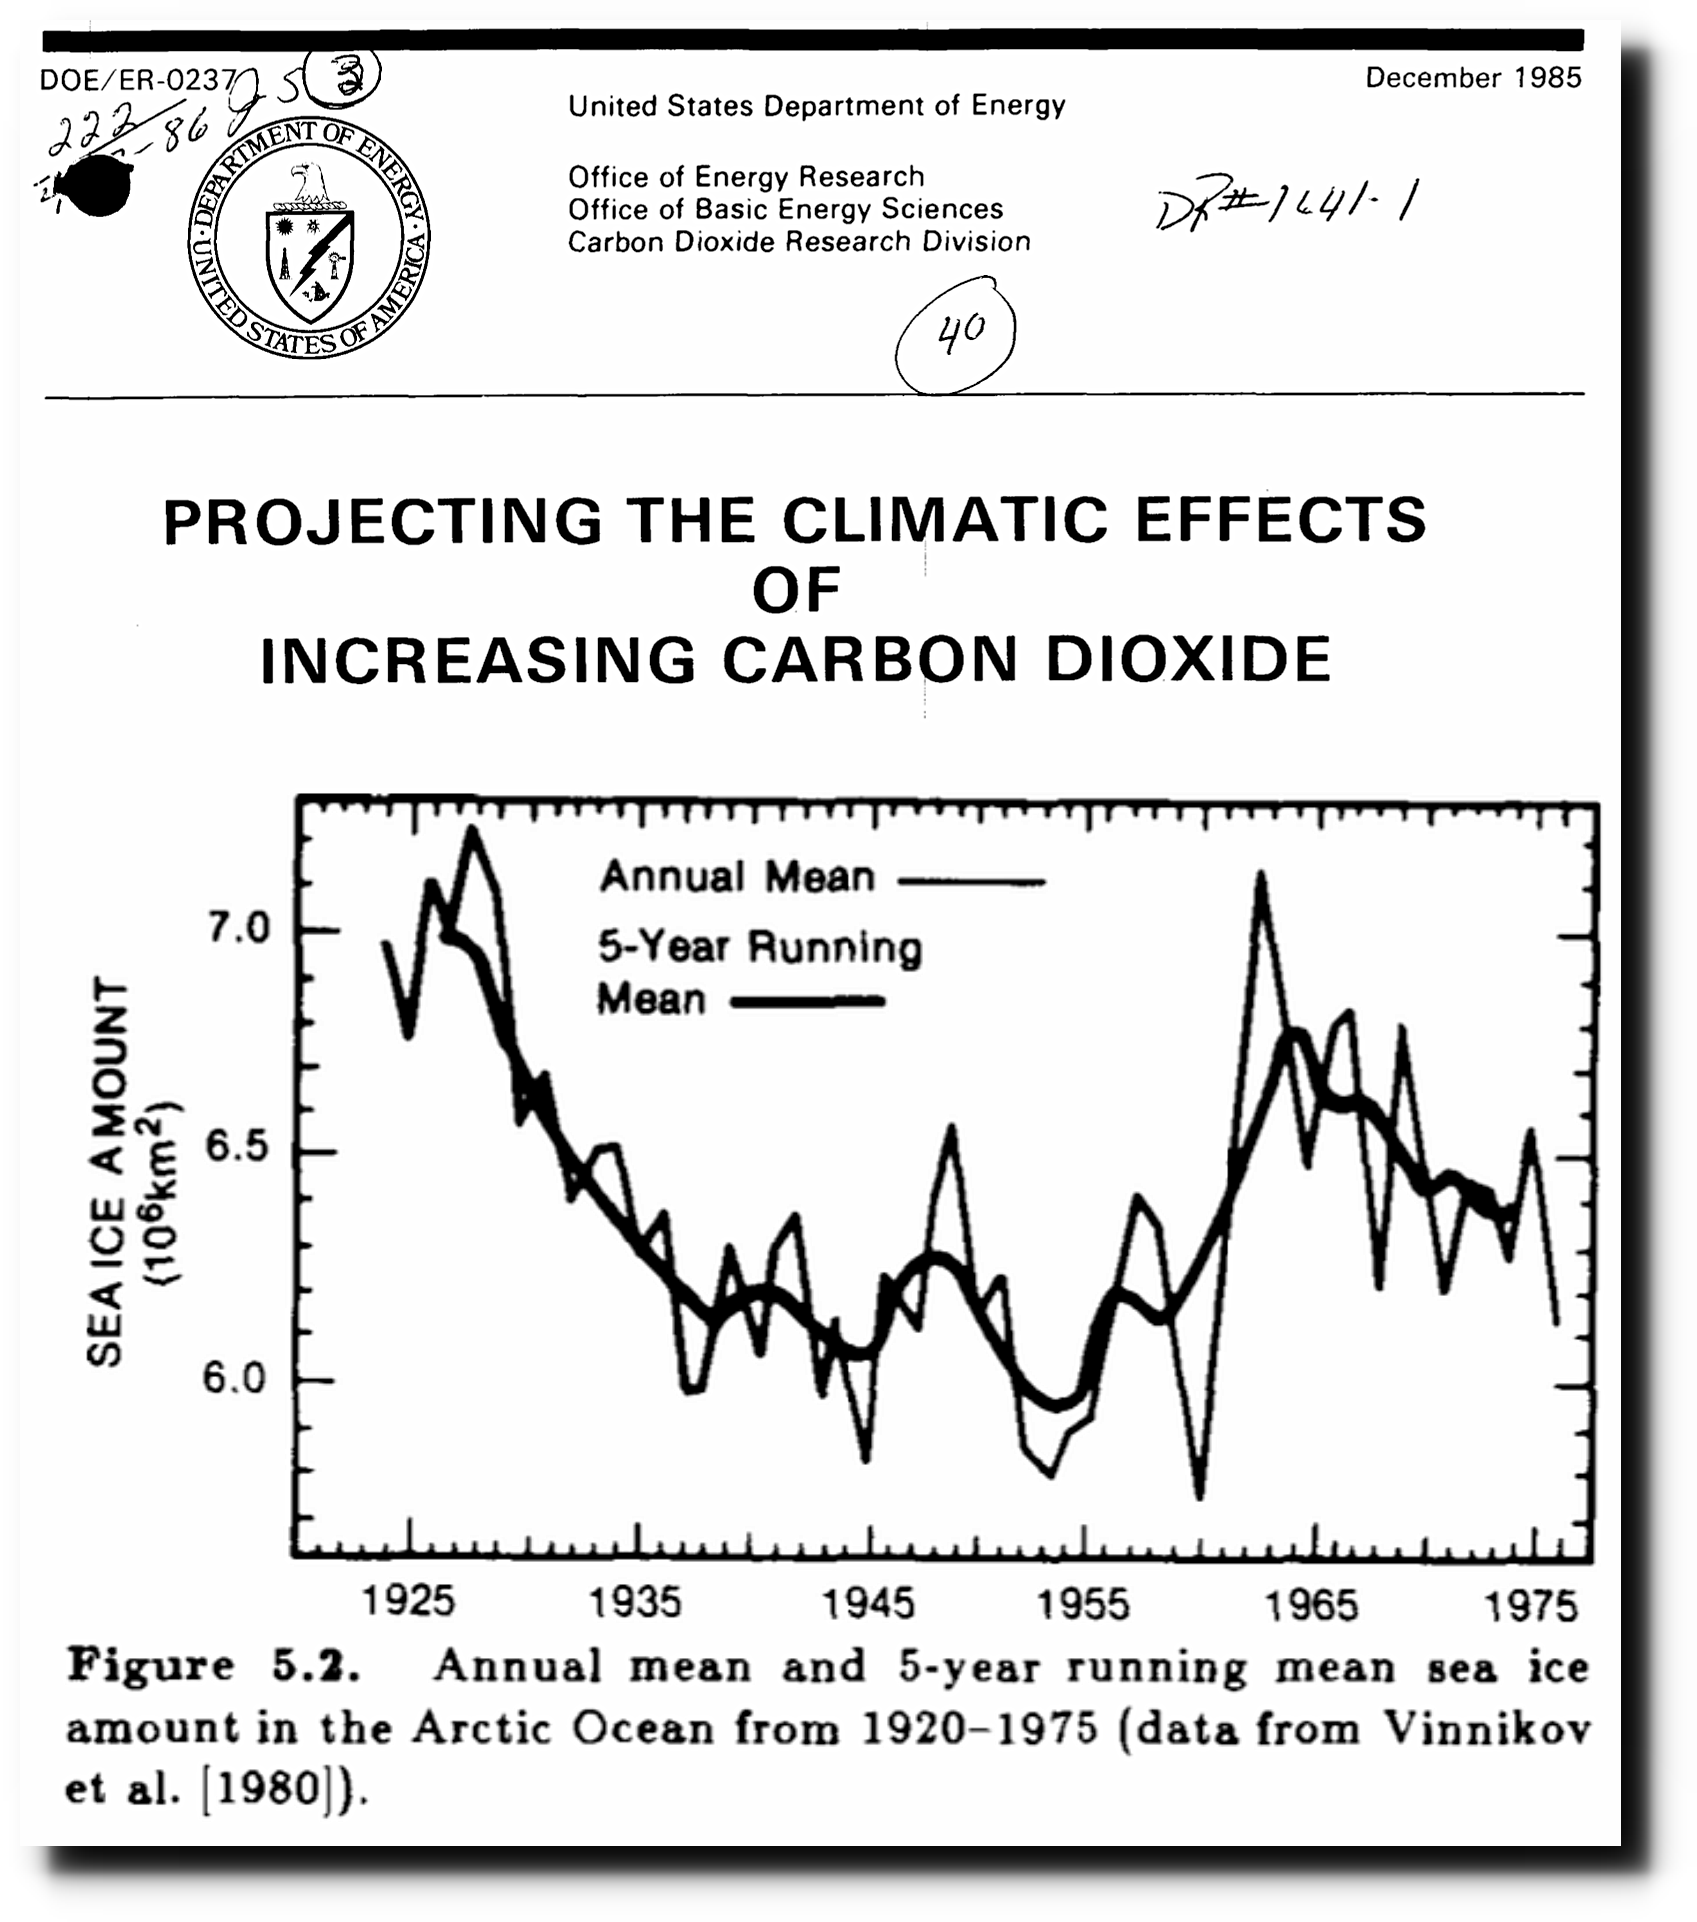
Projecting the climatic effects of increasing carbon dioxide (Technical Report) | SciTech Connect

Arctic sea ice is now about the same thickness (two meters) as it was sixty years ago, and sixty years later the New York Times is still making the same ice-free Arctic forecasts.
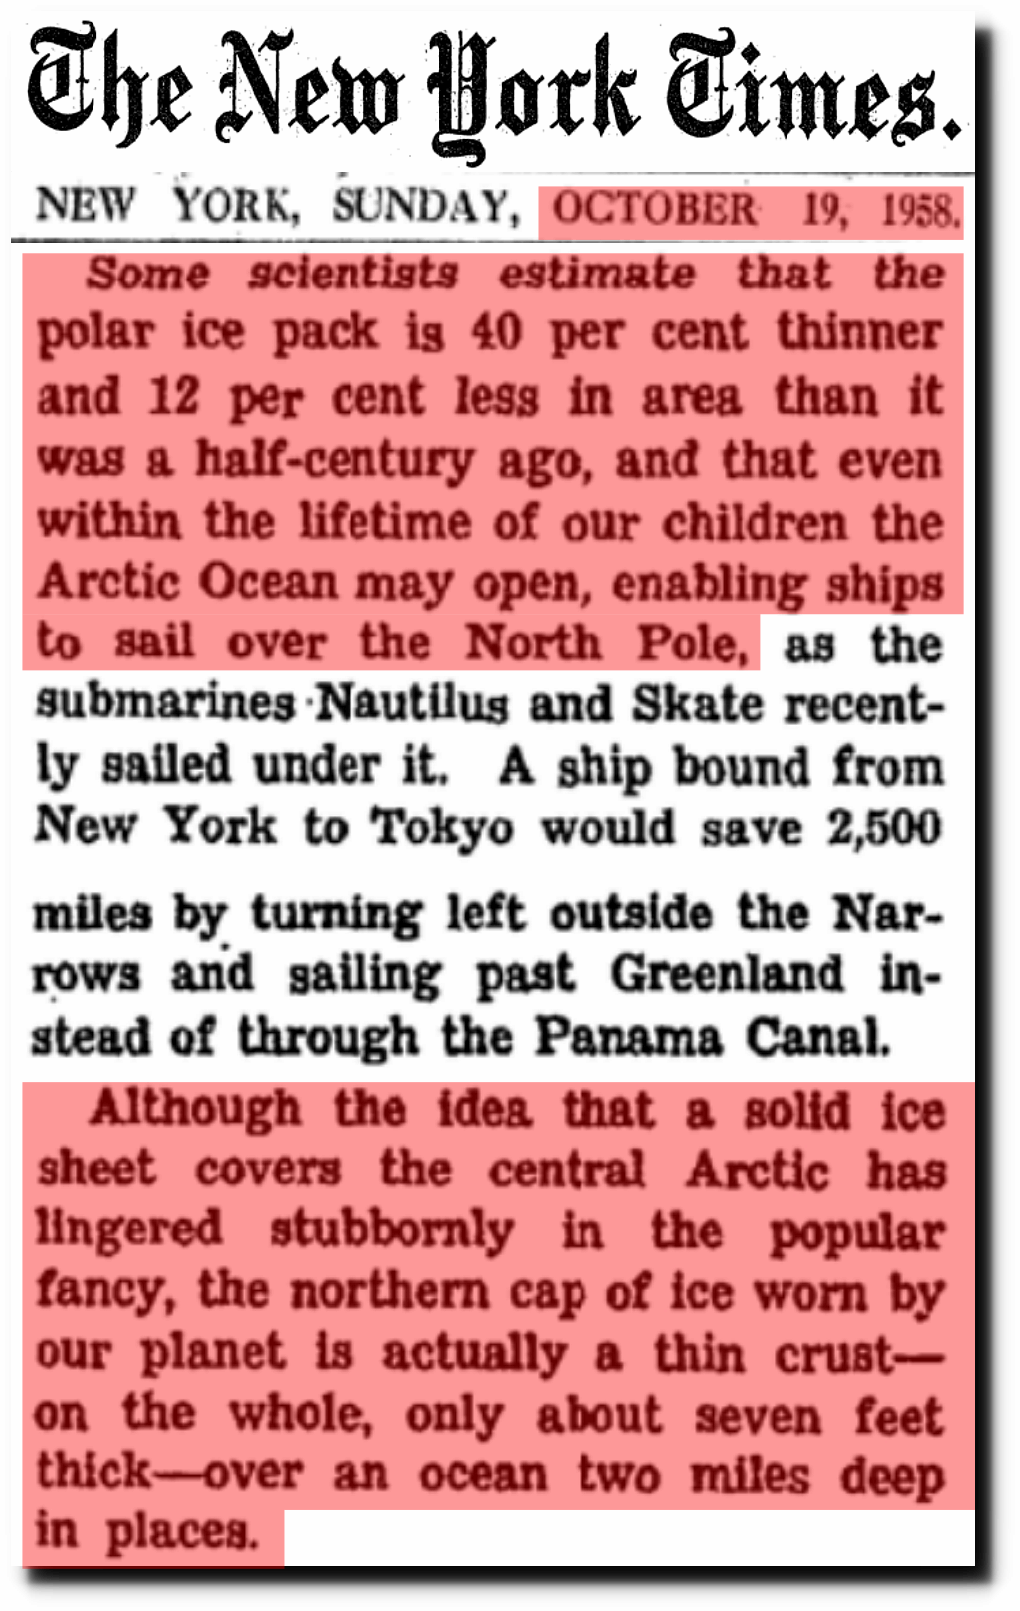
The Changing Face of the Arctic; The Changing Face of the Arctic – The New York Times
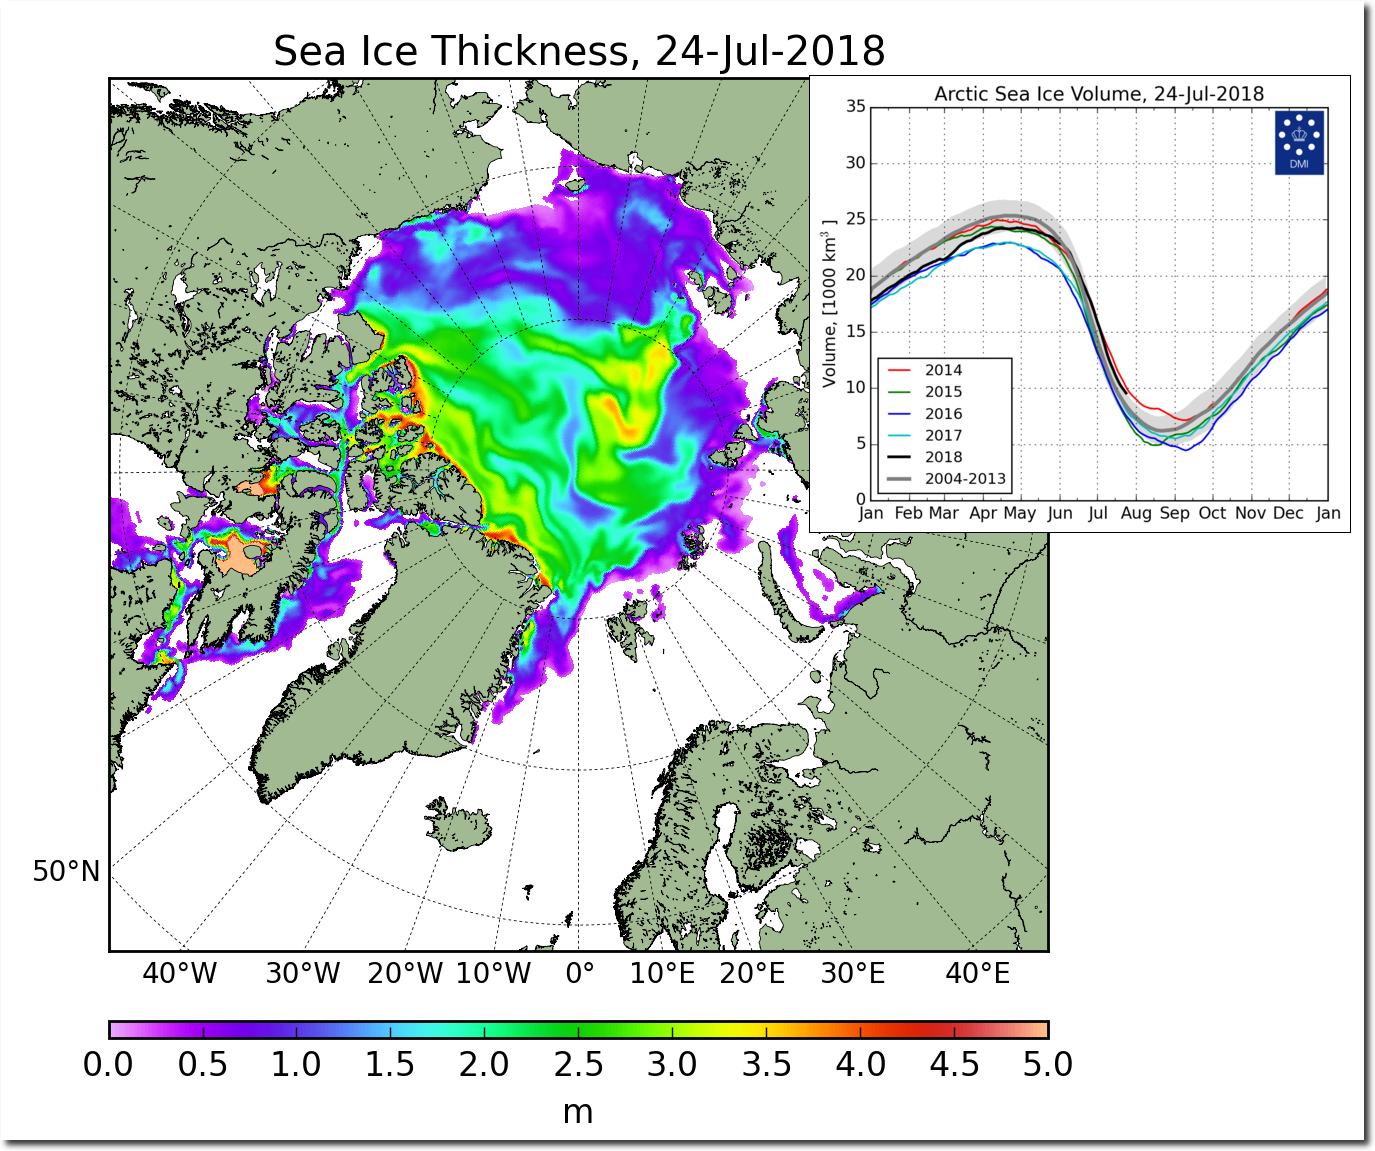
FullSize_CICE_combine_thick_SM_EN_20180724.png (1337×1113)

All of NOAA’s cheating and hiding data is about to unravel however. Arctic sea ice volume is fourth highest in the last 15 years.
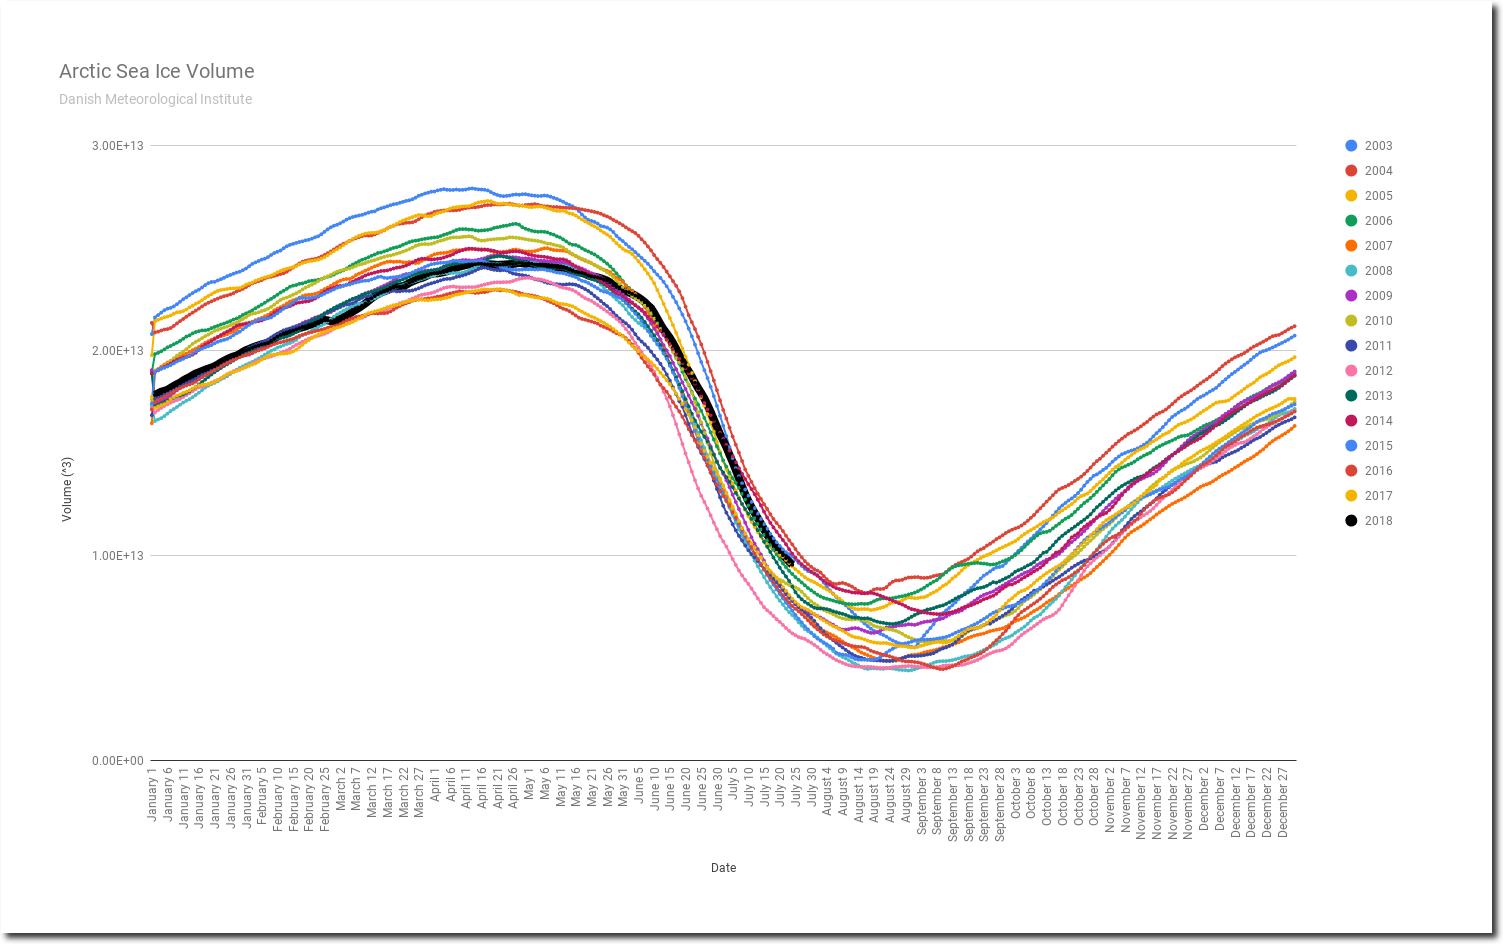
Spreadsheet    Data

And winter snow cover has continued to increase since 1967.
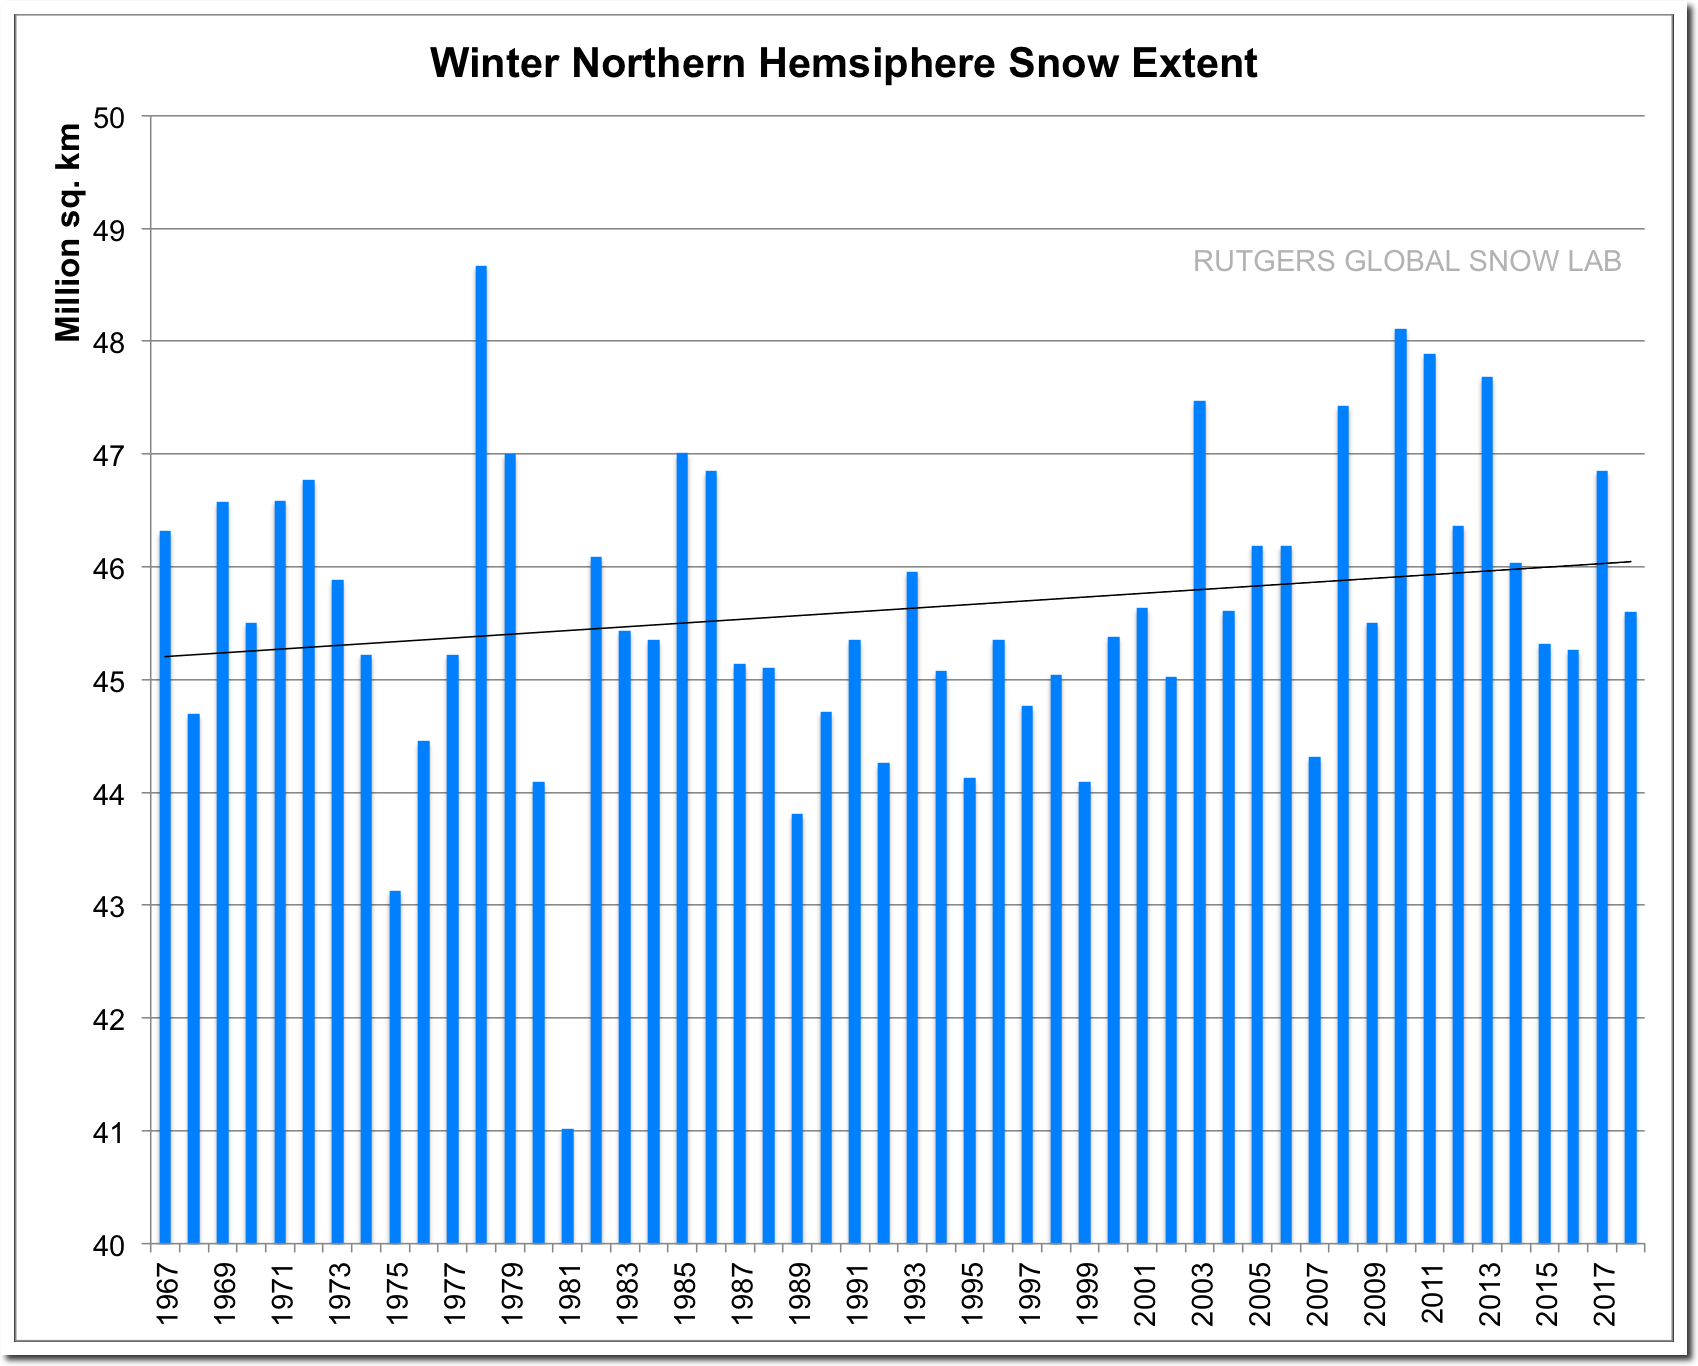
Rutgers University Climate Lab :: Global Snow Lab

Nothing is happening in the Arctic. The entire global warming scam is based on lies and data tampering. And most importantly rewriting history.

Posted in Uncategorized | Leave a comment