July 5, 1936 – Hottest Day On Record In South Dakota

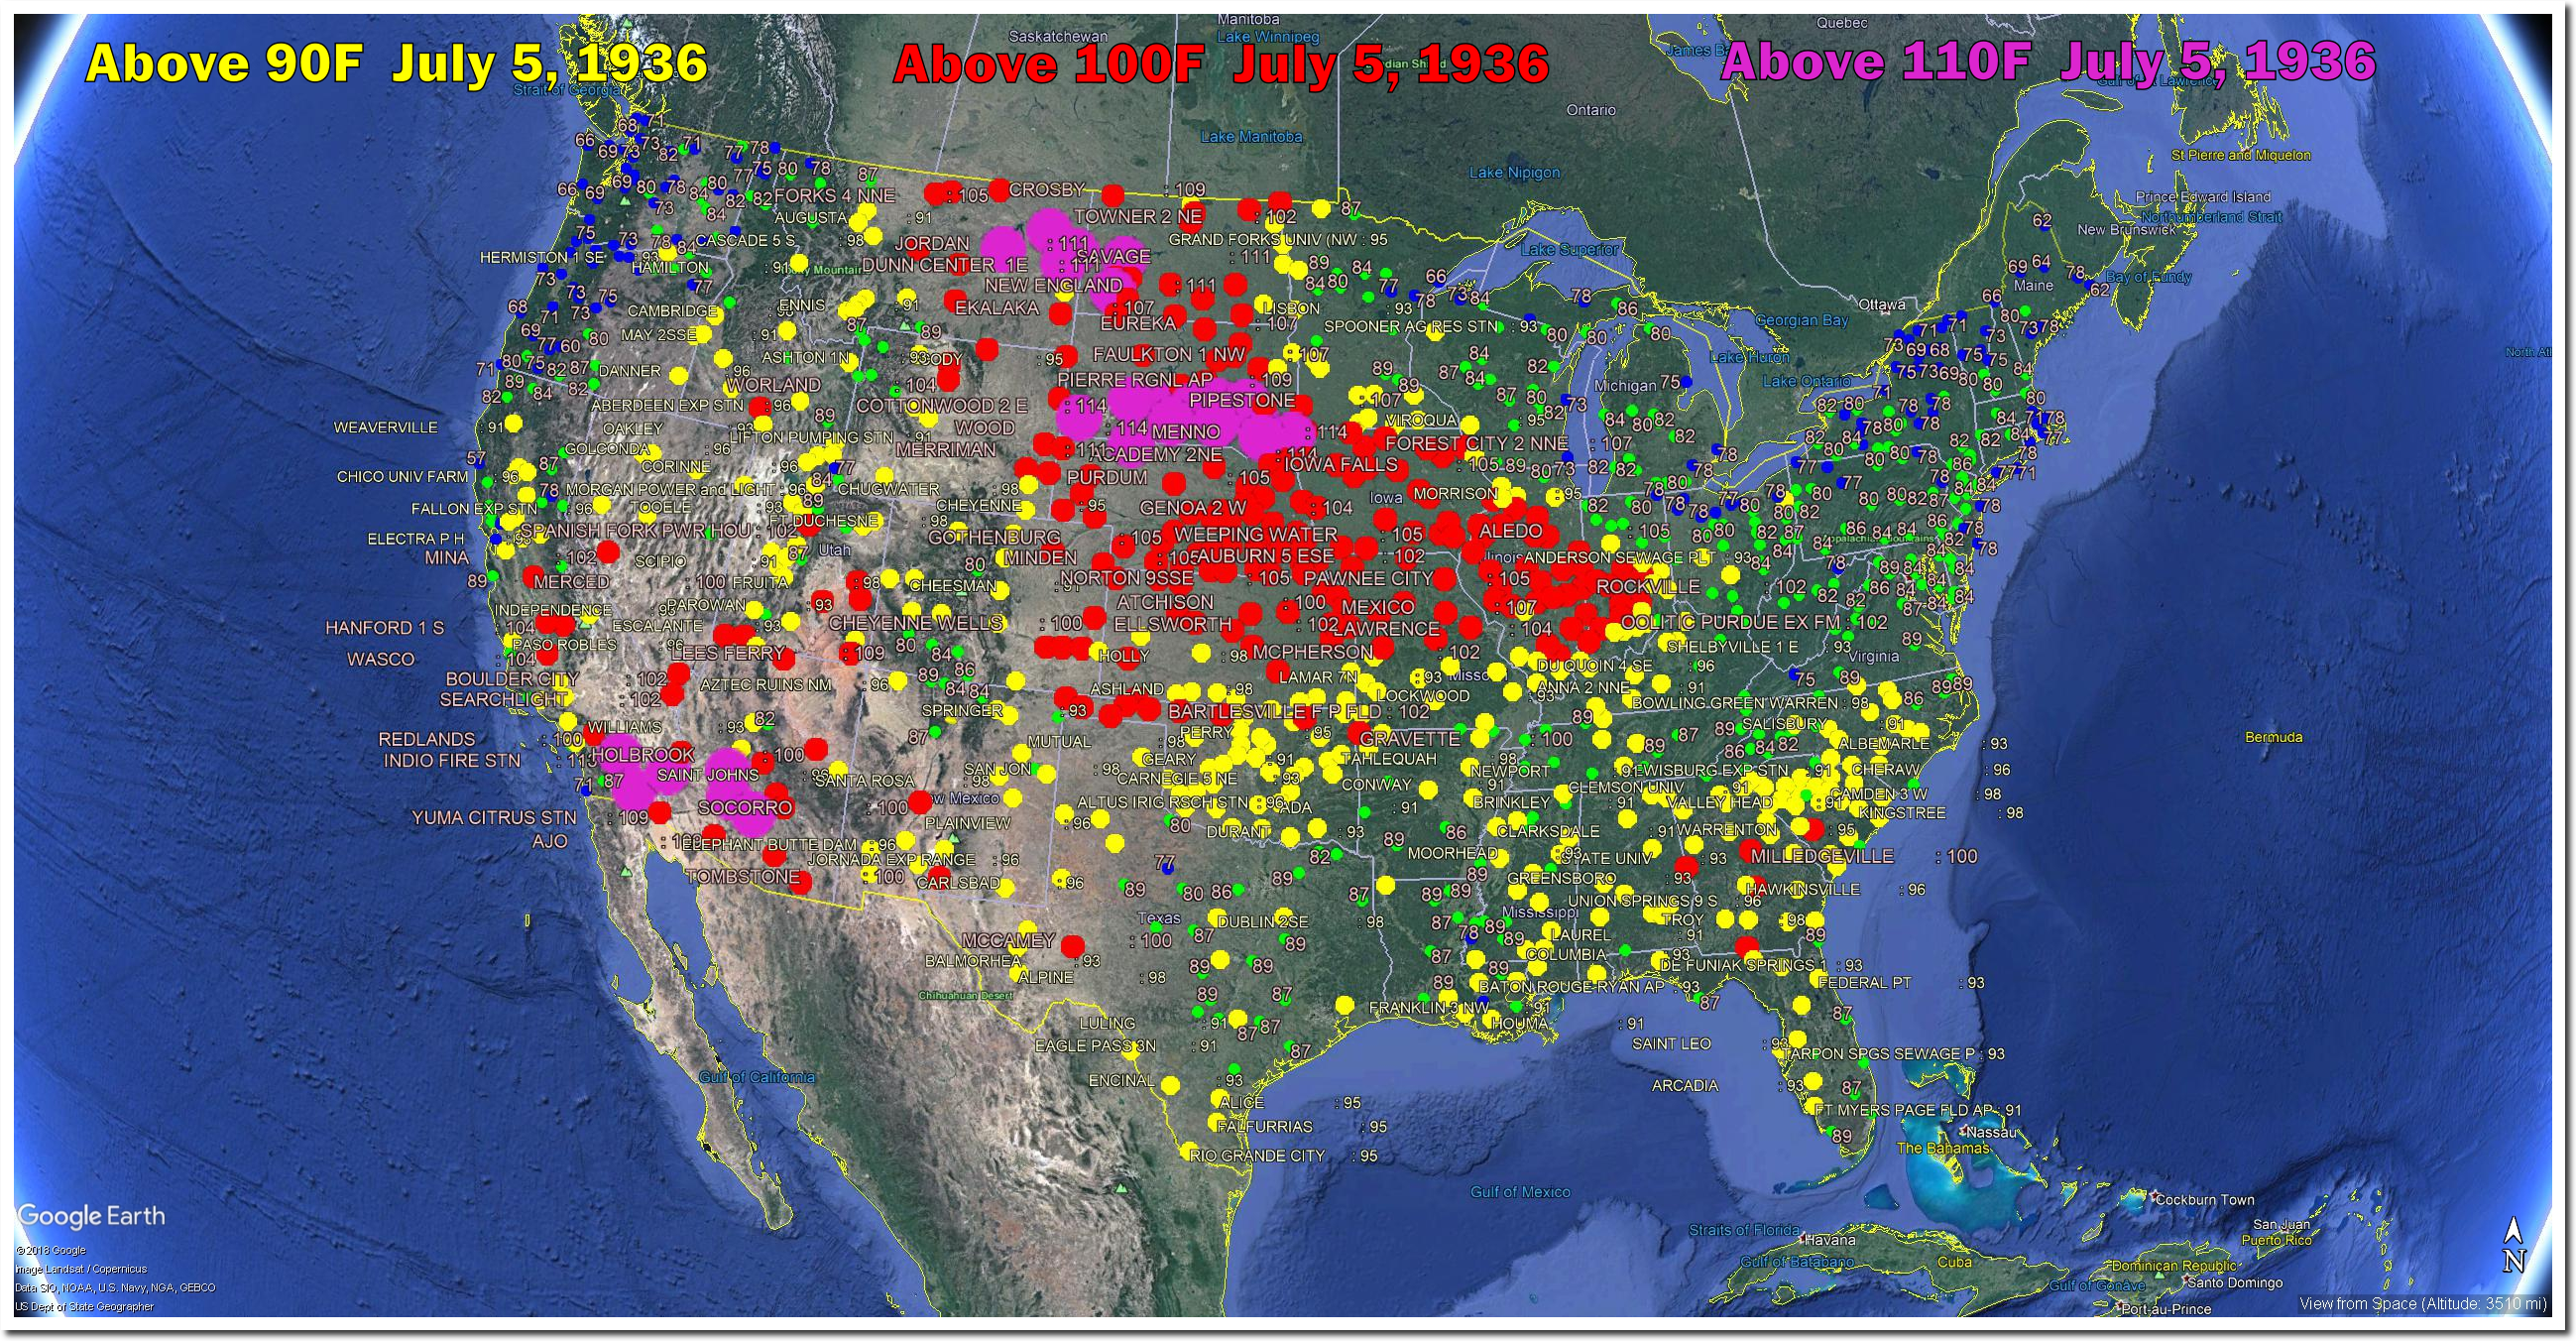
On this date in 1936, Gann Valley, South Dakota reached 120 degrees – the hottest temperature ever recorded in South Dakota.
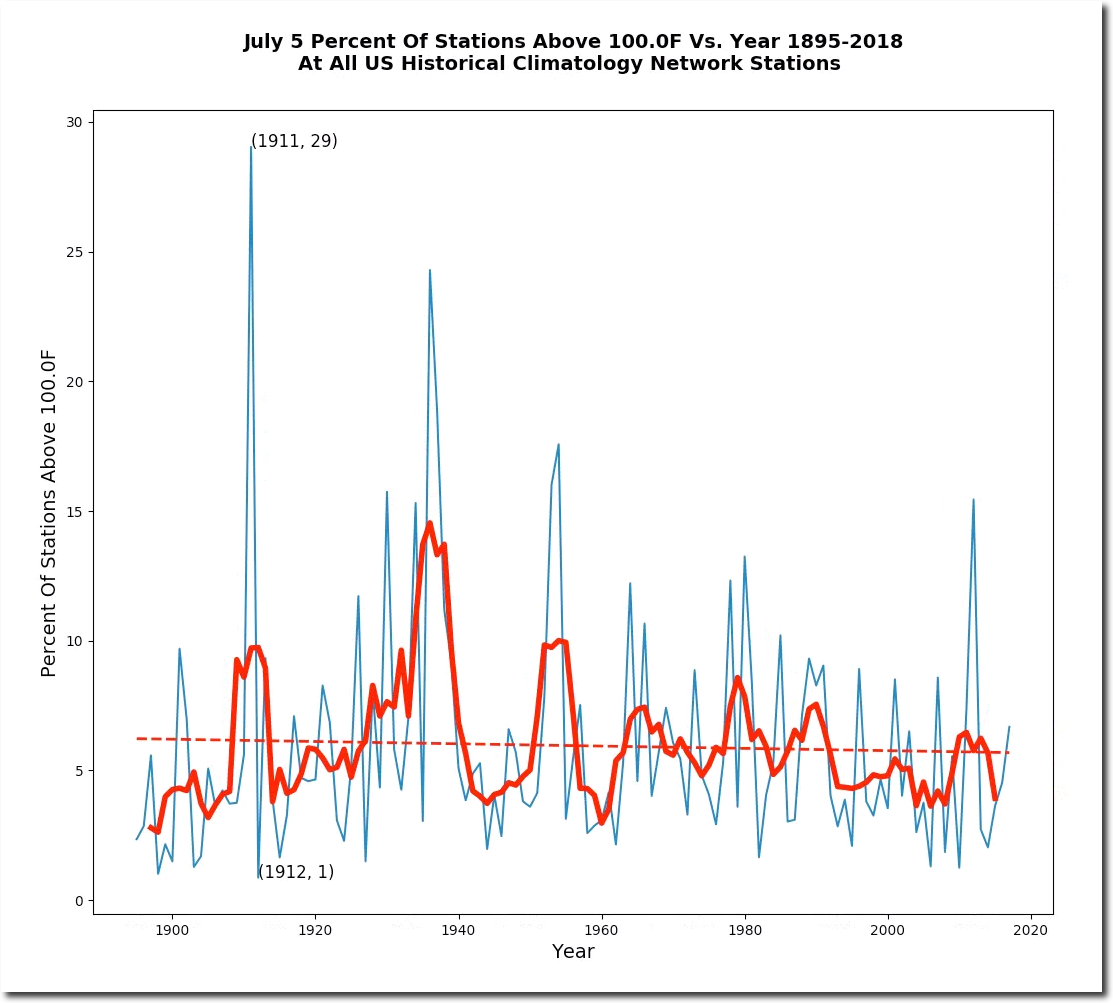
The hottest July 5th occurred in 1911. with 100 degree temperatures into New England.
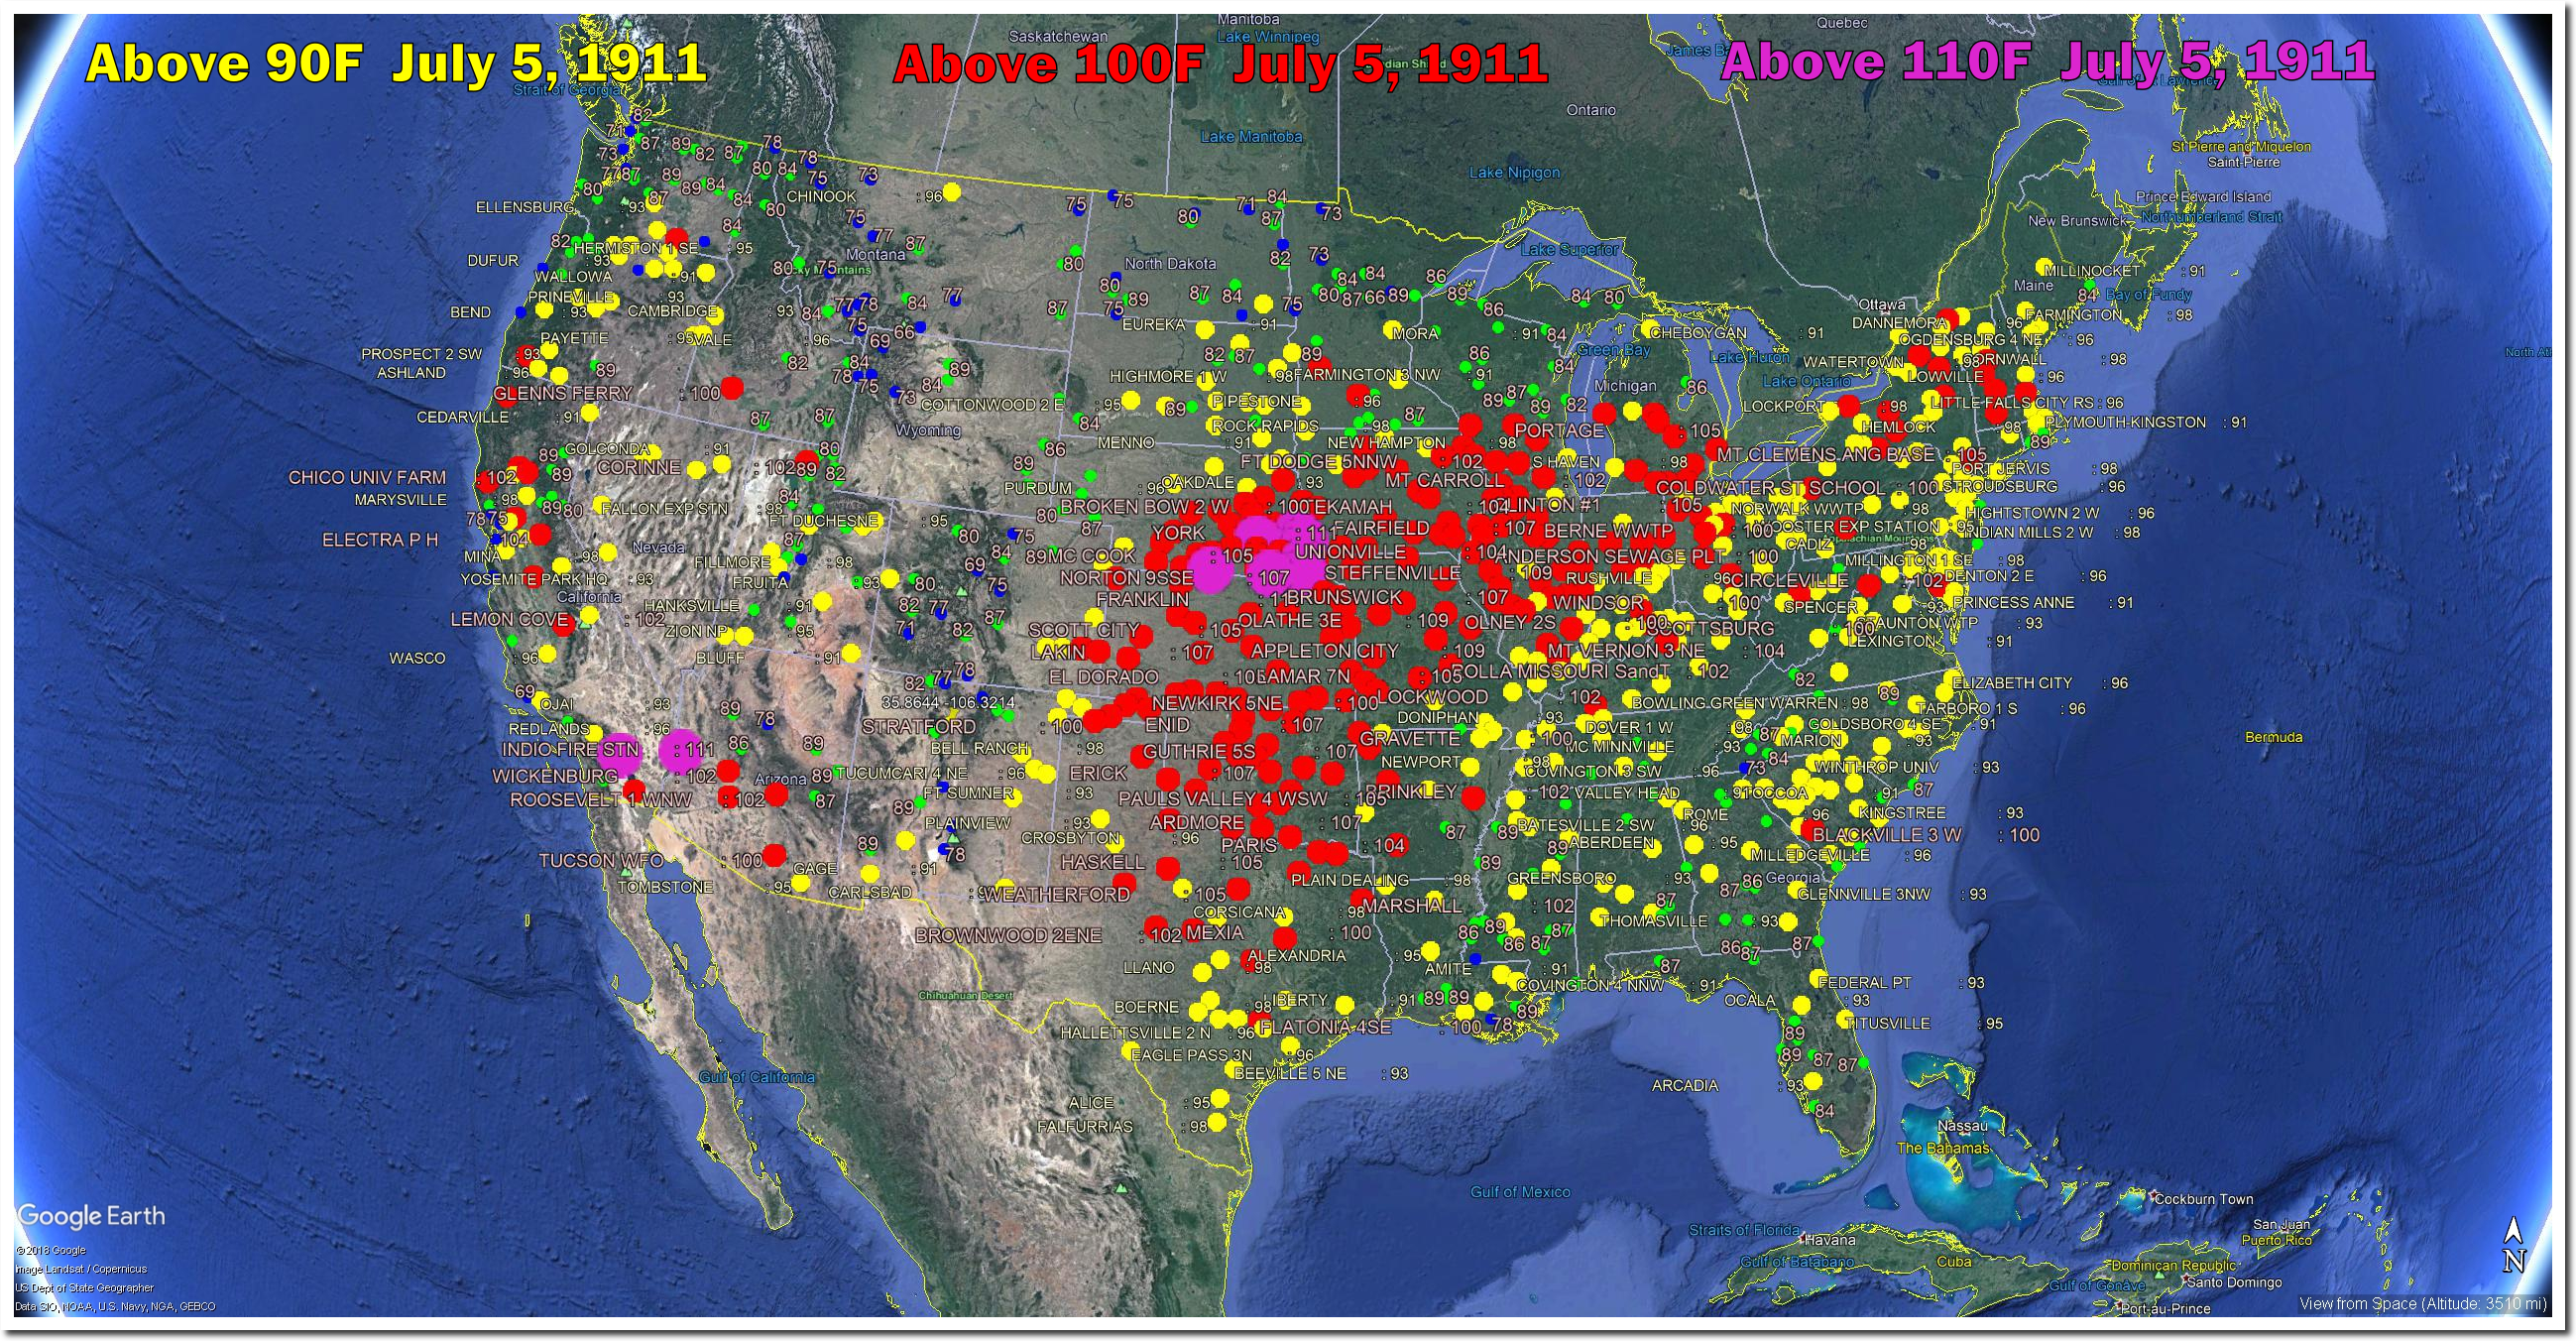
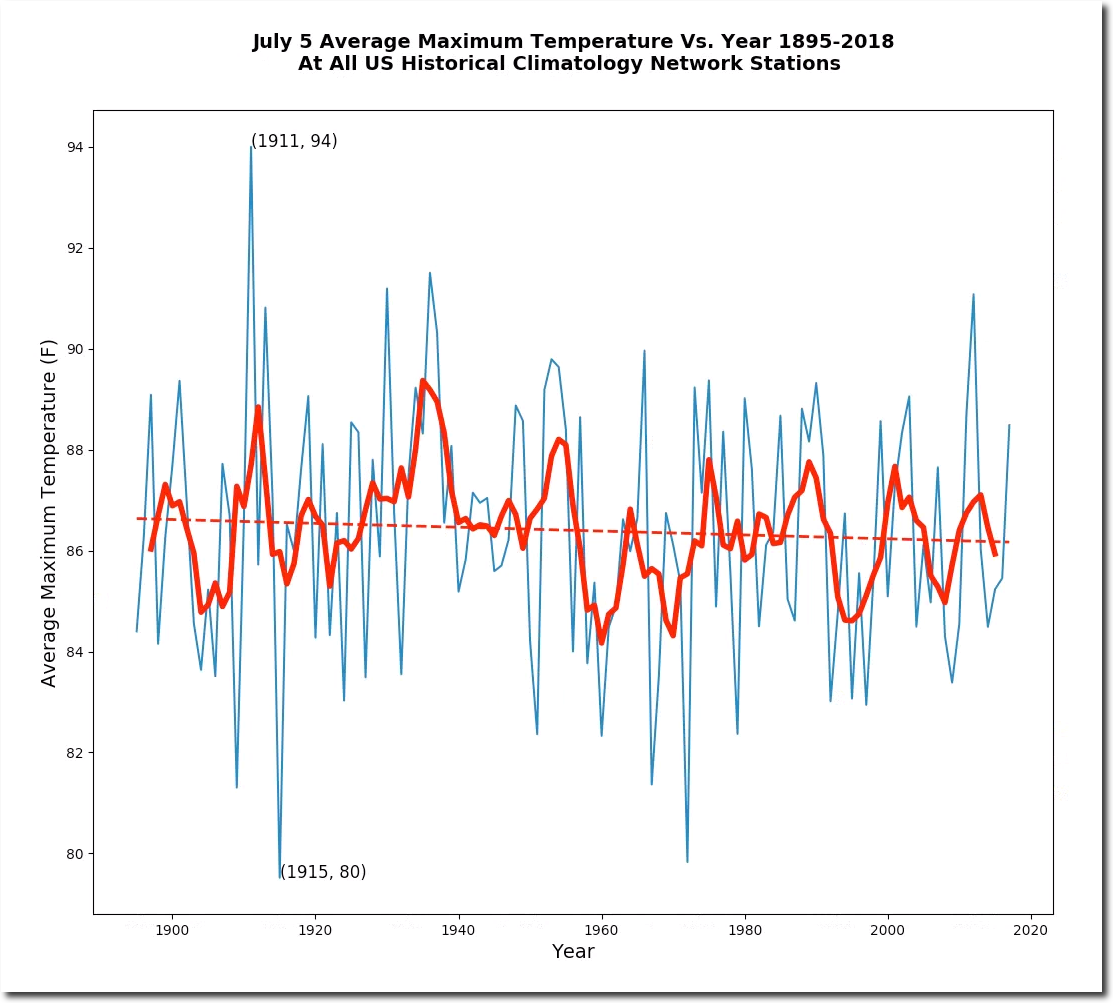
The 1911 heatwave lasted eleven days and killed thousands of New Englanders, many by suicide. It was the worst weather disaster in new England history.
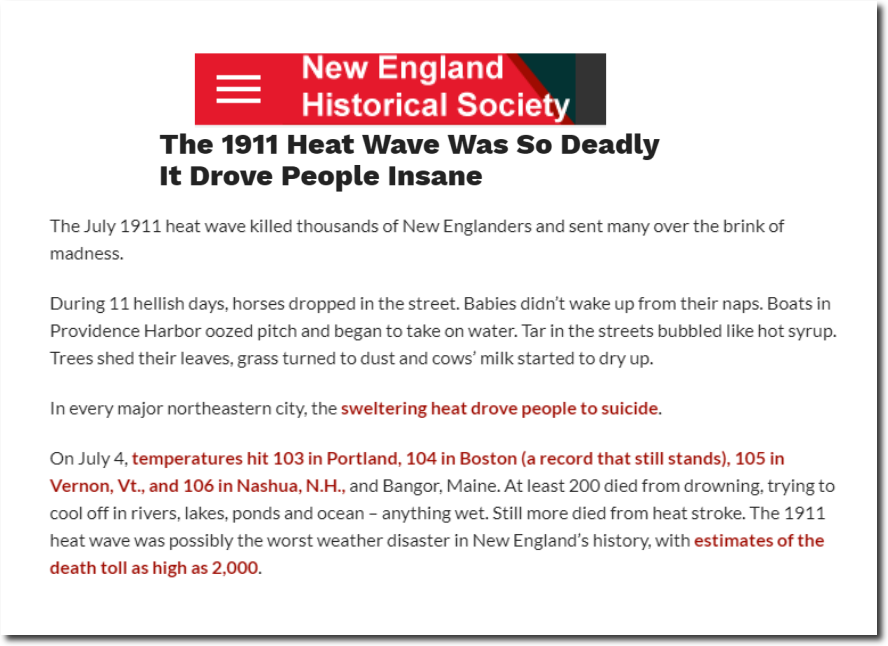
The 1911 Heat Wave Was So Deadly It Drove People Insane – New England Historical Society

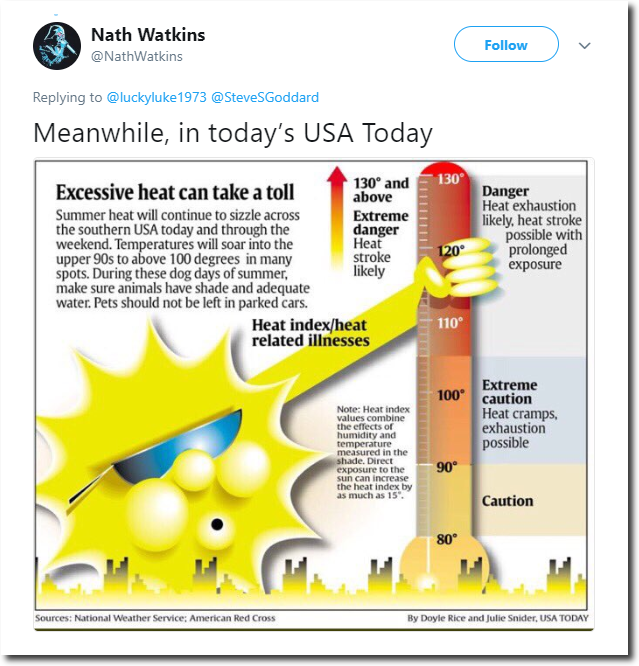
Meanwhile, Drudge continues to pimp the “record heat” fake news.
Posted in Uncategorized | Leave a comment

Climate Science : The Fact, Data and Integrity Free Science

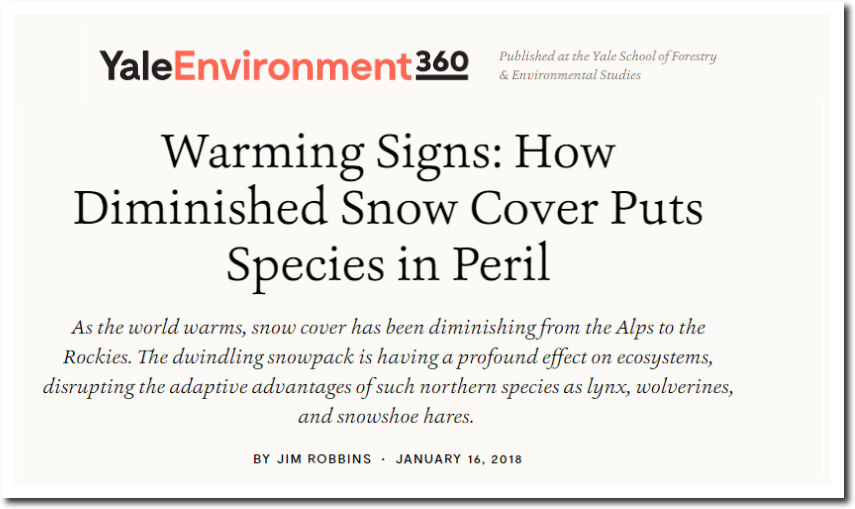
One of the favorite lies of climate scientists is that snow cover is declining, and that it is having a “profound” effect on ecosystems.

Warming Signs: How Diminished Snow Cover Puts Species in Peril – Yale E360

In fact, snow cover has increased sharply over the past 30 years, since CO2 reached 350 PPM.  Northern Hemisphere snow cover has been above long-term mean for most of the last 25 years.

Rutgers University Climate Lab :: Global Snow Lab

Climate science is a “profoundly” fraudulent venture.

Posted in Uncategorized | Leave a comment

Fake Temperature Records At Wikipedia

In order to hide past heat, Wikipedia pulls a couple of dirty tricks.  They report the most recent year a record temperature was reached, instead of the first year. This skews the graph to favor recent UHI affected temperatures, and hides past heat.

U.S. state temperature extremes – Wikipedia

But the real dirty trick is using bogus temperatures.  The official temperature at Pierre, South Dakota on July 15, 2006 was 116 degrees – four degrees cooler than the Wikipedia claimed temperature, and four degrees cooler than the actual South Dakota record heat of 120 degrees on July 5, 1936. There weren’t any USHCN stations in South Dakota close to 120 degrees on July 15, 2006, but there were two on July 5, 1936.

Posted in Uncategorized | Leave a comment

English Ball Watching

England’s front line watching the ball cross in front of the goal.

Brazil’s front line putting the ball in the goal.

Posted in Uncategorized | Leave a comment

Arctic Scam Meltdown Update

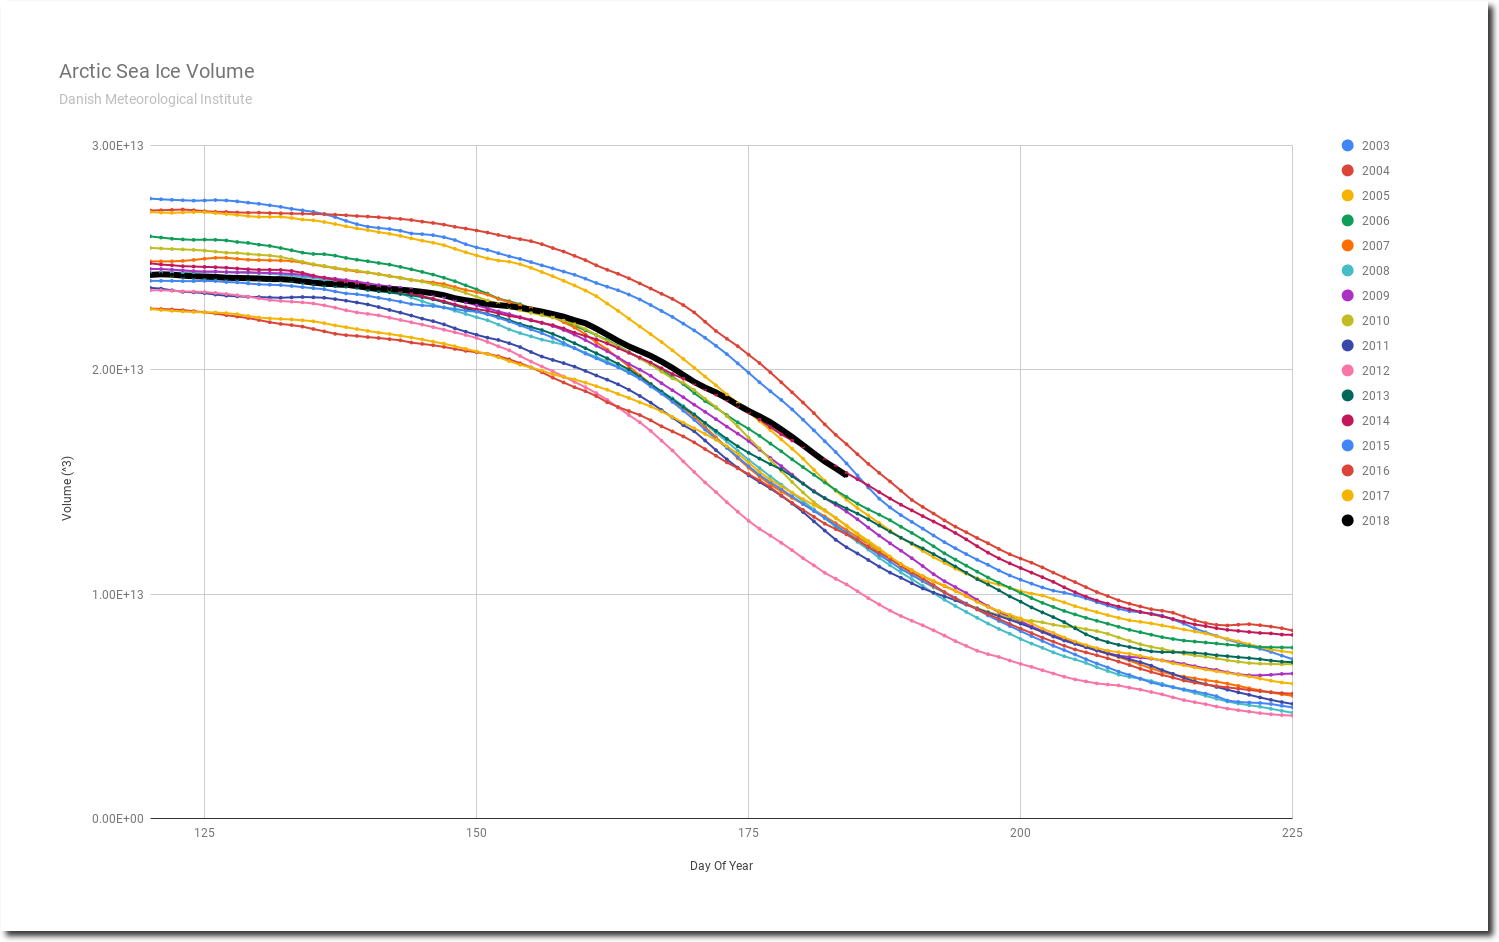
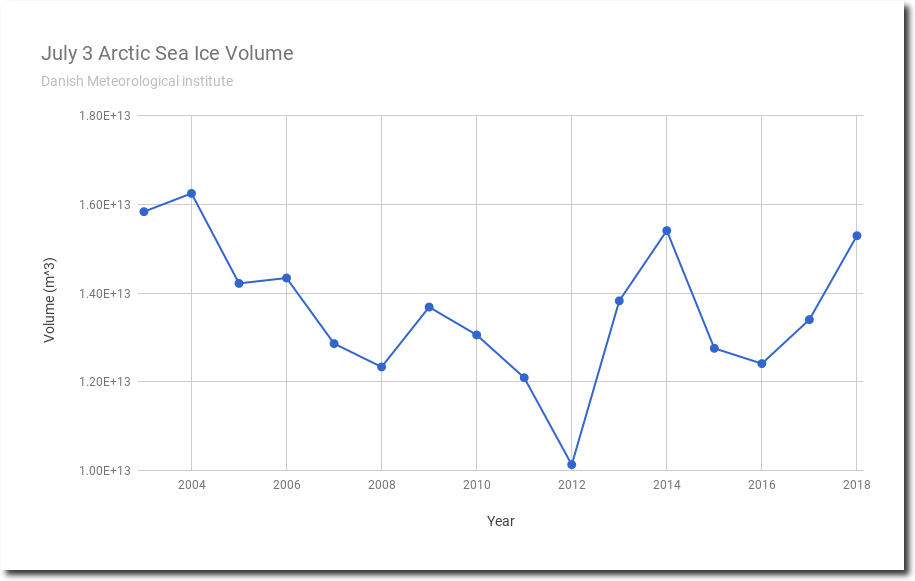
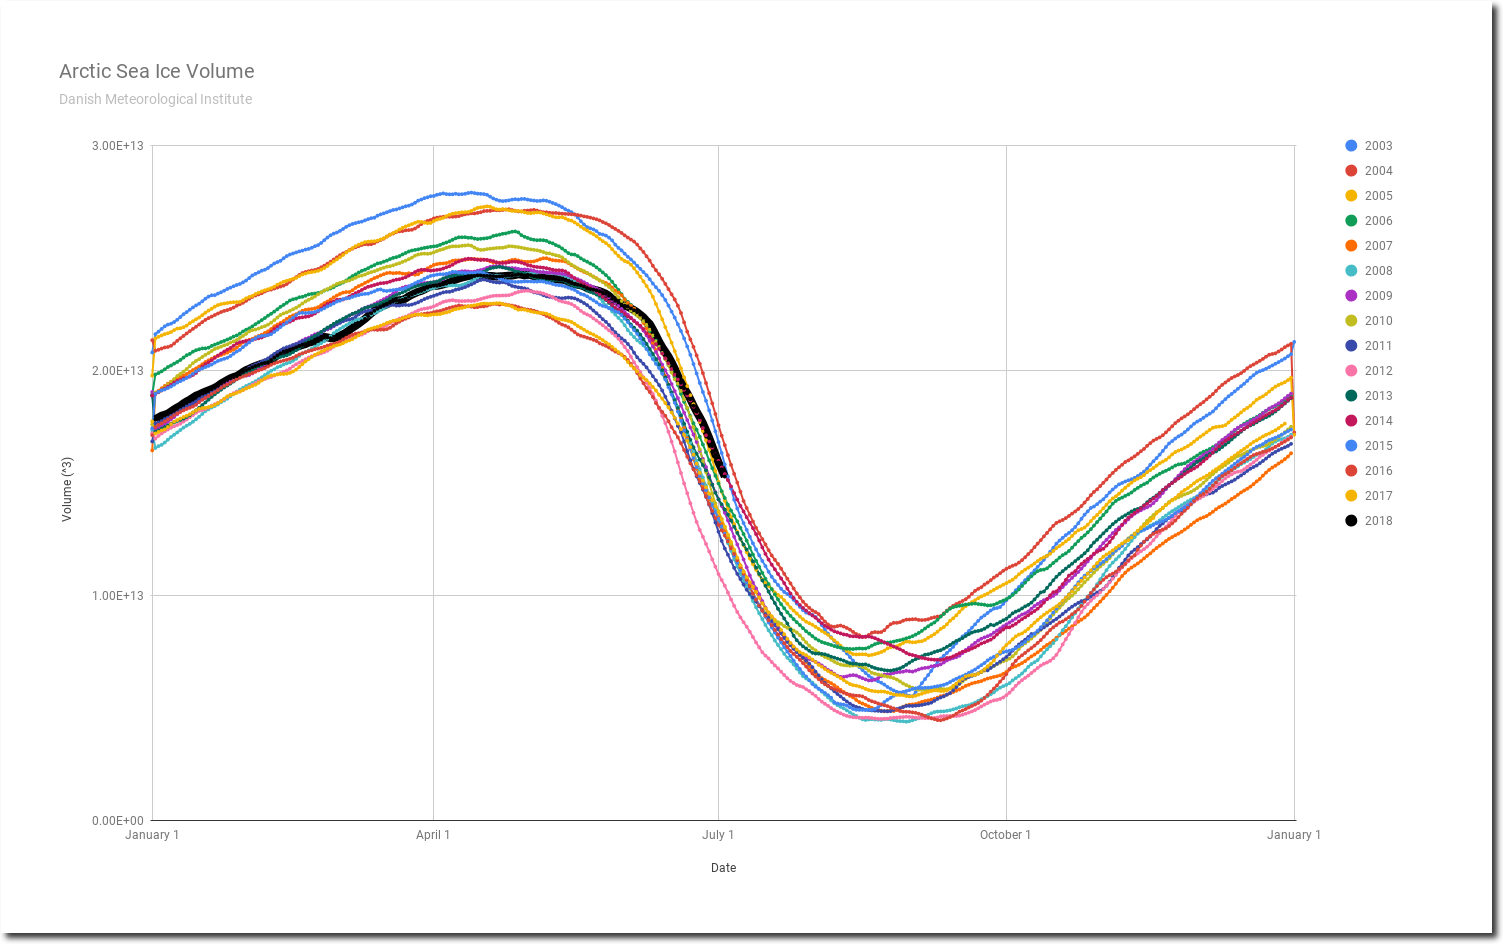
Arctic sea ice volume is fourth highest for the date since 2003, and is about to pass 2003. There are only a few weeks left until the end of the melt season.

Spreadsheet    Data

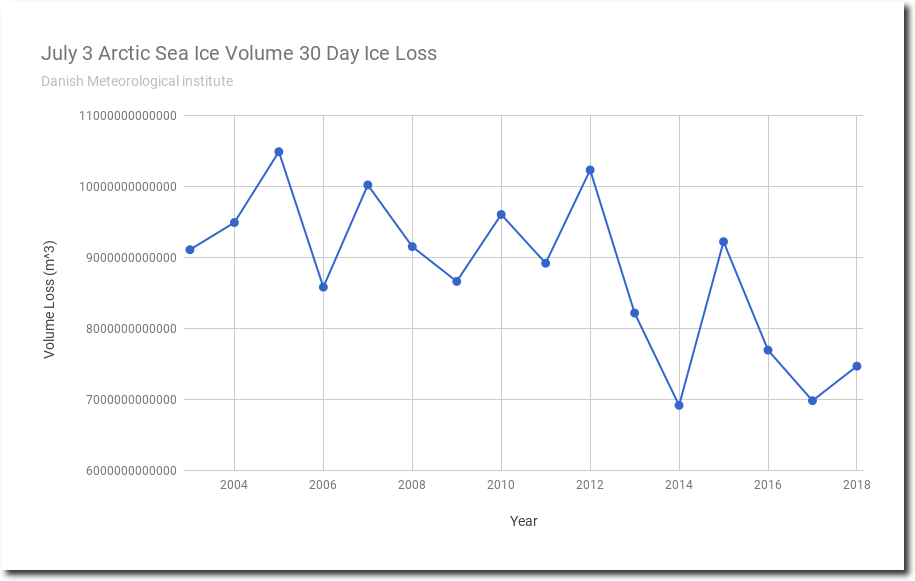
Melt rates have been very slow in recent years.

Spreadsheet    Data

Spreadsheet    Data

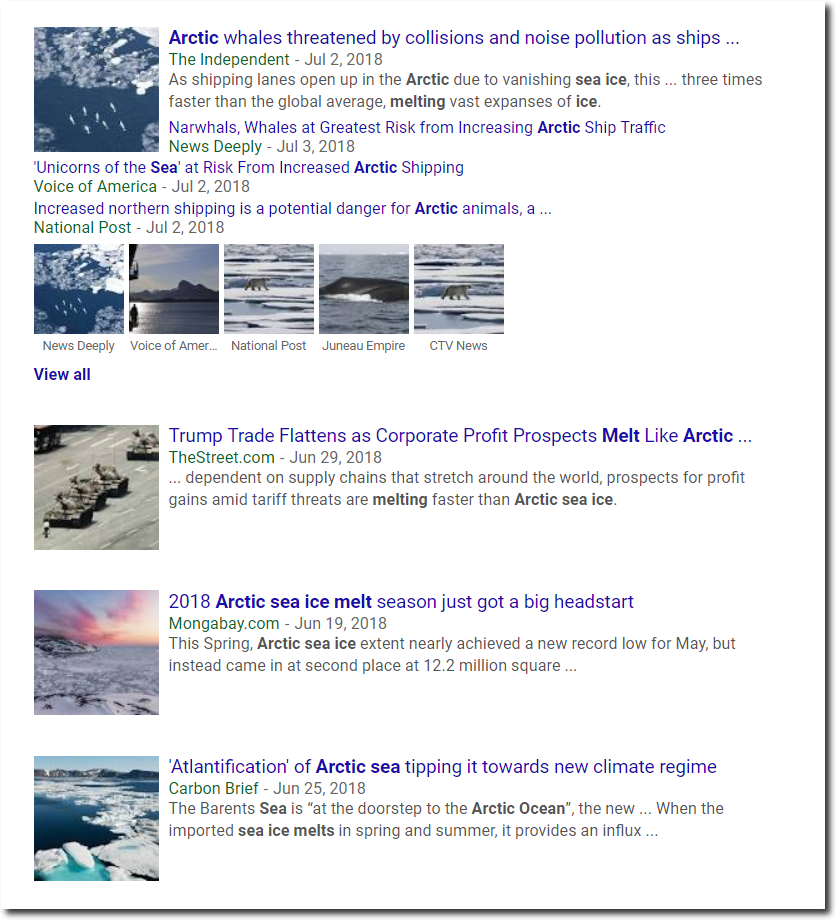
Meanwhile, the usual batch of criminals and liars in the press and scientific community report the exact opposite.

Posted in Uncategorized | Leave a comment

Declining July 4th Temperatures In The US

Republicans believe every day is the Fourth of July, but the Democrats believe every day is April 15.

  • Ronald Reagan

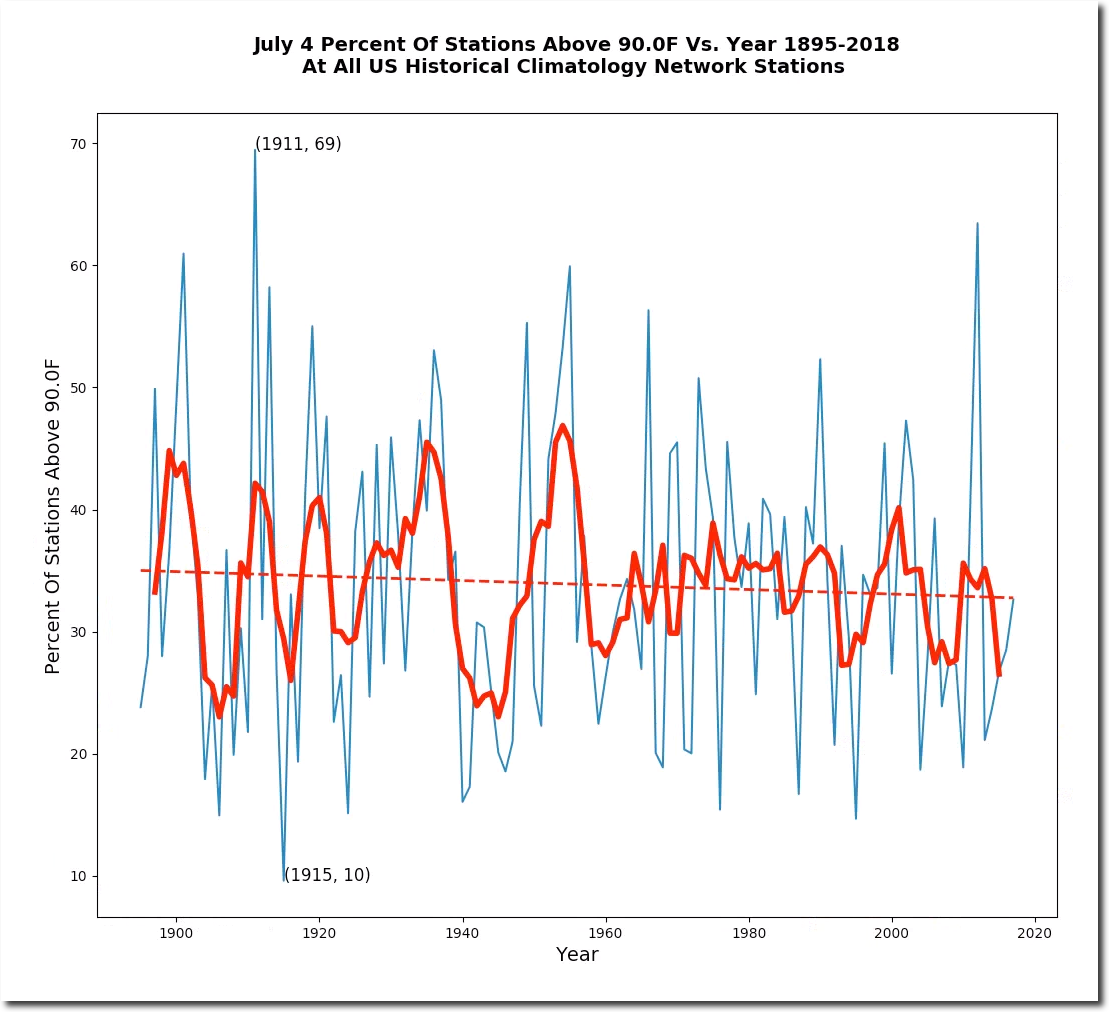
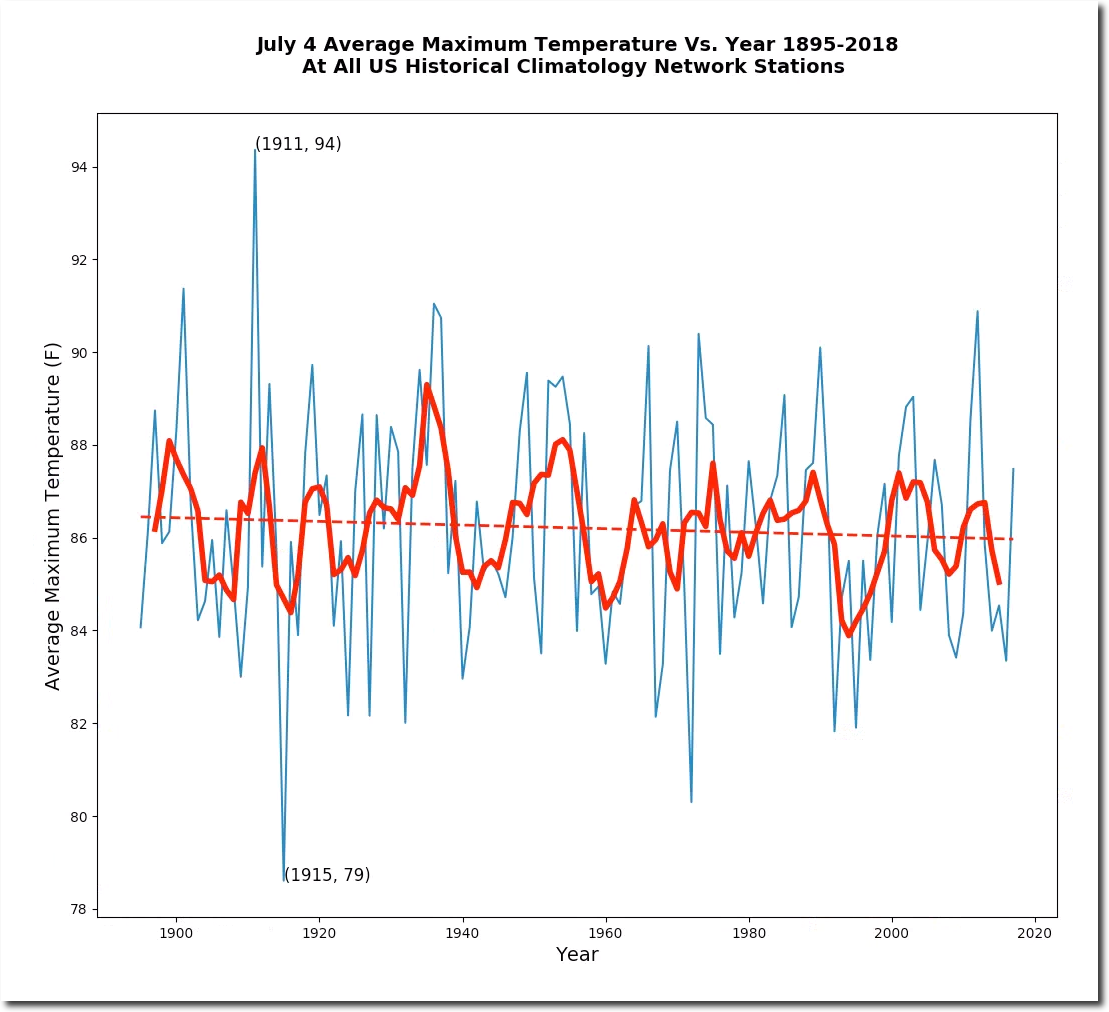
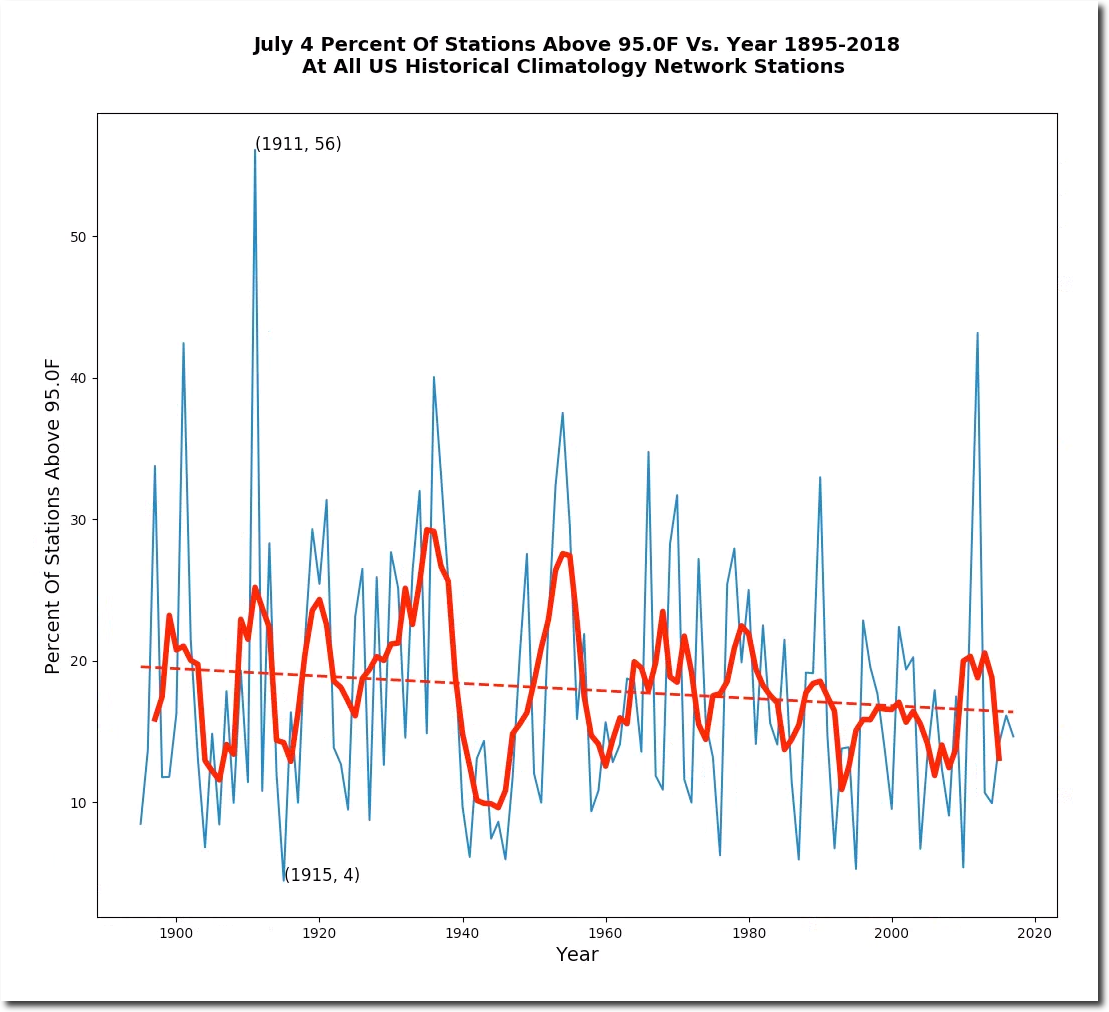
July 4th afternoon temperatures have been declining in the US since the 19th century.  The hottest July 4th occurred in 1911, and the coolest occurred in 1915, back when James Hansen said the climate was stable.

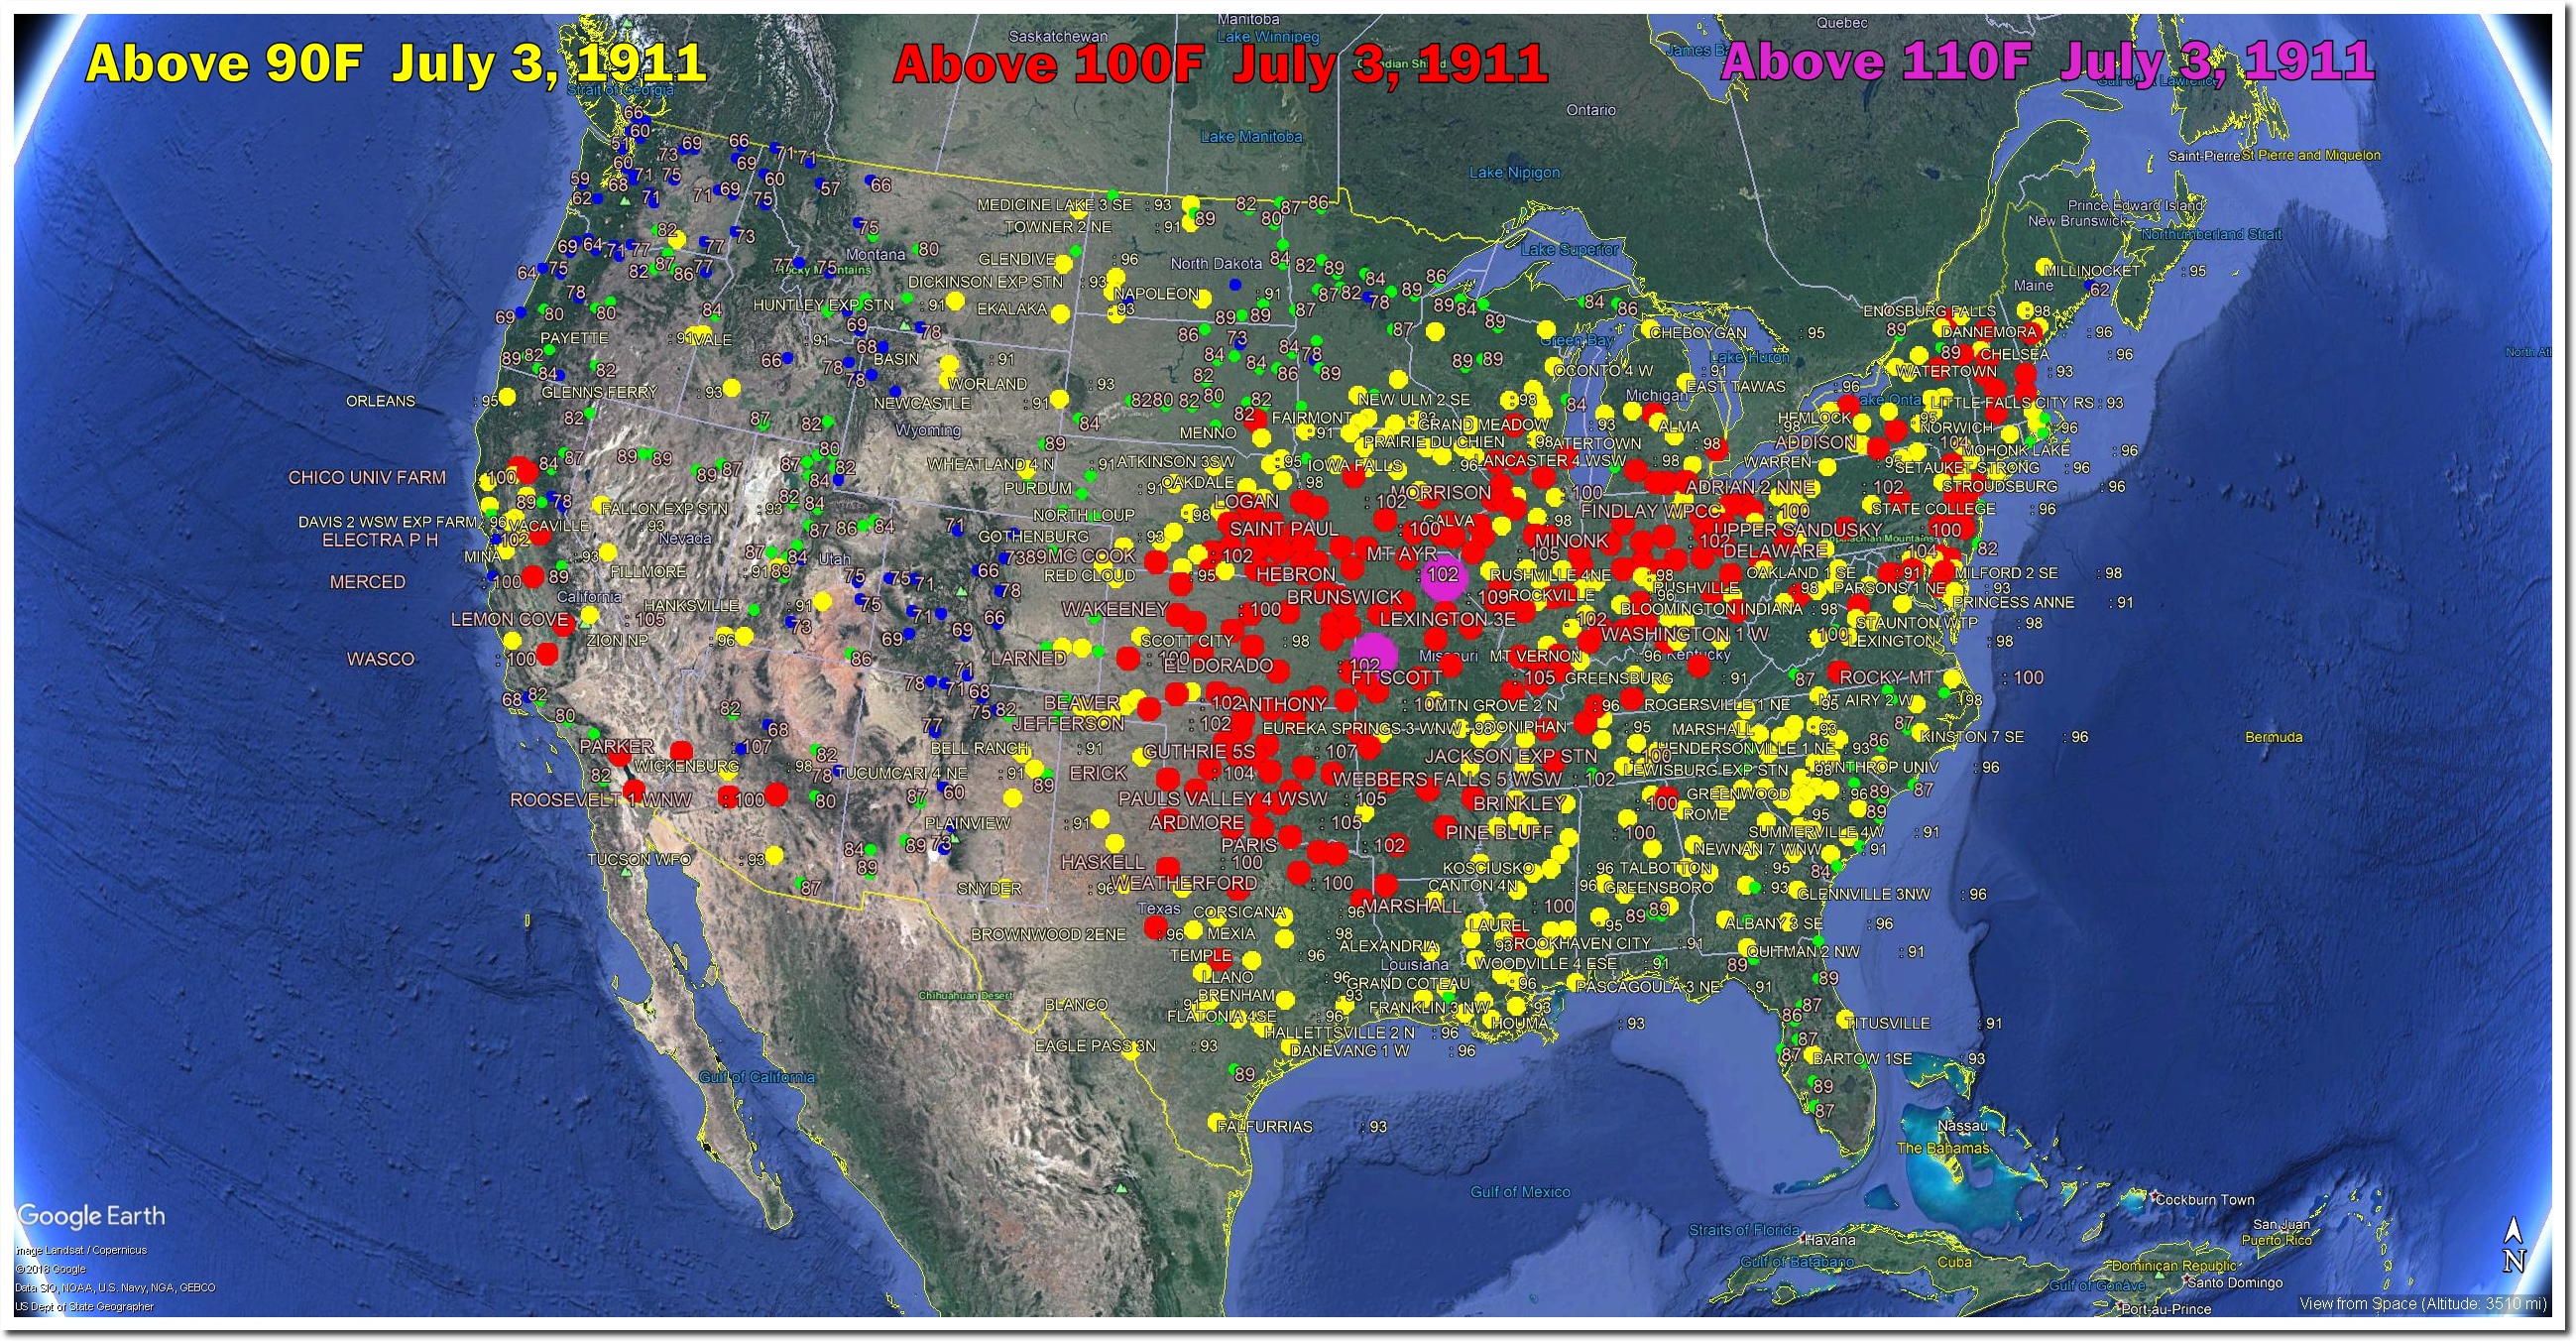
On July 4th, 1911 there were 100 degree temperatures from California to Maine.

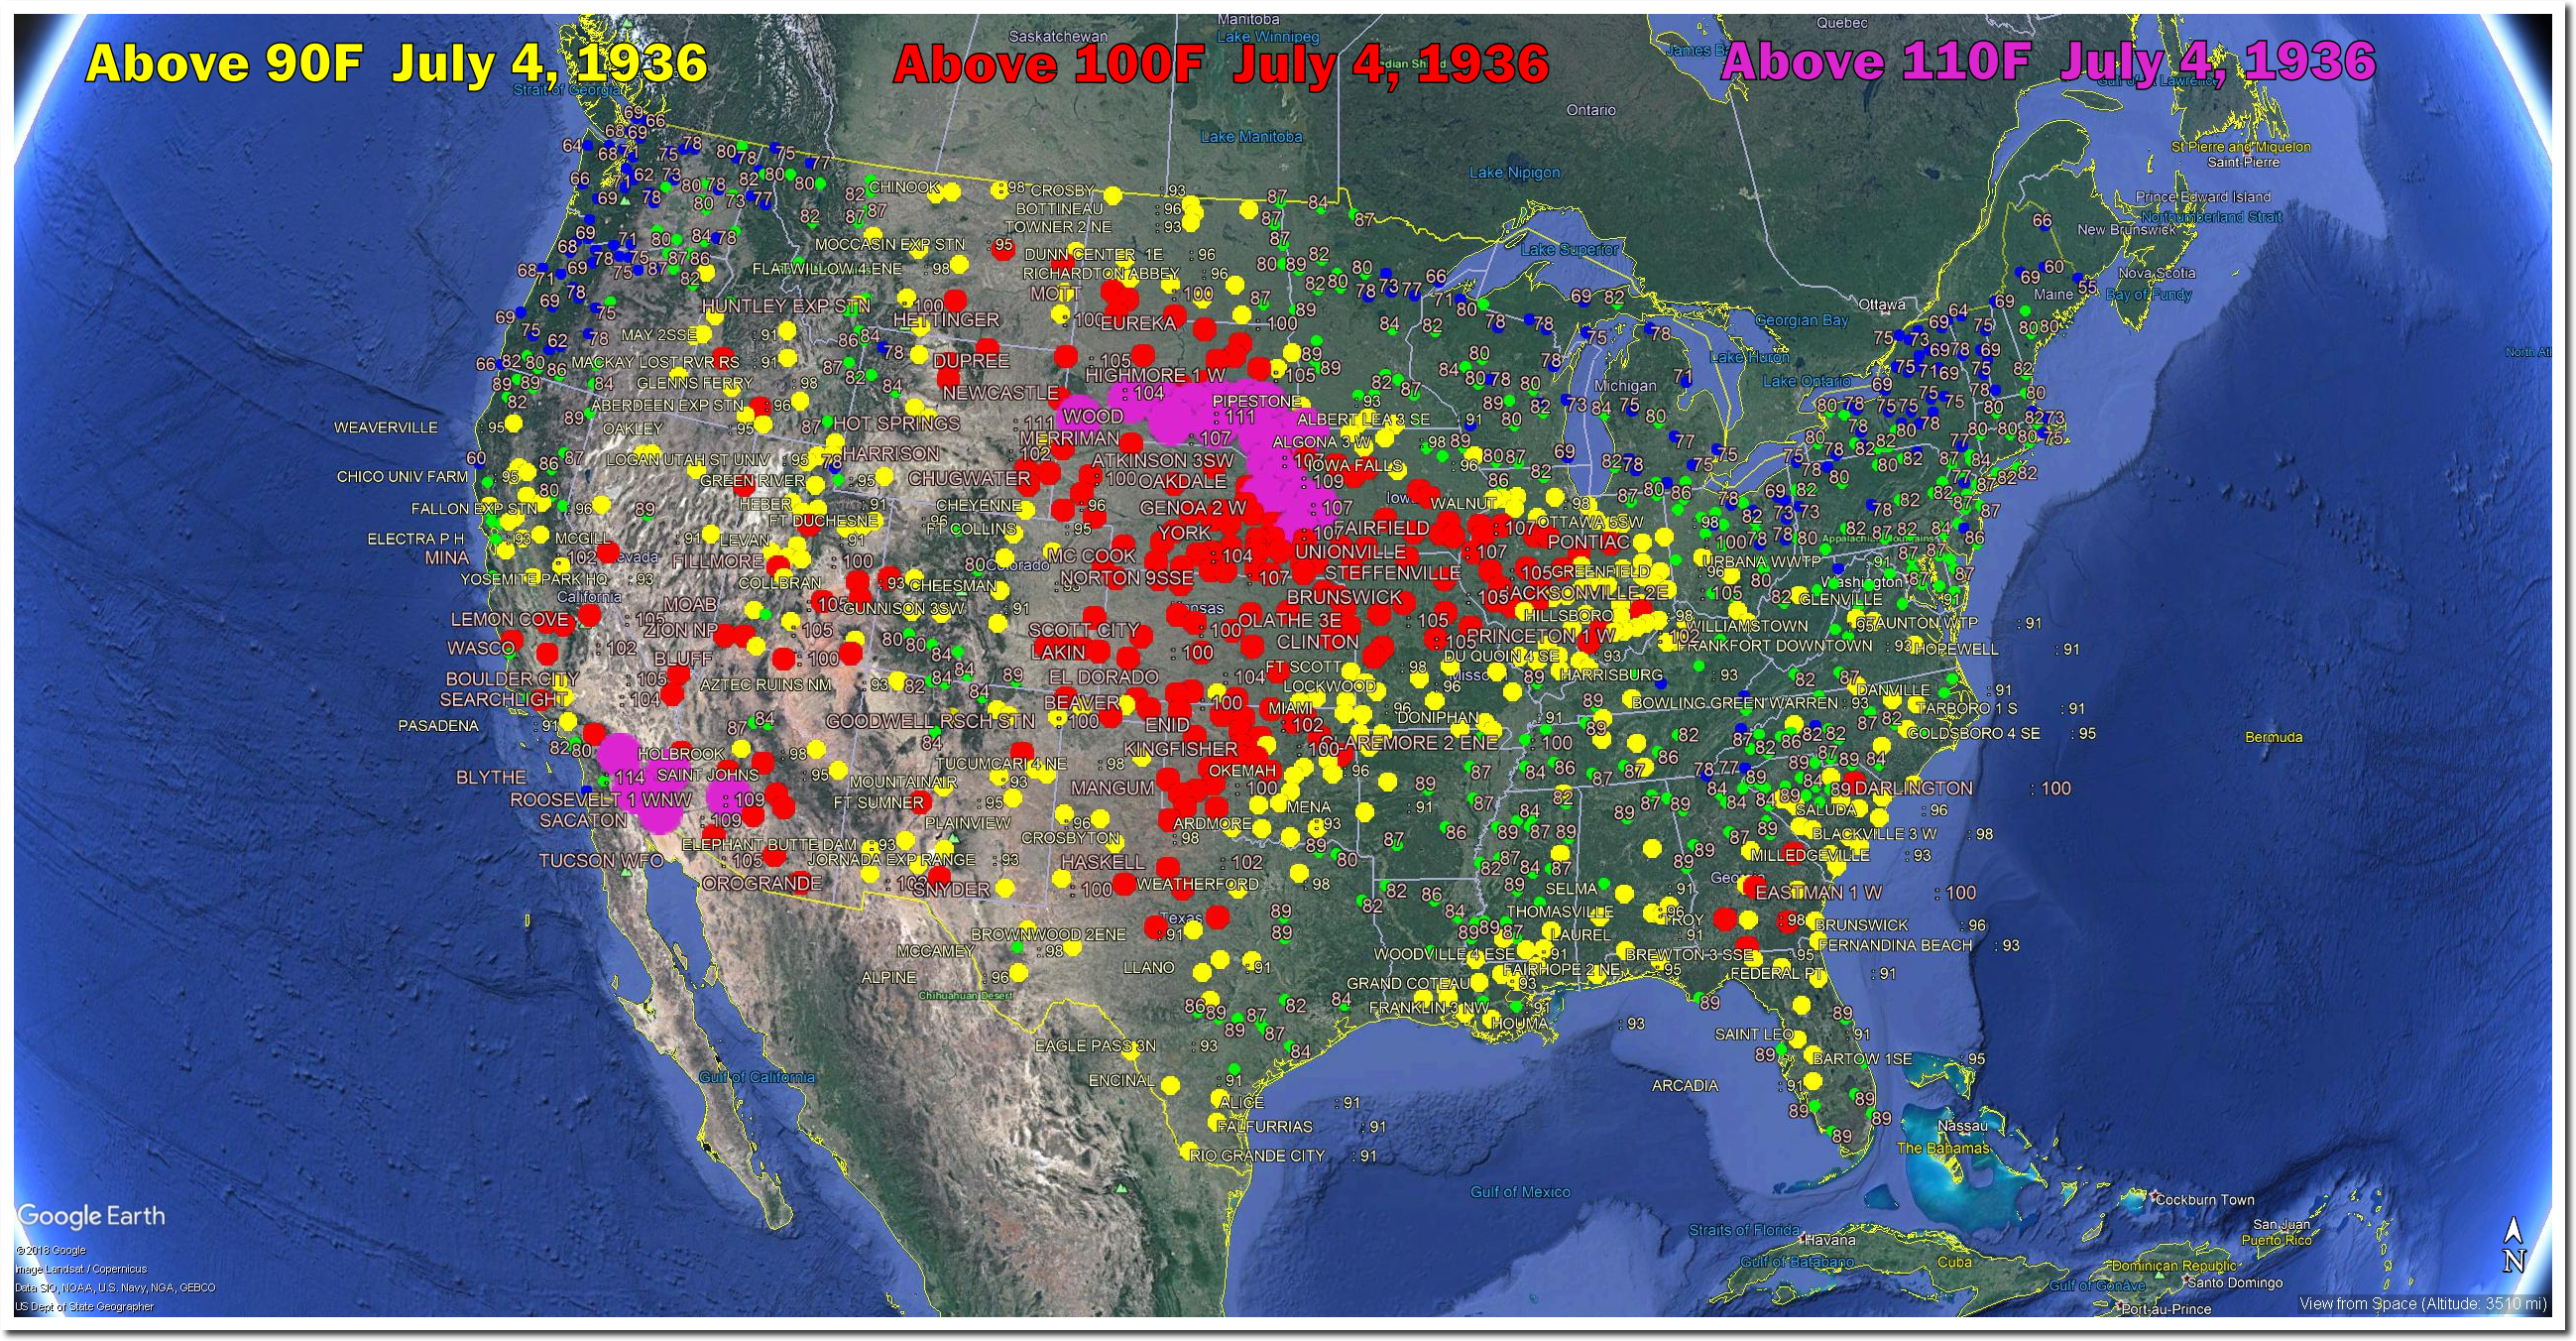
On July 4th, 1936 the heat wasn’t as widespread, but there was a large area of 110 degree temperatures in the Great Plains.

Posted in Uncategorized | Leave a comment

Greenland Continues To Gain Ice

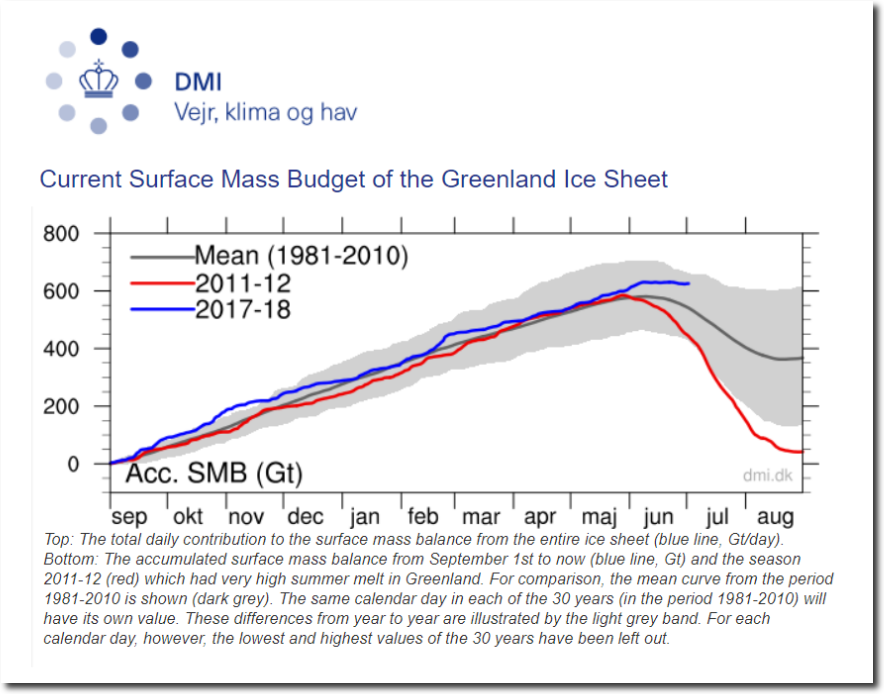
With only 30 days left to the Greenland melt season, it hasn’t started yet. Yet another catastrophe for climate alarmists.

Greenland Ice Sheet Surface Mass Budget: DMI

This is the second year in a row which there has been a large increase in ice.

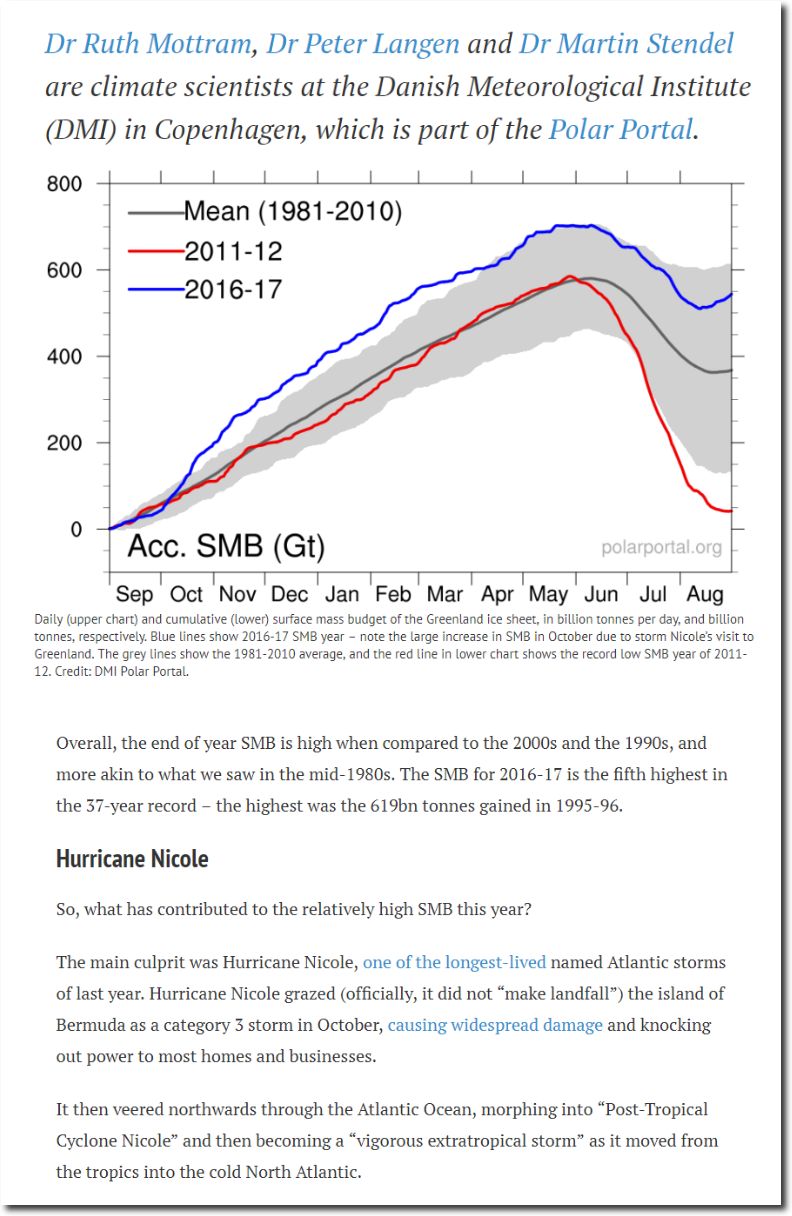
Guest post: How the Greenland ice sheet fared in 2017 | Carbon Brief

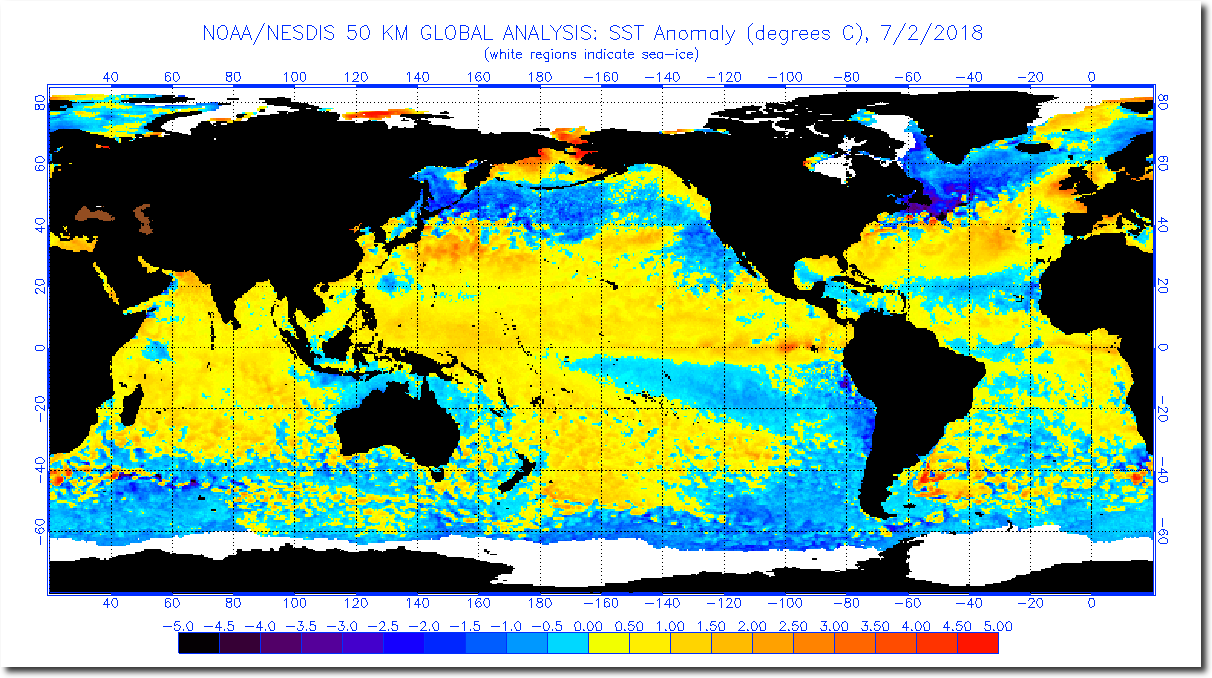
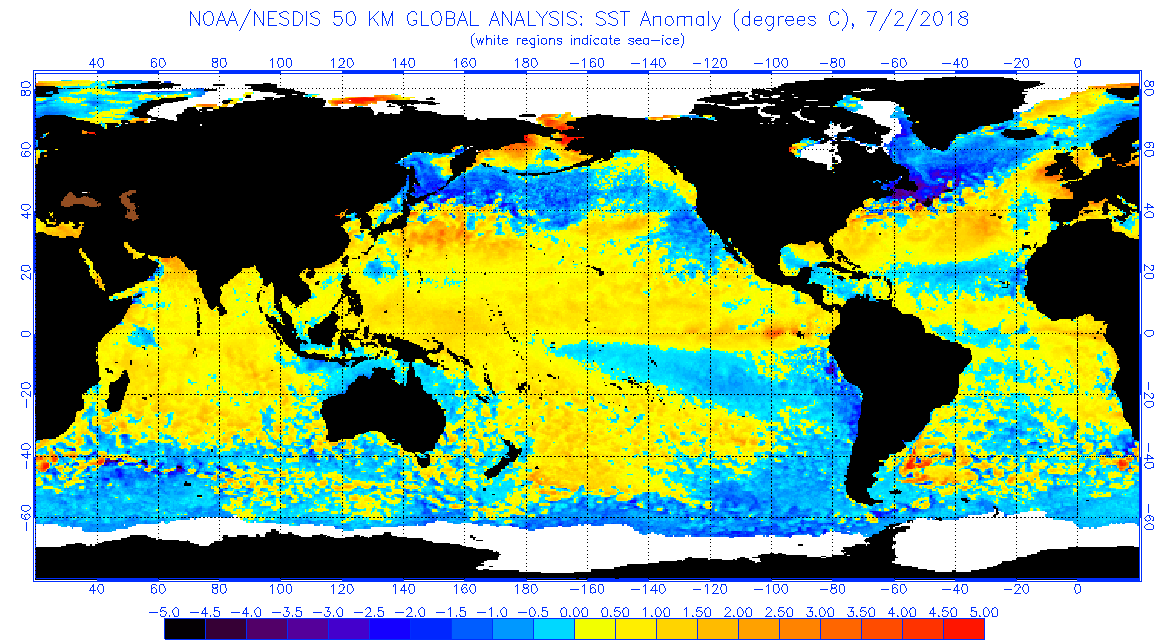
Last year, DMI scientists tried blaming it on Hurricane Nicole, but there wasn’t any hurricane this year. Sea surface temperatures around Greenland are running very cold.

anomnight.7.2.2018.gif (1174×640)

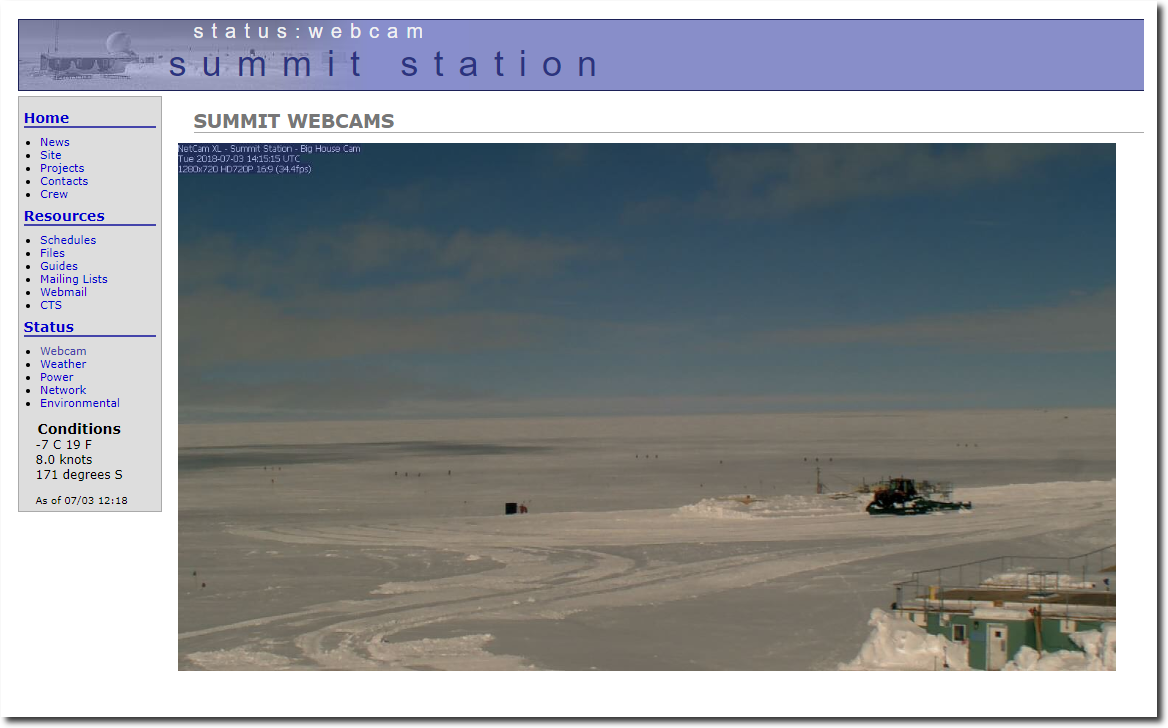
This is the hottest week of the year on the ice sheet, and temperatures are well below freezing.

summit:status:webcam

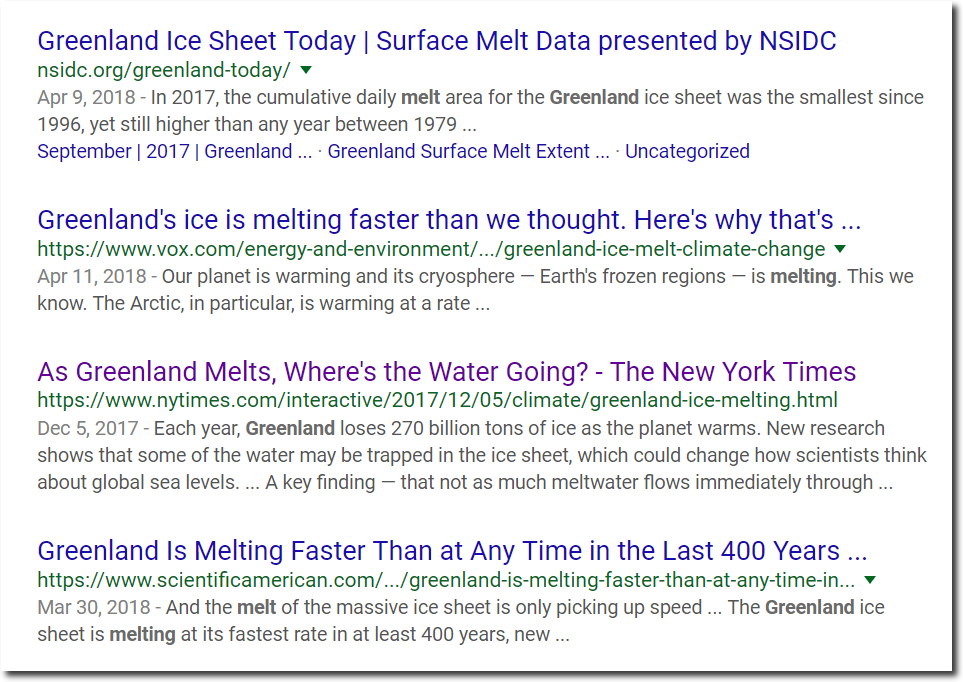
As Greenland gains mass, climate scientists and the press ramp up their lies to rather spectacular levels – claiming the exact opposite of what is occurring.

Posted in Uncategorized | Leave a comment

Understanding Climate Science

Finally, an illustration which accurately depicts the state of climate science.

Posted in Uncategorized | Leave a comment

Plummeting Summer Temperatures In The US

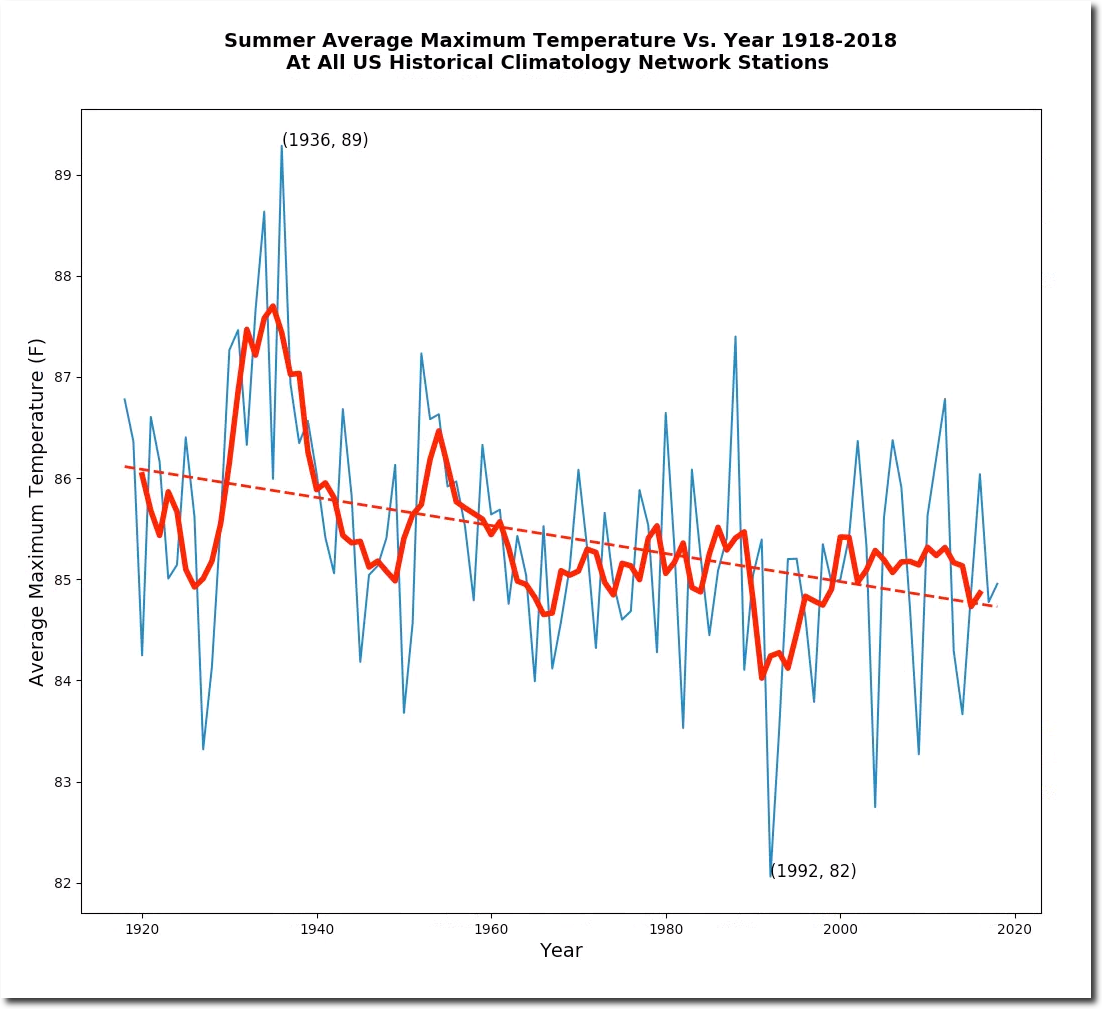
With the arrival of summer, climate snake oil salesmen are up to their usual tactics of lying about the weather. Summer maximum temperatures and the frequency of hot days have plummeted in the US over the past century.

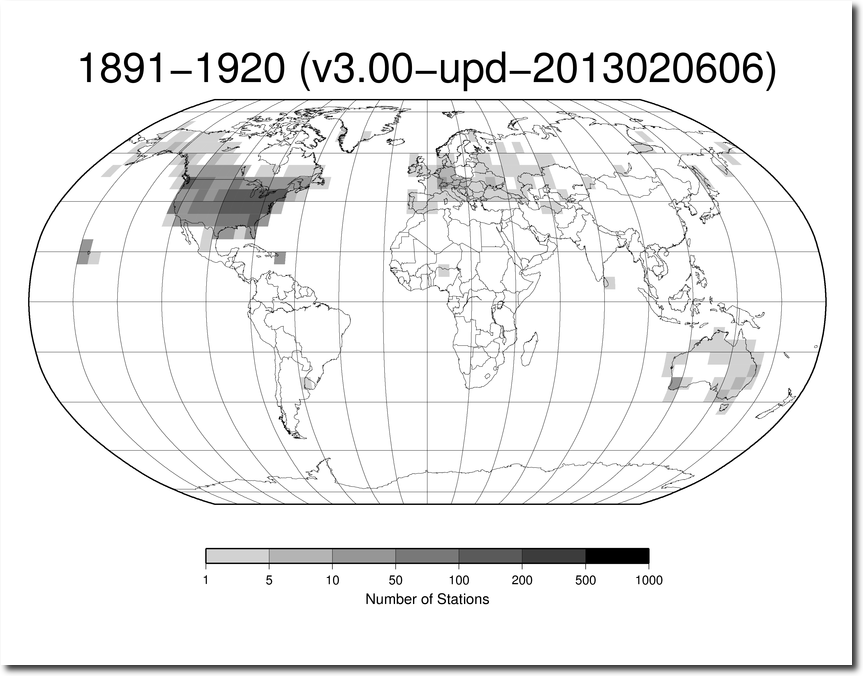
After accepting this, climate fraudsters complain that the US is only 2% of the planet – but it is the only large region of earth where you can do this sort of analysis. Data from the rest of the world is generally close to useless.

station-counts-1891-1920-temp.png (825×638)

During the week of July 3 to July 10, 1936 – afternoon temperatures at Cottonwood, South Dakota averaged a mind boggling 111 degrees, topping out at 117 degrees on July 5, 1936.

Posted in Uncategorized | Leave a comment

Declining July 3rd Temperatures In The US

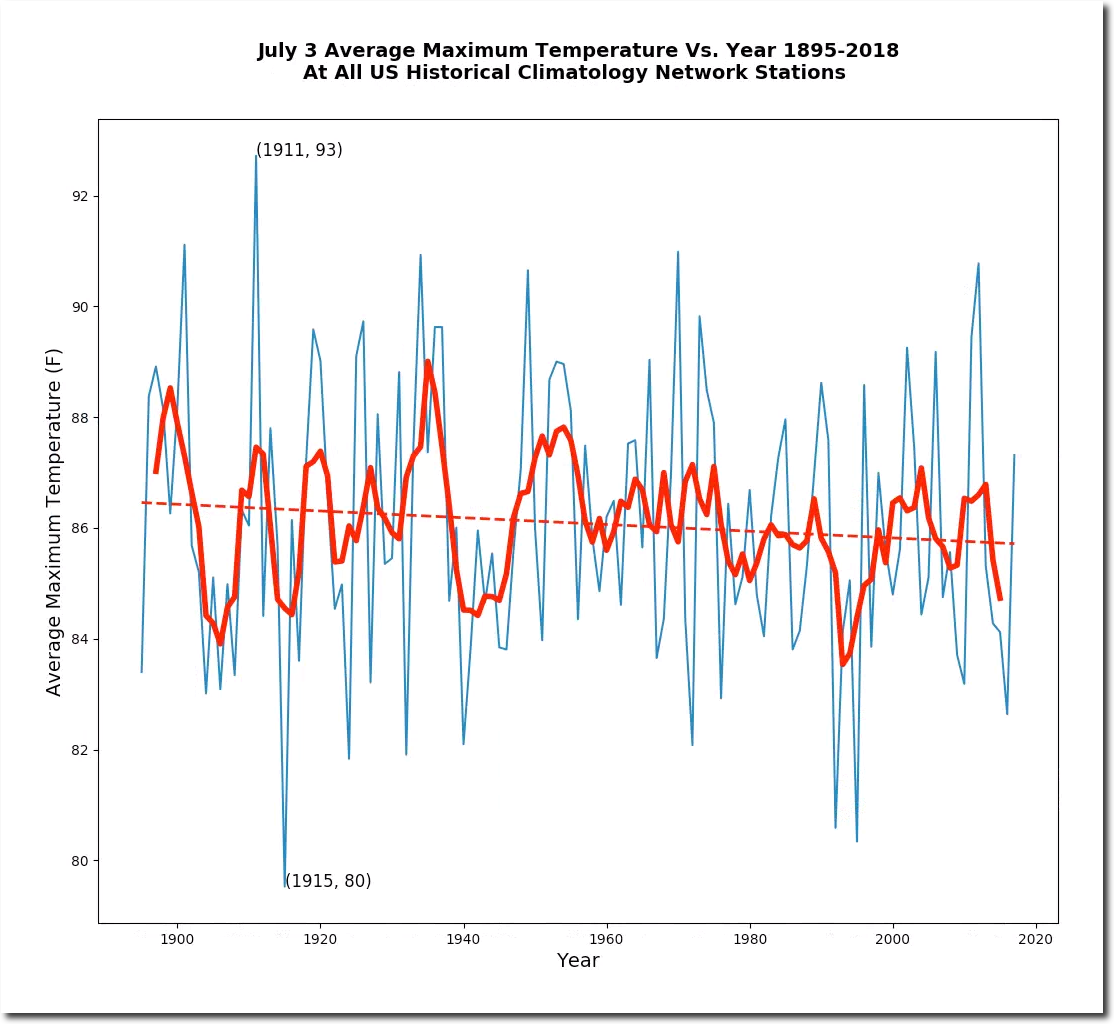
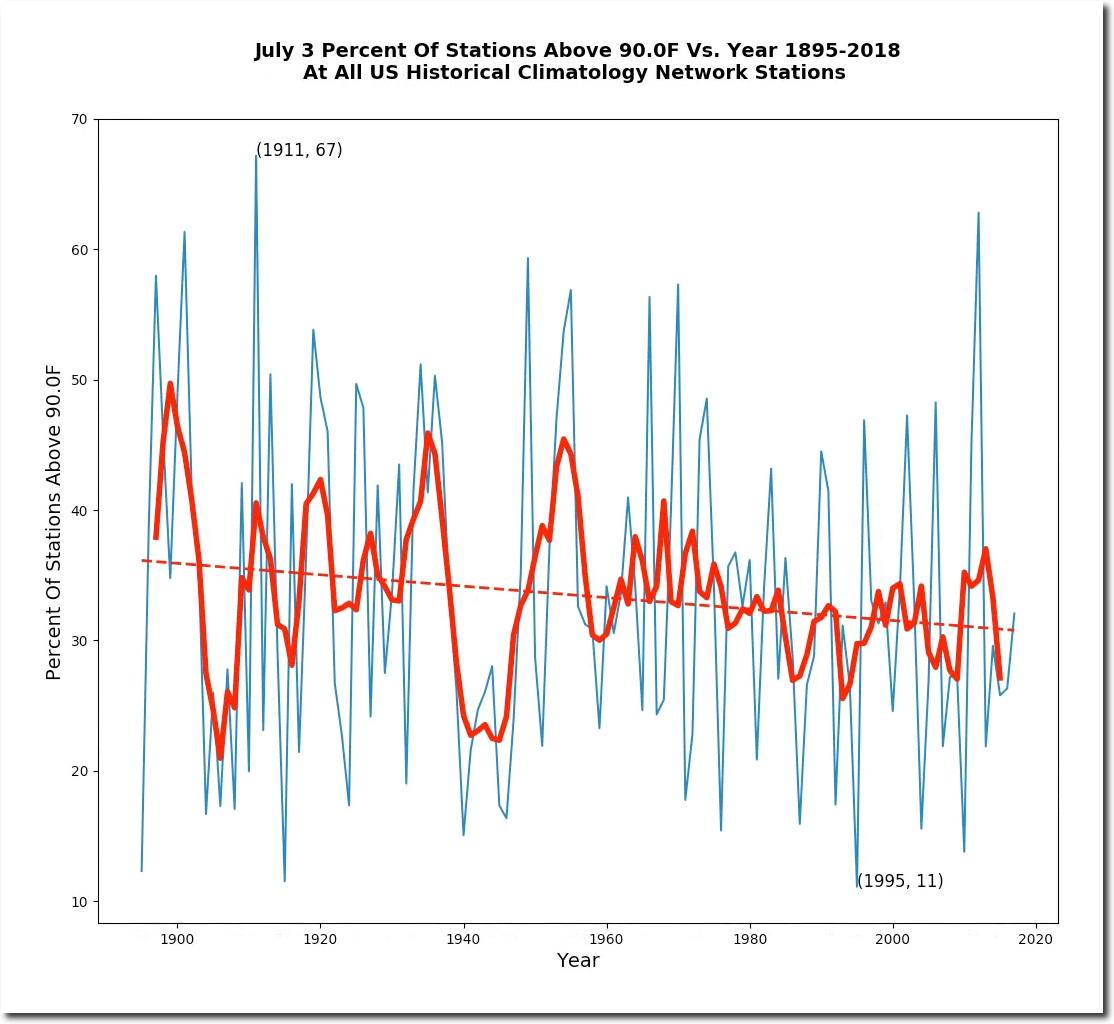
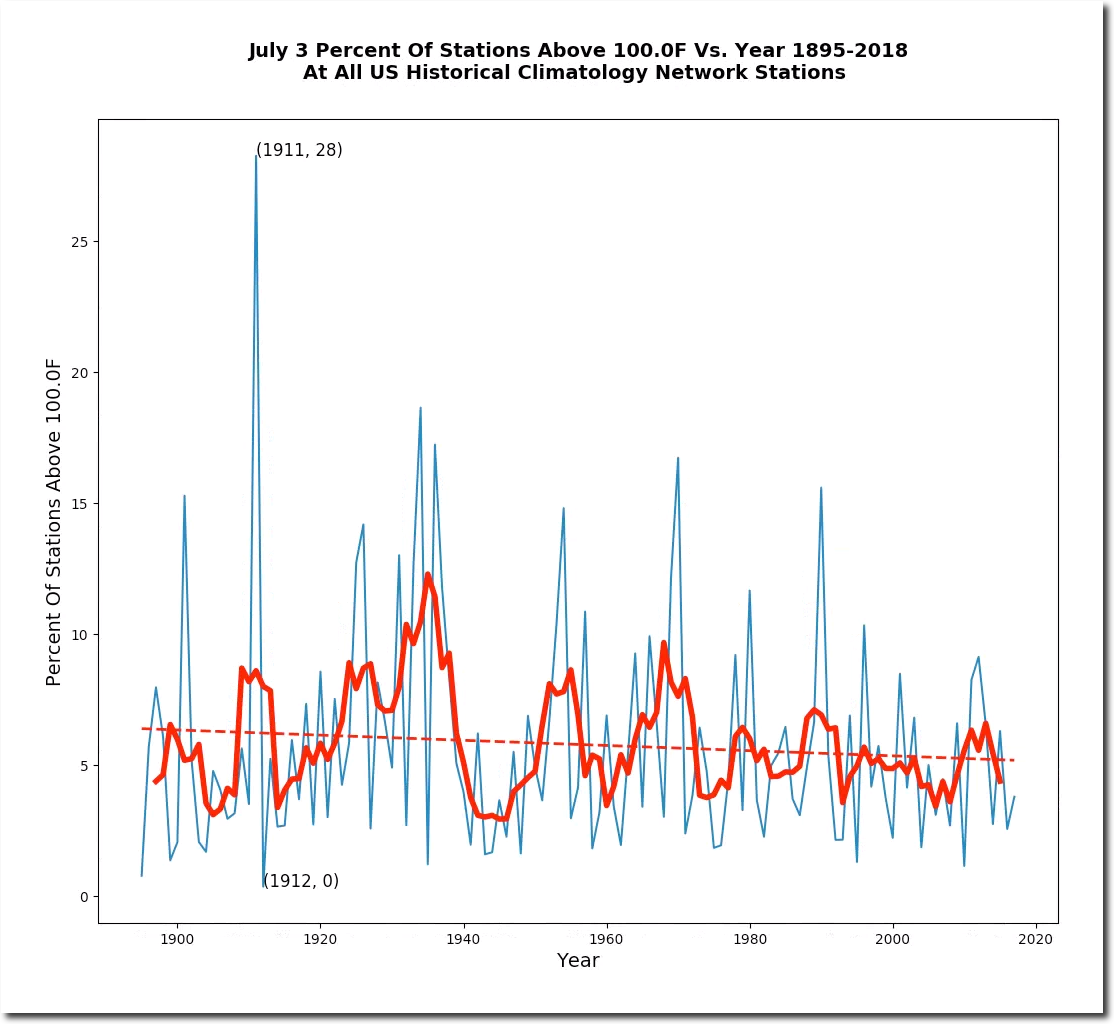
July 3rd afternoon temperatures have been declining in the US since the 19th century, and likelihood of hot weather has declined.

On this date in 1911, almost 30% of the US was over 100F – with one hundred degree temperatures stretching from California to Maine. Missouri had temperatures over 110 degrees, Iowa 109 degrees, and New York 104 degrees.

Posted in Uncategorized | Leave a comment