Disrupting the Borg is expensive and time consuming!
Google Search
-
Recent Posts
- Vandalism At The Reflecting Pool
- Fifty Years Ago Today
- Truth Or Consequences
- US Climate Trend Maps
- Declining Spring Snow Cover In Northern New Mexico
- You Can’t Fool Mother Nature
- Cattle And The Climate
- One Atomic Bomb Per Hour
- New Video : Analyzing Oil And Gas
- Is Antarctica Melting?
- High Speed Analysis And Visualization
- El Nino To The Rescue?
- Fake News Update
- Growth Of Antarctic Sea Ice
- 65 Years Of Progress!
- El Nino To The Rescue?
- Worst March Drought On Record
- ChartGL Process Control Demo
- The Biggest Money Laundering Scam
- Drought In The Headwaters Of Lake Powell
- Unrealistic Expectations Of Water Availability
- Did Bill Gates Do This?
- Worst March Drought On Record In The US
- The Real Hockey Stick Graph
- Analyzing The Western Water Crisis
August 2026 M T W T F S S 1 2 3 4 5 6 7 8 9 10 11 12 13 14 15 16 17 18 19 20 21 22 23 24 25 26 27 28 29 30 31 Recent Comments
- Chuck on Truth Or Consequences
- Gerald Machnee on Fifty Years Ago Today
- conrad ziefle on Fifty Years Ago Today
- Bob G on Truth Or Consequences
- Weylan McAnally on One Atomic Bomb Per Hour
- conrad ziefle on Declining Spring Snow Cover In Northern New Mexico
- Bob G on You Can’t Fool Mother Nature
- Ivan G Wainwright on You Can’t Fool Mother Nature
- conrad ziefle on You Can’t Fool Mother Nature
- Bob G on You Can’t Fool Mother Nature
Rescuing Polar Bears
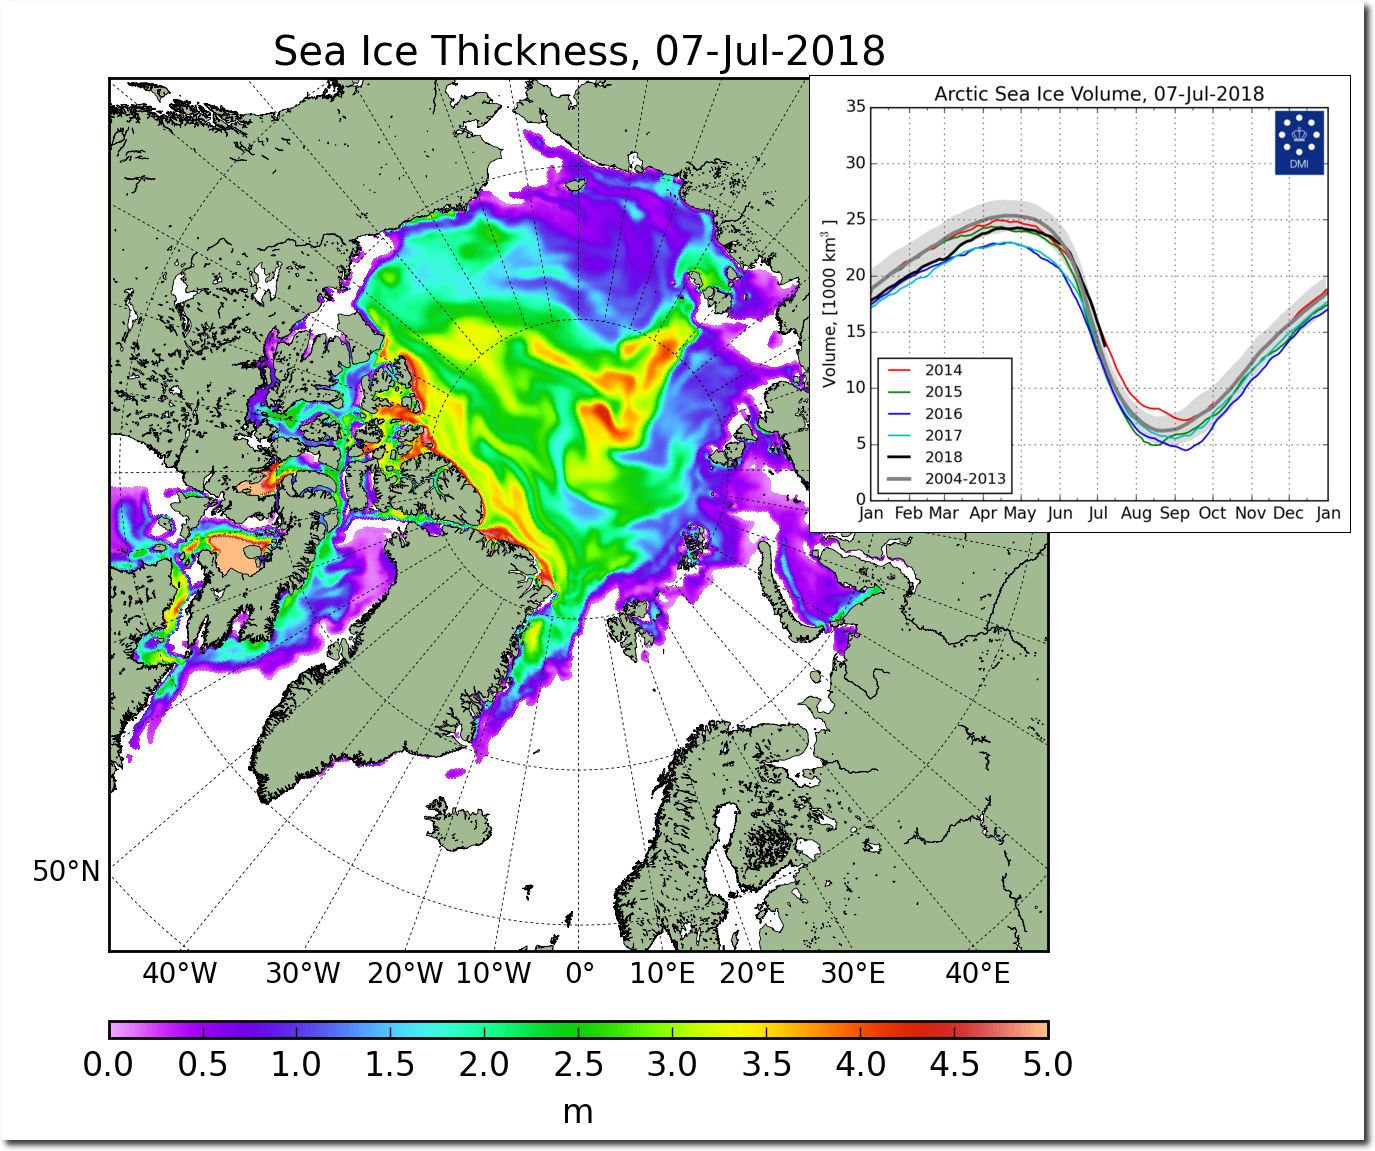
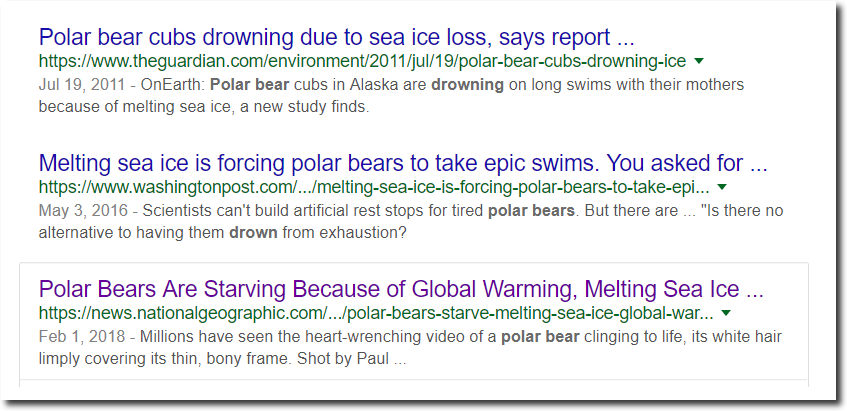
With all this thick ice in the Arctic, Polar bears are having a difficult time finding places to drown.
FullSize_CICE_combine_thick_SM_EN_20180707.png (1337×1113)
Reality is no impediment to climate scientists, who will say whatever lies are necessary to keep funding coming in.
Posted in Uncategorized
Leave a comment
Record Summer Maximums Near A Record Low
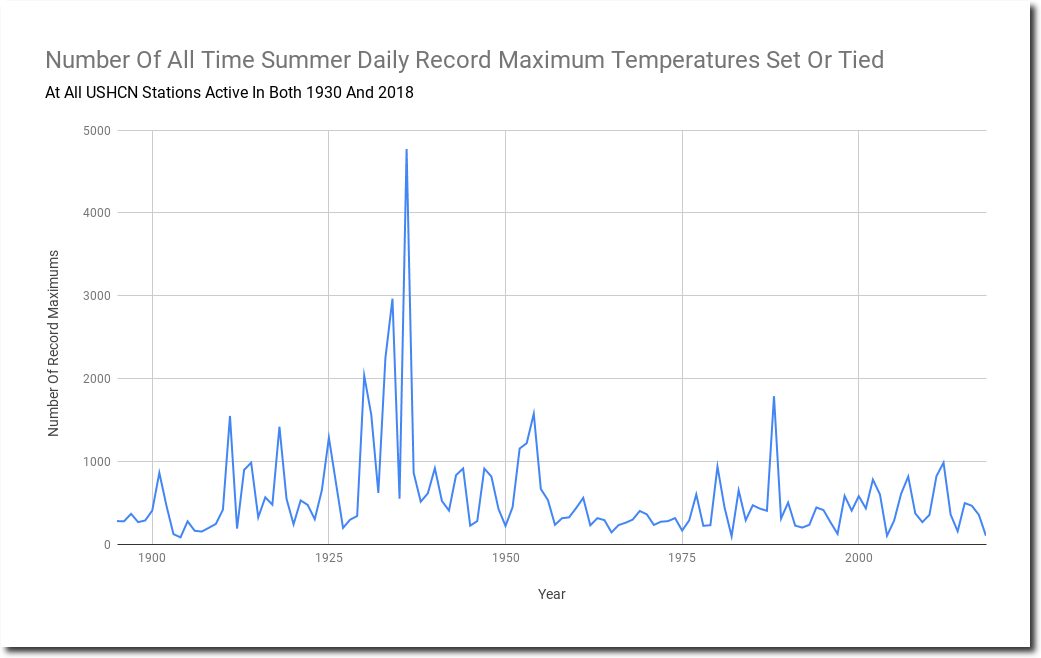
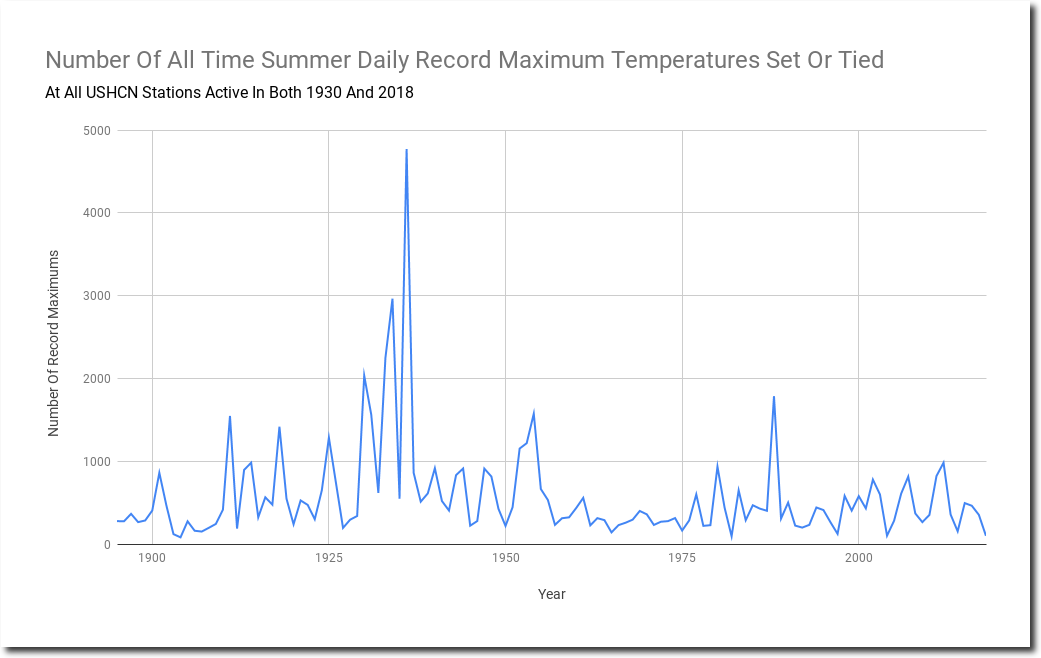
Despite all the fake news about record heat, this summer (June-August) so far has had a near record low number of daily maximum temperature records in the US. The vast majority of summer daily maximum temperature records were set more than 60 years ago, and never matched again.
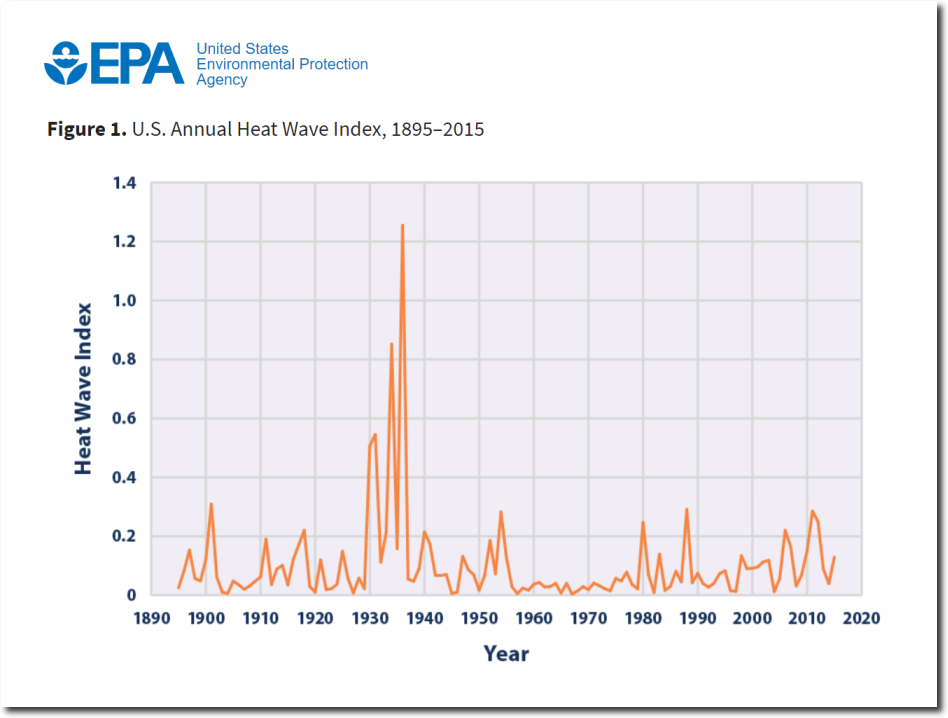
Even the climate hacks at the EPA know that the 1930’s were much hotter than any years since.
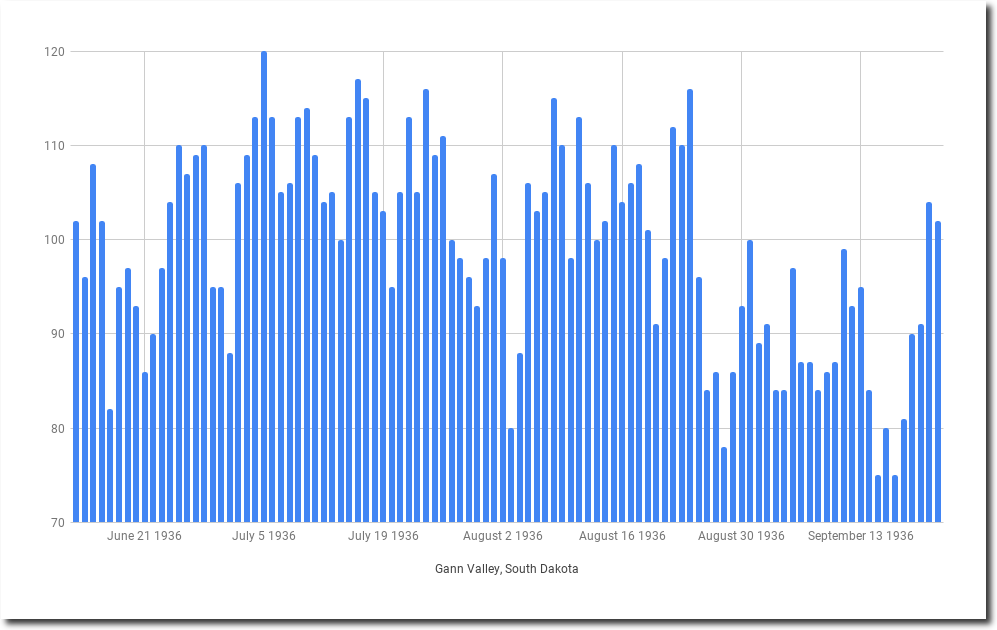
From June 25 to August 24, 1936, afternoon temperatures at Gann Valley, South Dakota averaged 105 degrees. They had twenty days over 110 degrees that summer.
Posted in Uncategorized
Leave a comment
New York Times Blames Hot Weather On Scott Pruit
Opinion | Scott Pruitt and the Global Heat Wave – The New York Times
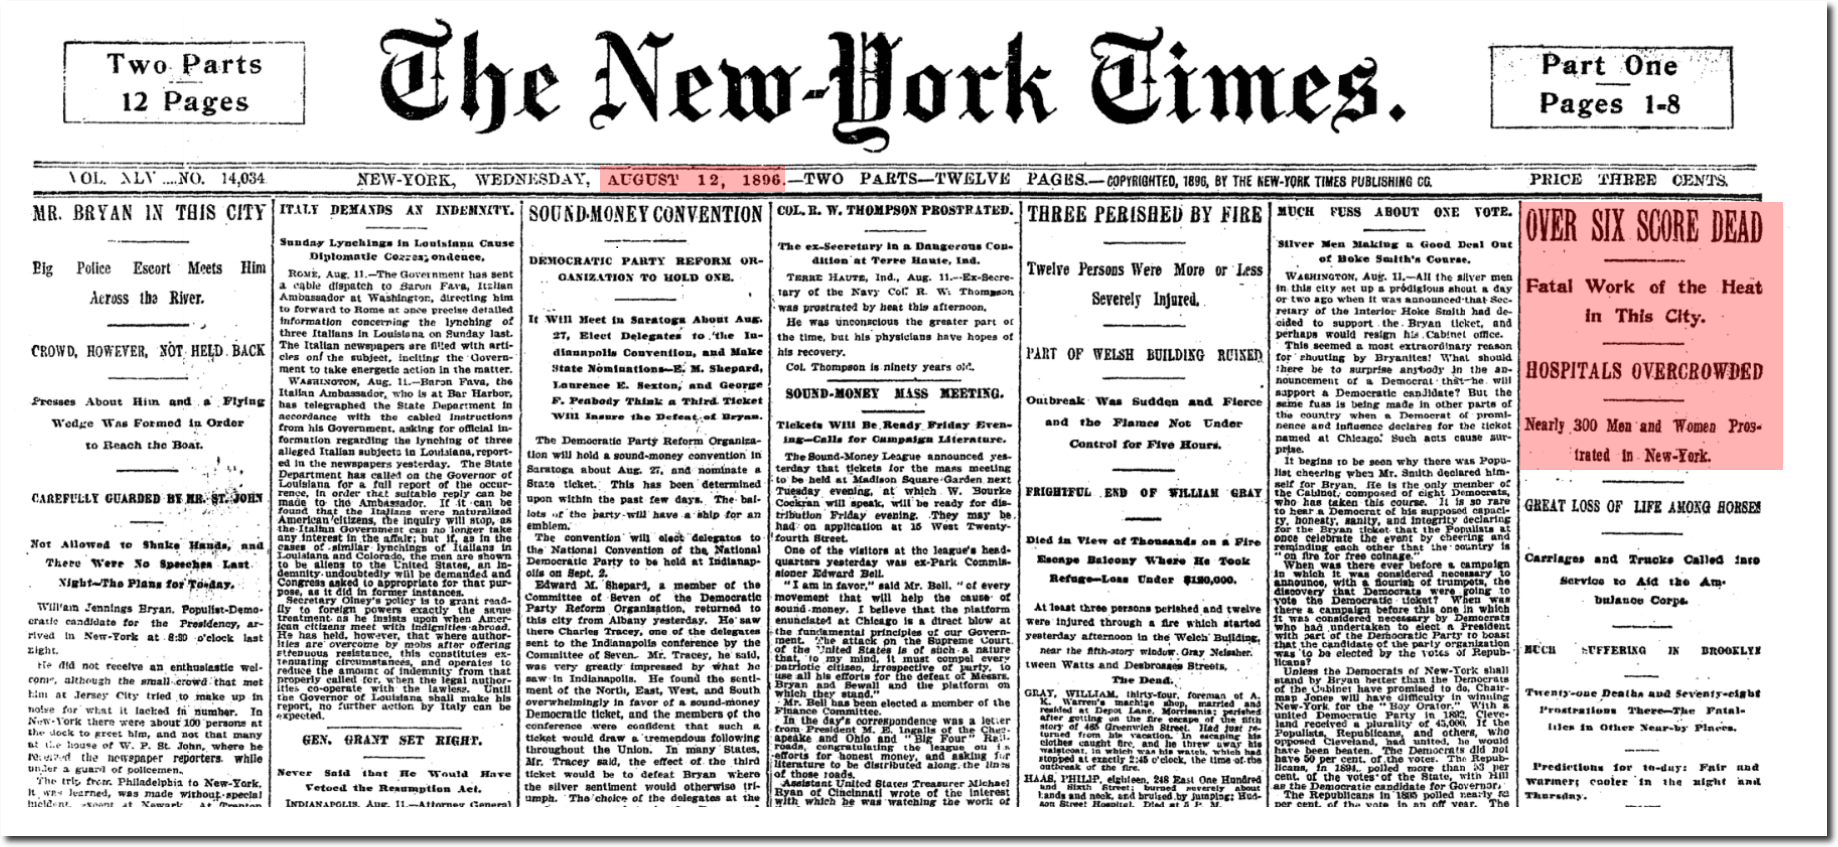
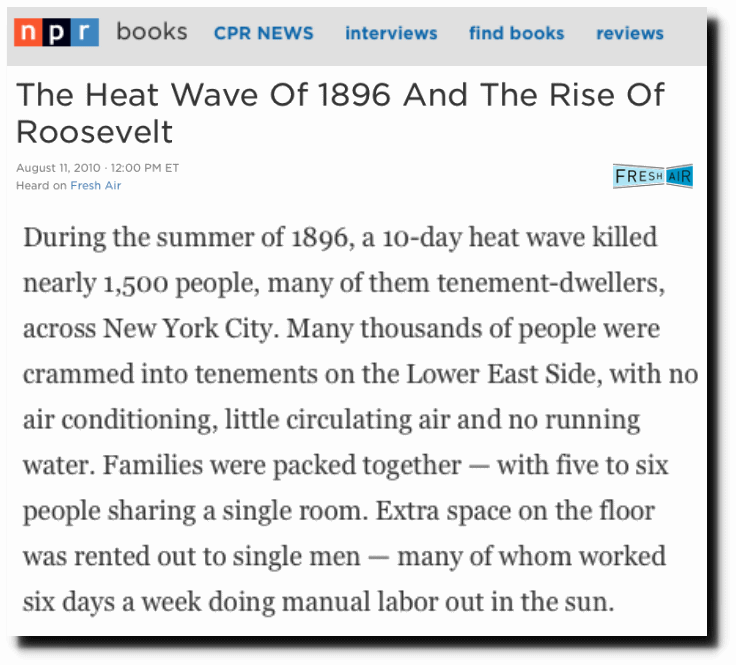
I wonder who they blamed the 1896 heatwave on? That one killed 1,500 people in New York.
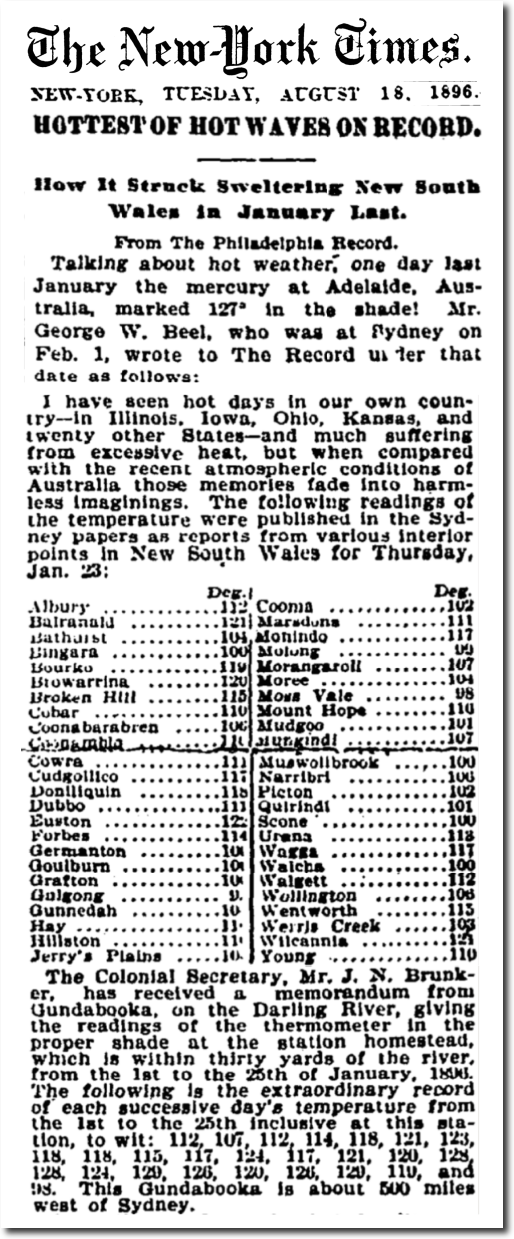
Australia also had their worst heatwave on record during January of 1896.
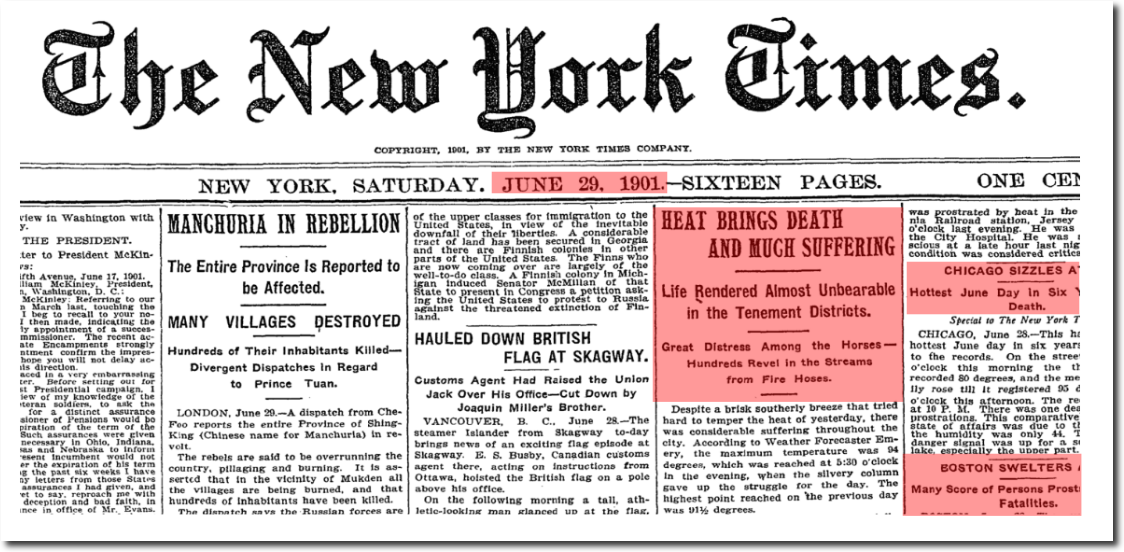
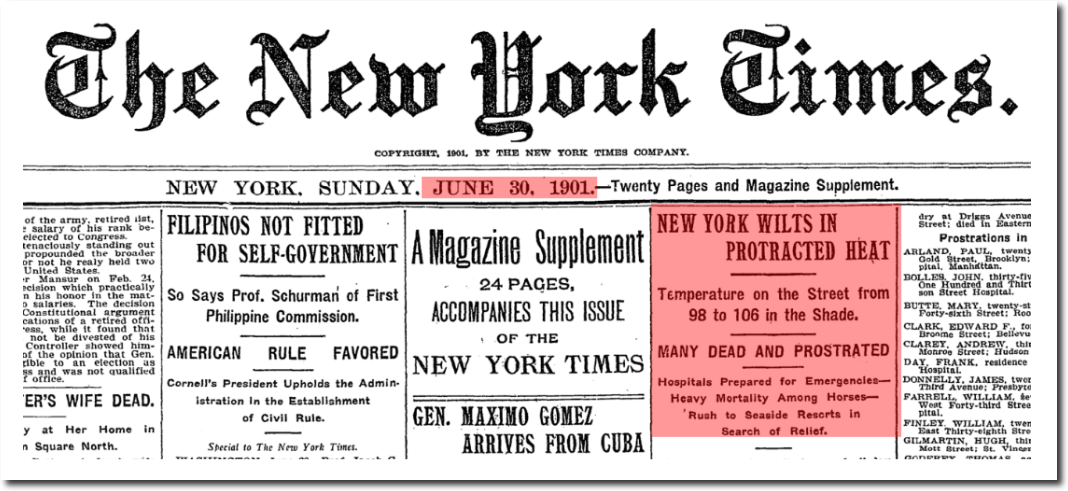
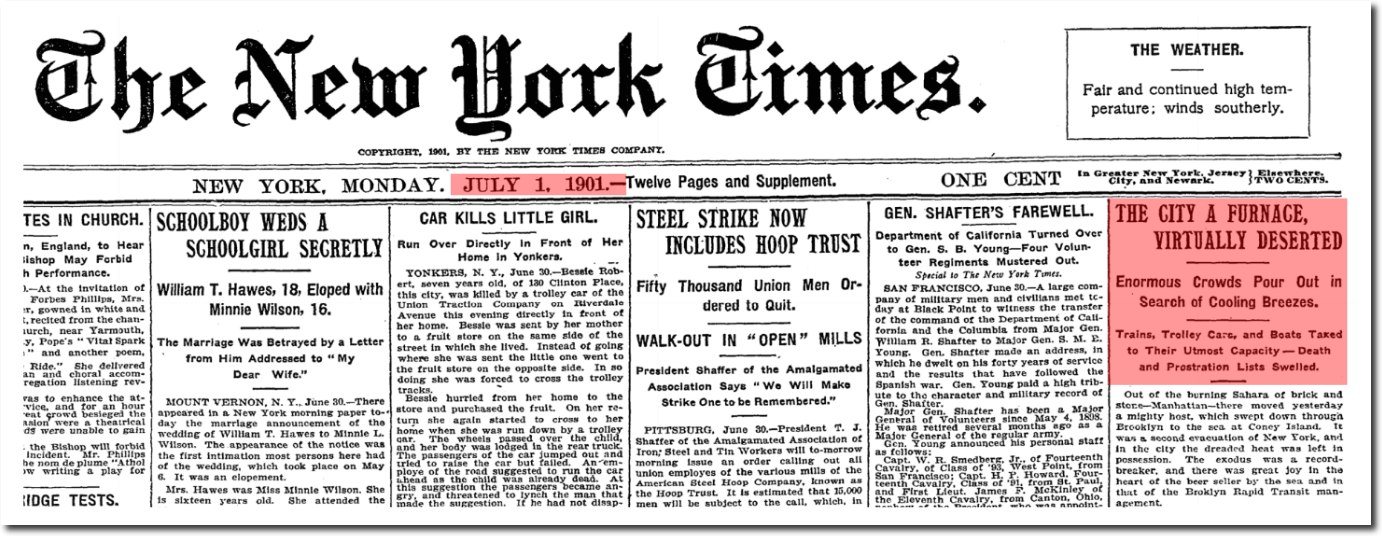
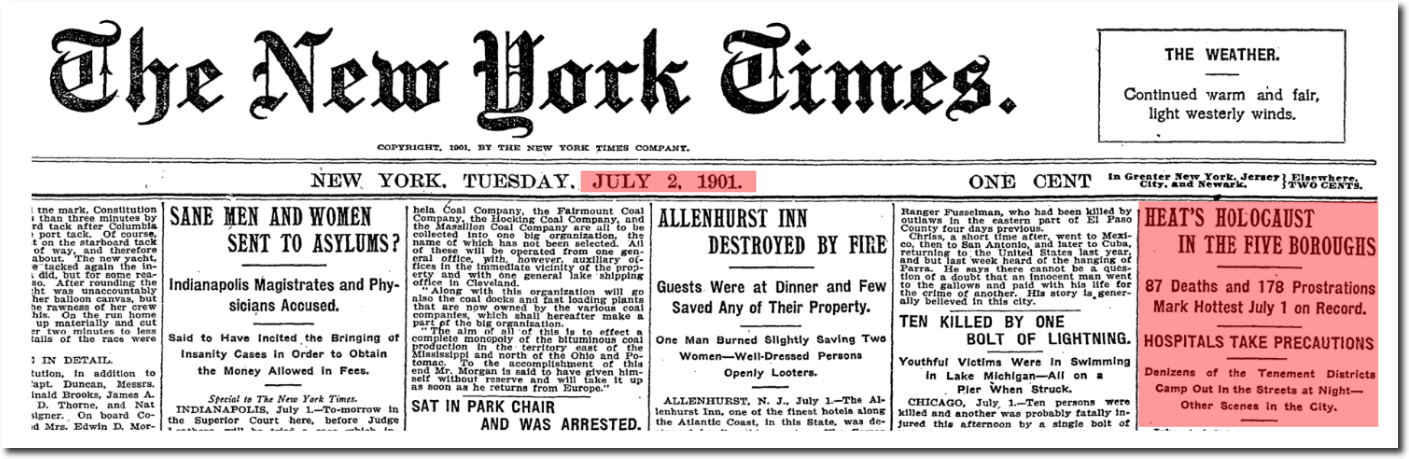
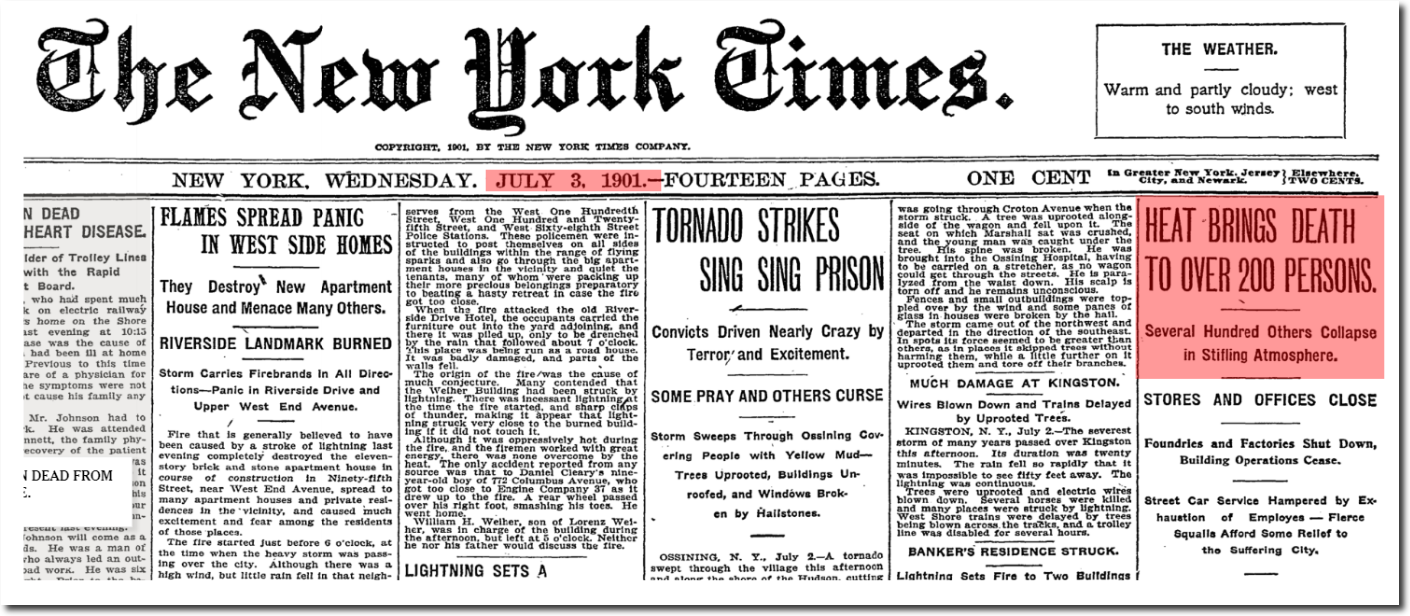
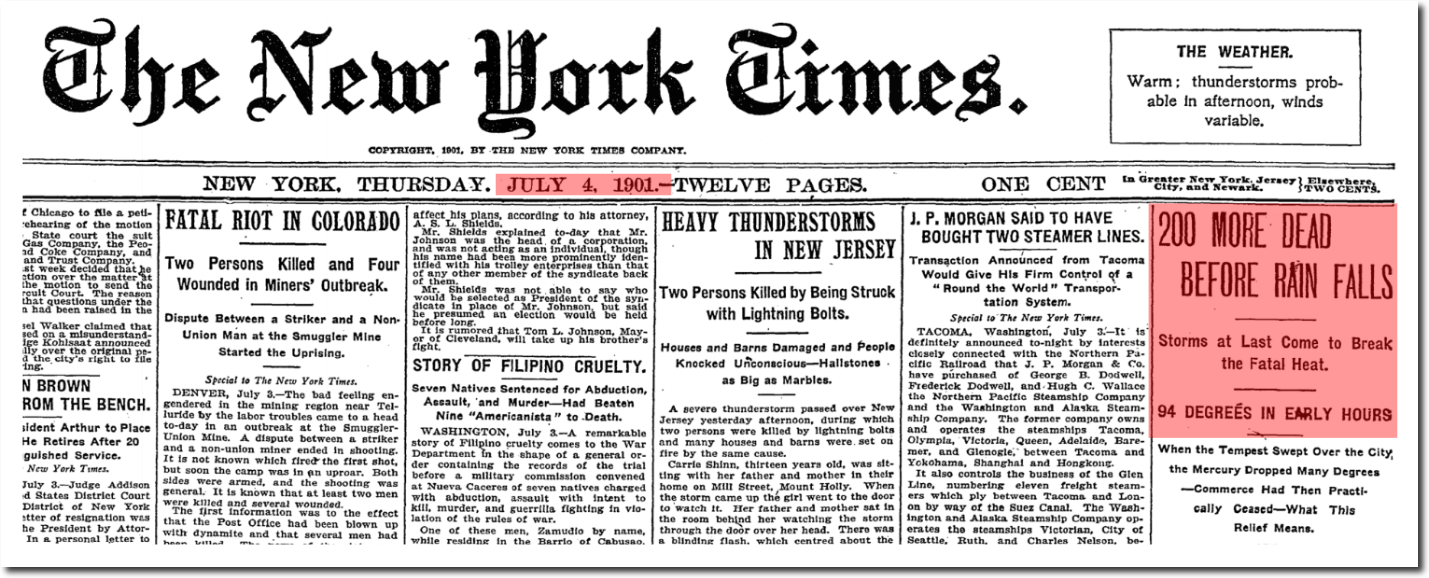
The 1901 heatwave killed thousands of people.
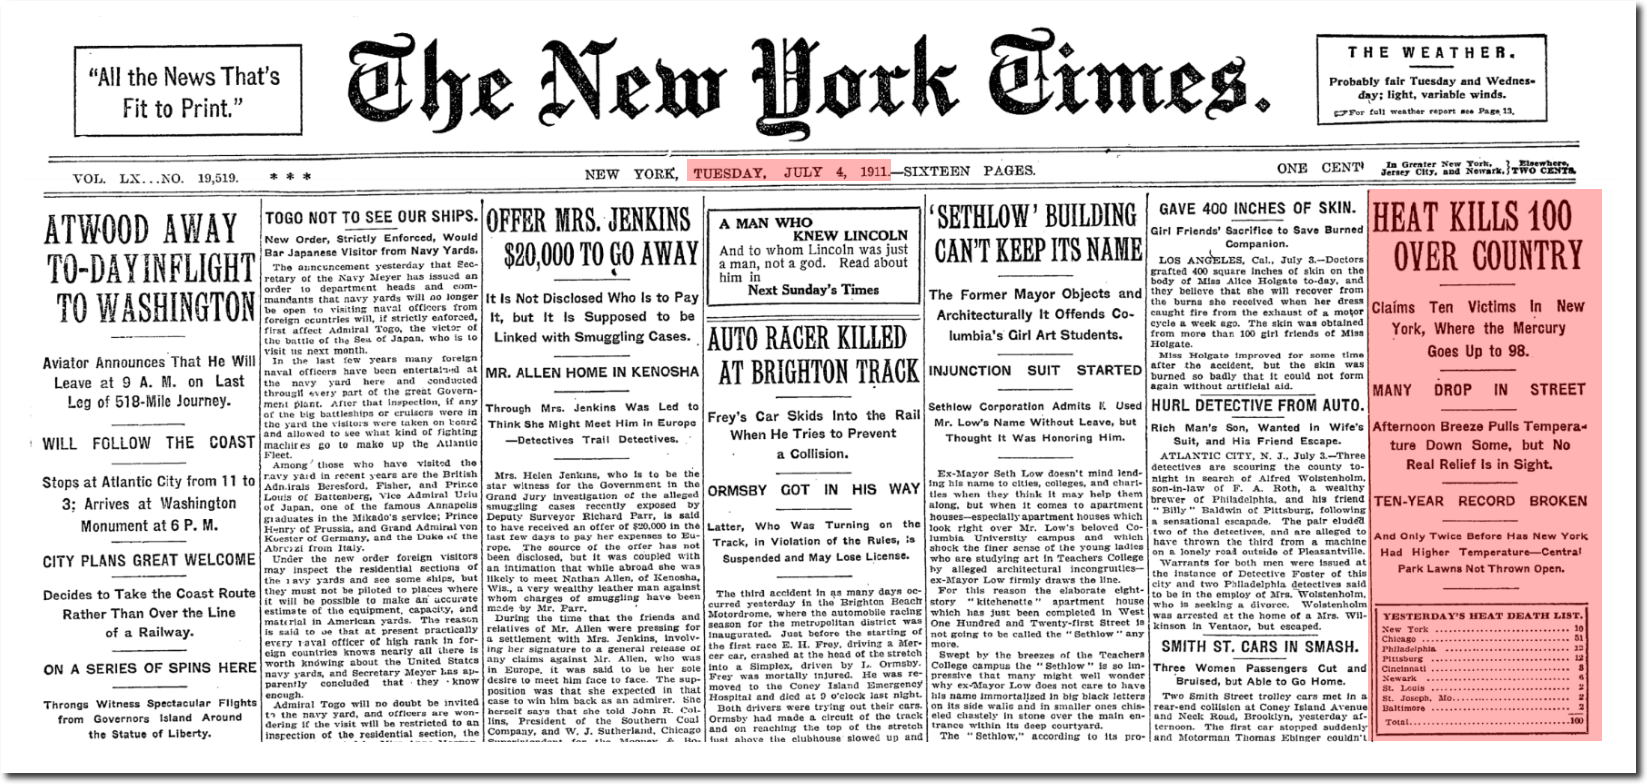
The 1911 heatwave killed thousands of people in New England and across the country.
Climate alarmists have adopted the identical thought process of 16th century witch burners, who accused people of cooking the weather.
Posted in Uncategorized
Leave a comment
Sixty Years Of No Troposphere Warming
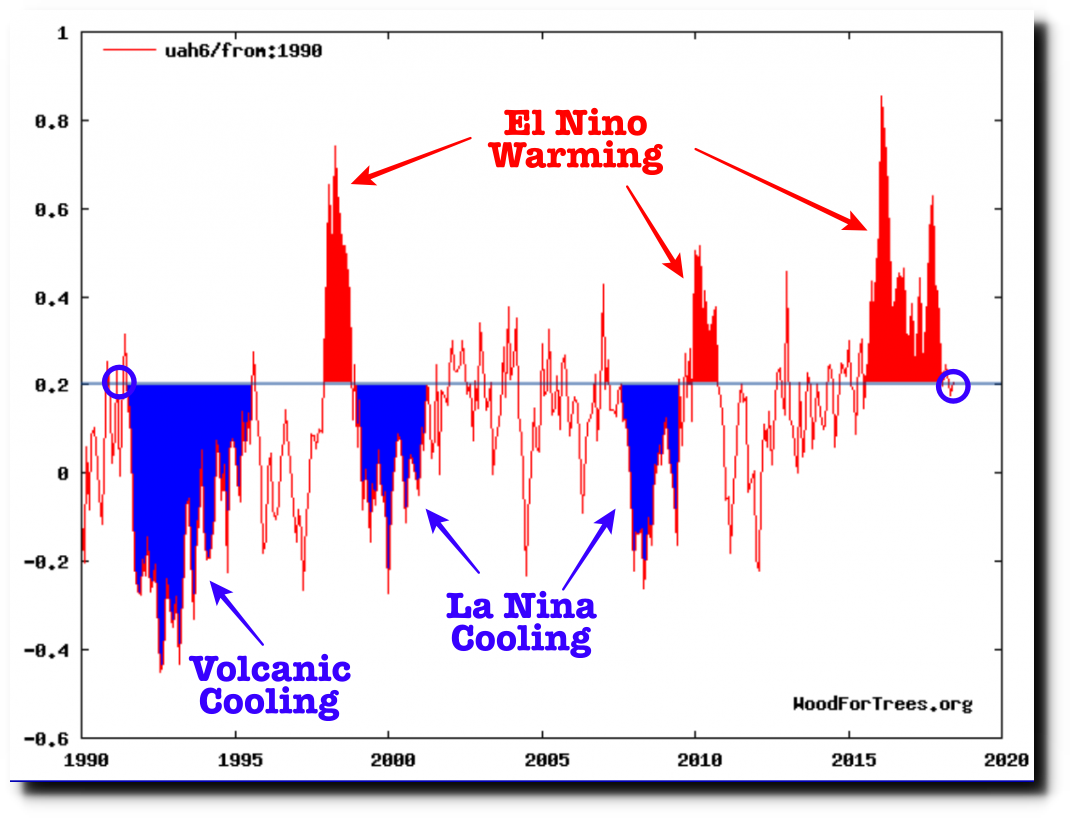
Satellite data shows that current troposphere temperatures are about the same as 1991 and 1995. Other than spikes and dips caused by volcanoes and ENSO events, there has been no change in temperature.
Wood for Trees: Interactive Graphs
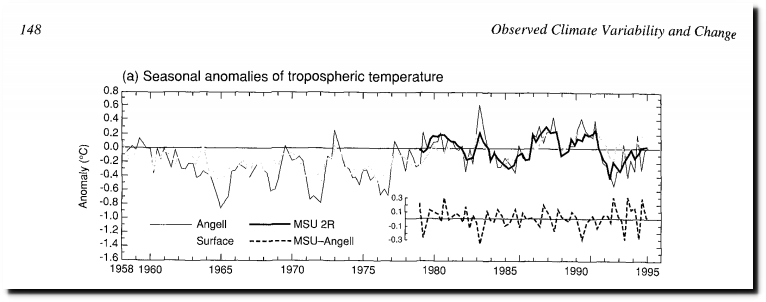
The 1995 IPCC report showed no change in troposphere temperature from 1958 to 1995, based on satellite and balloon observations.
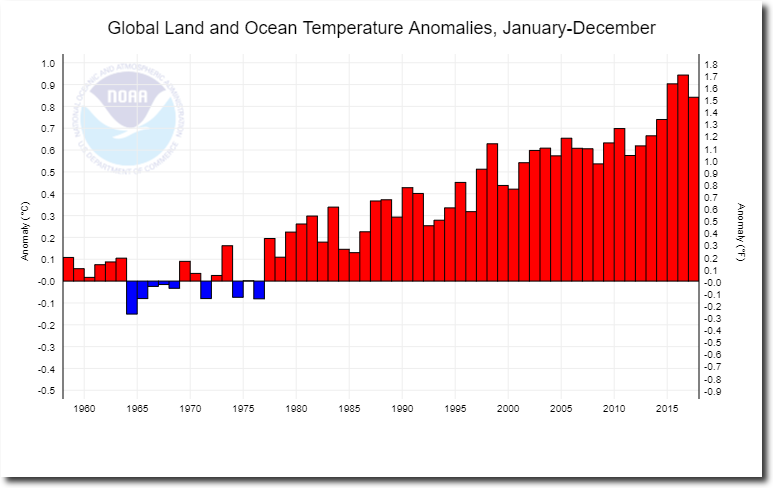
No warming from 1958-1995, and none since 1995. So there has been little or no warming for 60 years, which of course is reported by government agencies as the Earth burning up.
Climate at a Glance | National Centers for Environmental Information (NCEI)
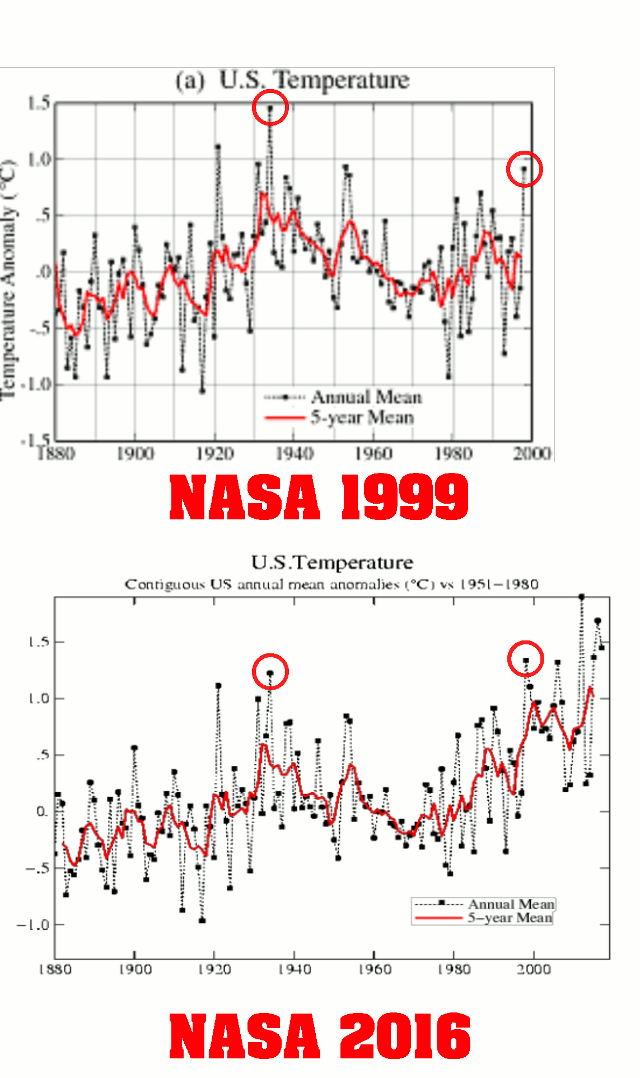
When data doesn’t fit the agenda, government scientists simply alter it.
Posted in Uncategorized
Leave a comment
Drudge Pounding The Fake News
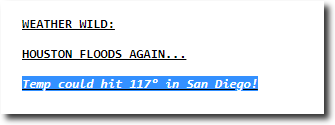
117 degrees in San Diego? Fake news doesn’t get much more incredulous than that. The actual forecast for San Diego is fairly typical for this time of year.
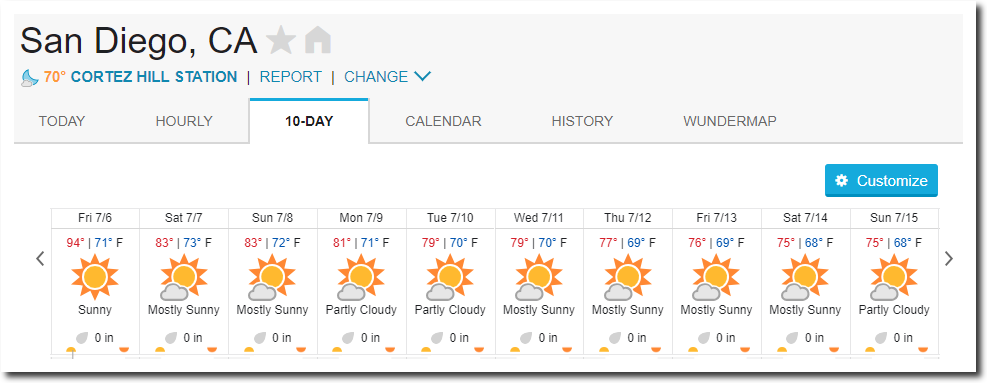
Meanwhile, here in the real world, July 6, 1936 was the hottest day on record in North Dakota – at 121 degrees.
These were the temperatures at Fort Yates, North Dakota from June 18- September 22, 1936.
100, 90, 90, 64, 90, 91, 110, 107, 97, 104, 97, 93, 93, 84, 93, 96, 104, 108, 119, 112, 109, 113, 114, 110, 106, 101, 98, 108, 118, 107, 109, 102, 91, 100, 99, 100, 101, 100, 100, 93, 91, 88, 95, 100, 108, 91, 82, 71, 84, 96, 98, 104, 96, 99, 84, 91, 91, 101, 99, 79, 91, 93, 79, 80, 88, 93, 88, 81, 80, 81, 77, 75, 80, 84, 96, 91, 89, 90, 93, 90, 73, 87, 60, 82, 87, 91, 87, 64, 75, 72, 80, 75, 81, 82, 84, 91, 101

Posted in Uncategorized
Leave a comment
Arctic Meltdown Update
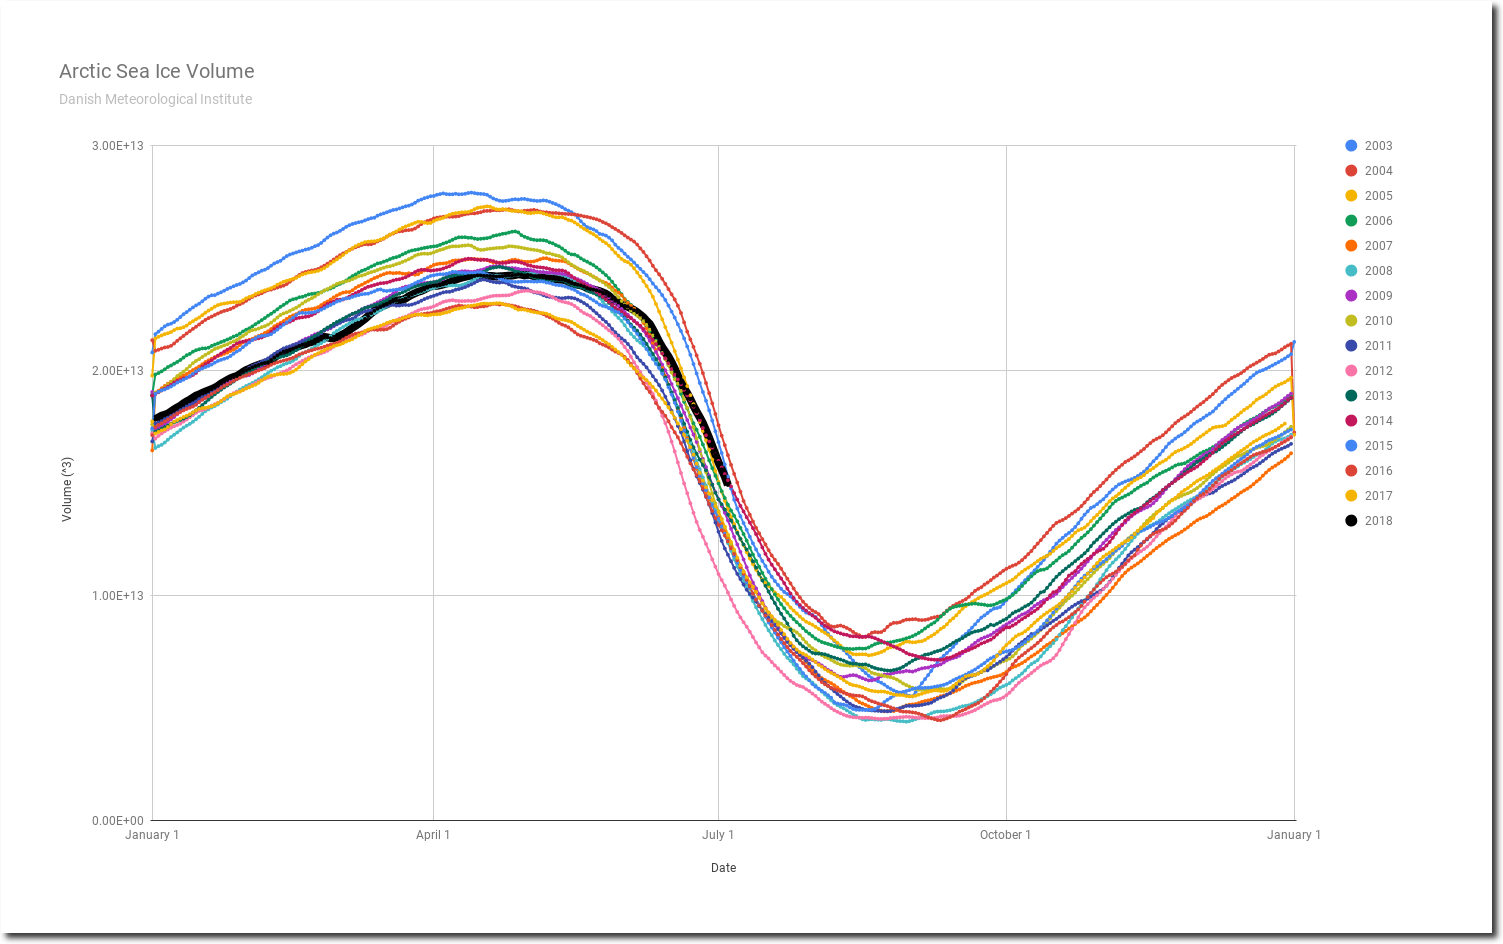
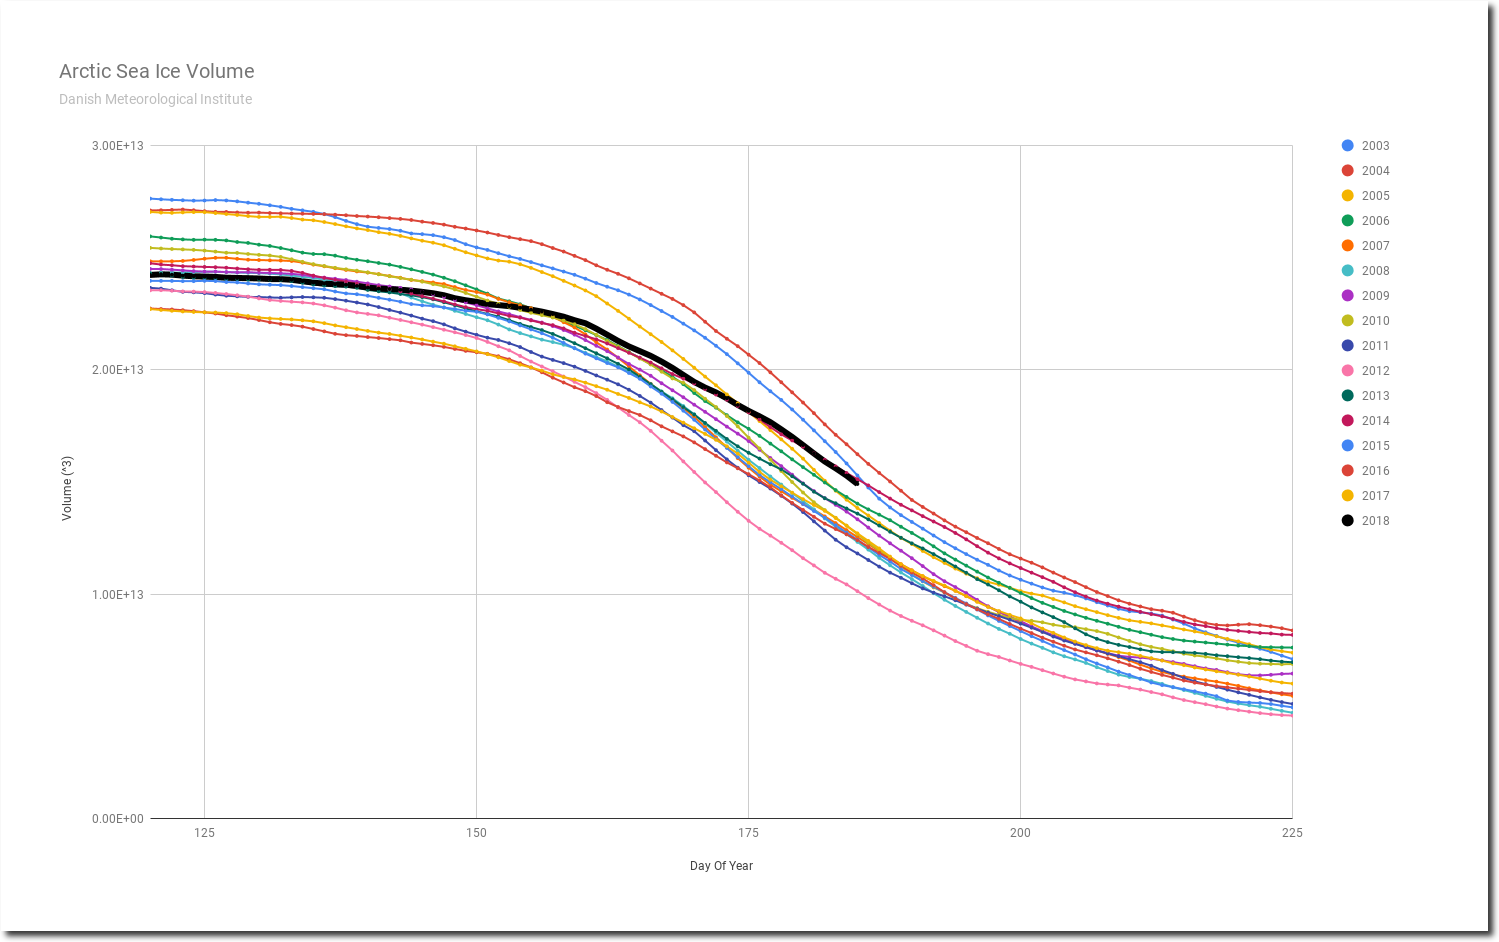
Arctic sea ice volume is about to pass 2003 and move to third highest in the DMI record. This should happen on Saturday.
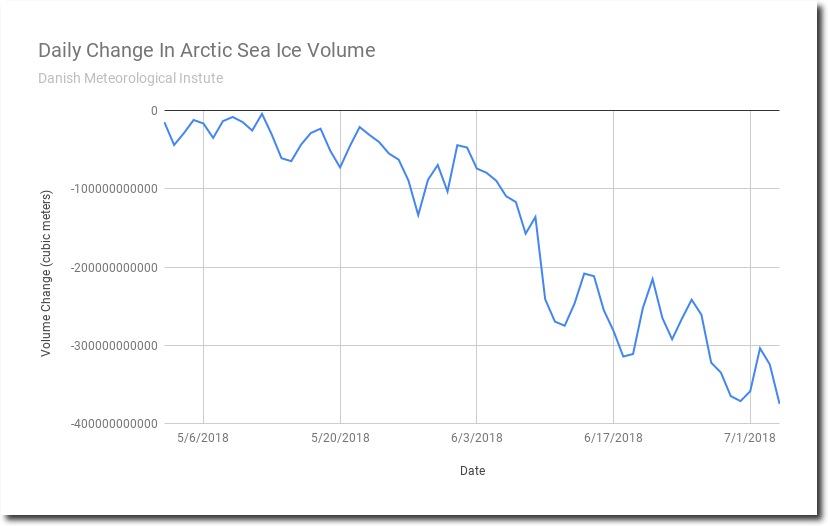
Yesterday was the peak melt day of the season so far. The only other year when the peak melt occurred in July was 2003. Normally it occurs in June.
Peak melt rates have declined over the past 15 years, with this year being the fourth lowest on record (so far.)
Posted in Uncategorized
Leave a comment