















Disrupting the Borg is expensive and time consuming!
Google Search
-
Recent Posts
- Three Years Since The Apocalypse
- Arctic Report card Summer 2026
- Elon Pushing Pushing Geoengineering
- Earth, Wind And Fire
- On The Road Again
- Vandalism At The Reflecting Pool
- Fifty Years Ago Today
- Truth Or Consequences
- US Climate Trend Maps
- Declining Spring Snow Cover In Northern New Mexico
- You Can’t Fool Mother Nature
- Cattle And The Climate
- One Atomic Bomb Per Hour
- New Video : Analyzing Oil And Gas
- Is Antarctica Melting?
- High Speed Analysis And Visualization
- El Nino To The Rescue?
- Fake News Update
- Growth Of Antarctic Sea Ice
- 65 Years Of Progress!
- El Nino To The Rescue?
- Worst March Drought On Record
- ChartGL Process Control Demo
- The Biggest Money Laundering Scam
- Drought In The Headwaters Of Lake Powell
September 2026 M T W T F S S 1 2 3 4 5 6 7 8 9 10 11 12 13 14 15 16 17 18 19 20 21 22 23 24 25 26 27 28 29 30 Recent Comments
- Denis Rushworth on Three Years Since The Apocalypse
- conrad ziefle on Earth, Wind And Fire
- Crispin Pemberton-Pigott on Three Years Since The Apocalypse
- Robertvd on Arctic Report card Summer 2026
- conrad ziefle on Three Years Since The Apocalypse
- Terry Shipman on Arctic Report card Summer 2026
- D. Boss on Arctic Report card Summer 2026
- Gordon Vigurs on Three Years Since The Apocalypse
- Bob G on Three Years Since The Apocalypse
Nothing Happening In The Arctic
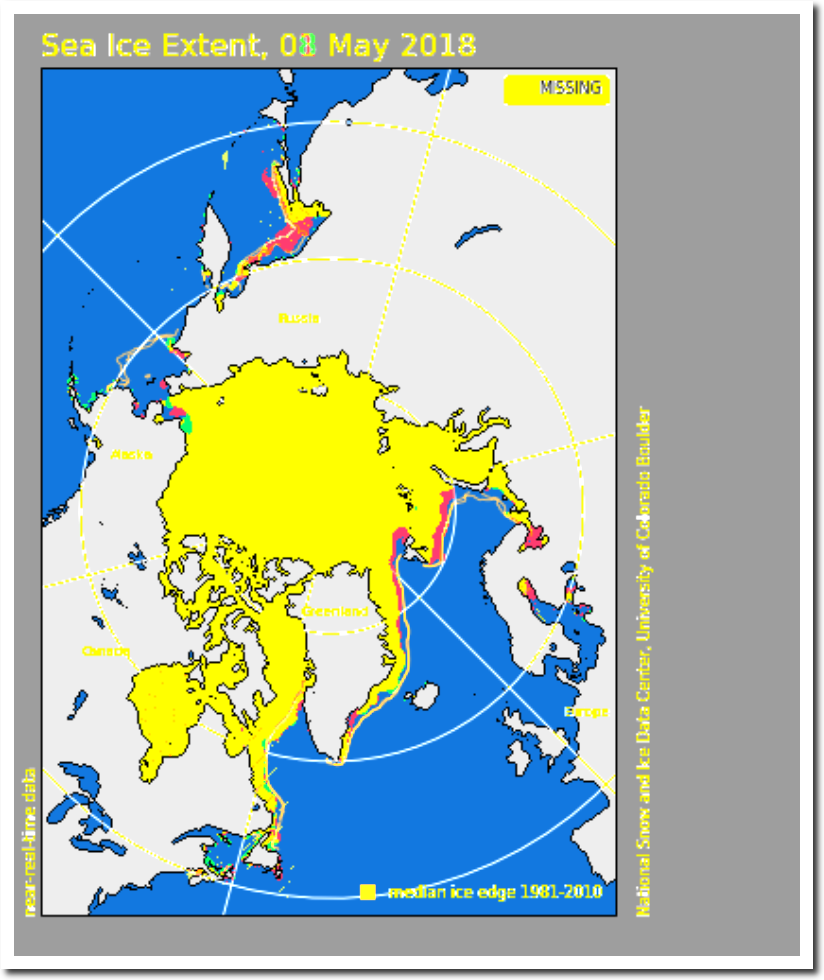
Red shows ice loss over the last two days. Green shows ice gain. Other than winds pushing the ice edge back a little in the Barents Sea, ice extent is not changing.
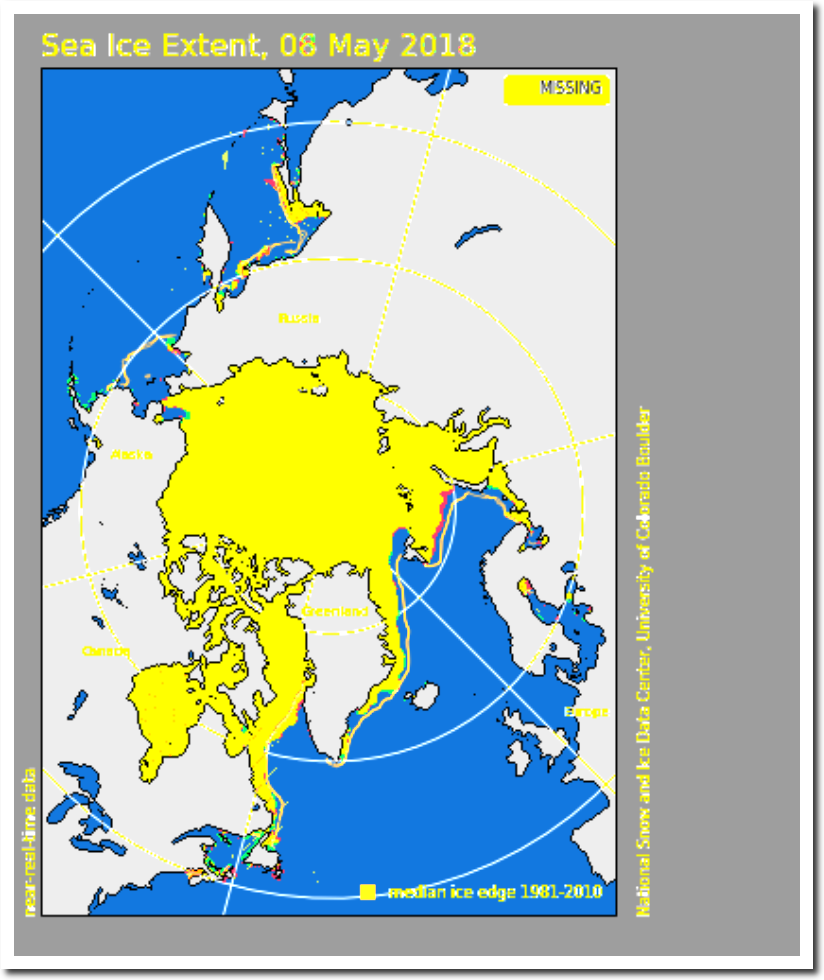
Over the past week, ice loss has been due to the Sea of Okhotsk melting out and southerly winds in the Eastern Arctic pushing the ice edge back.
Posted in Uncategorized
Leave a comment
Little Miracles

ATTENBOROUGH : ‘Climate Change Stops Plants Growing’ | Principia Scientific International
Last night I was photographing some of God’s large miracles, like Saturn and Jupiter. Today I am looking at some equally impressive little miracles.

Posted in Uncategorized
Leave a comment
Stop Heating The Arctic!
NOAA says December was really hot in the Arctic and it was your fault.
https://www.eenews.net/
Given that there isn’t any sunlight in the Arctic in December, it is pretty incredible that people calling themselves scientists would attribute the relatively mild air to the greenhouse effect – which depends on sunlight.
The second half of December was record cold in the Eastern US, and even the New York Times understood that Arctic air in Florida means cold Arctic air is being displaced by milder air from the mid-latitudes.
Feeling a Chill? Blame the Polar Vortex. And Global Warming. – The New York Times
During the ice age scare in 1977, Alaska was warmer than Florida – for the same reason. Home purchases in Florida came with “FREE LIFETIME SNOW REMOVAL.”
Lakeland Ledger – Google News Archive Search
Before the 1970’s ice age scare, the Arctic warmed 10 degrees in the first half of the 20th century and glaciers were rapidly disappearing.
17 Dec 1939, Page 15 – Harrisburg Sunday Courier at Newspapers.com
31 May 1947 – TEMPERATURES RISING IN ARCTIC REGION – Trove
18 Feb 1952 – Melting Icecaps Mystery – Trove
If NOAA climate scientists were actual scientists, they would know that Arctic temperatures are cyclical, and have nothing to do with CO2 or humans.
The level of mindless peer-reviewed fraud coming out of academia and government is really quite remarkable!
Posted in Uncategorized
Leave a comment
Enforced Compliance With The Global Warming Religion
CNN is attacking President Trump’s nominee to lead the United Nations Migration agency for “casting doubt on climate science” – because he retweeted me.
No one is allowed to question their junk science religion, and for some reason fake news journalists are afraid to talk to me. What is it they are afraid? Reality?
Science can’t exist without skepticism. The global warming cult is determined to destroy science.
Posted in Uncategorized
Leave a comment
Climate Science Essentially Gone
Yet another amazing NSIDC fail. They posted bogus maps of multi-year sea ice this week, prompting Eric Holthaus to be shocked.
This is exactly the same claim David Barber made nine years ago.
Multiyear Arctic ice is effectively gone: expert | Reuters
NSIDC forgot to update the age of the ice, and have since corrected it. Multi-year ice actually covers about half of the Arctic.
Note: The ice age fields originally posted on Thursday, May 3, were incorrect. The ice age field has its “birthday” each September after the minimum, when all of the age values are incremented by one after the end of the summer melt season.
Arctic winter warms up to a low summer ice season | Arctic Sea Ice News and Analysis
How did NSIDC manage to miss the birthday by eight months? Pretty spectacular incompetence.
Since 2009, there has been a large increase in multi-year ice. This is what multi-year ice extent looked like in 2009.
ice_type_nh_polstere-100_multi_200905011200.png (380×560)
Two years ago I caught NSIDC making multi-year ice disappear.
Global warming is the biggest scam in science history. The Arctic isn’t cooperating, so scientists simply make stuff up.
Posted in Uncategorized
Leave a comment
Can We Be Certain That Modern Climate Science Is Based On Stupidity?
The Norwegian Glacier Museum claims an incredible climate sensitivity of 8°C per 100 PPM CO2, or 1°C per 10 PPM CO2.
Through burning of coal and petroleum products mankind has increased the amount of carbon dioxide as much as the natural difference between ice ages and interglacials, which is the equivalent to 8 °C.
Glaciers and climate — The Norwegian Glacier Museum
Yet their graph shows a climate sensitivity of zero. As CO2 has risen 100 PPM over the past century (red line), there has been no corresponding increase in temperature (blue line. )
The lack of correlation over the past century shows that changes in CO2 have historically been a response to temperature changes, not the cause of them. An entire field of science is based around a fundamental inability to read graphs and think logically.
Posted in Uncategorized
Leave a comment
How James Hansen And Michael Mann Destroyed Climate Science
Climate scientists used to understand that the sun controlled Earth’s climate – until Michael Mann and James Hansen destroyed the temperature record about 20 years ago.
Total solar irradiance (TSI) has increased since the Little Ice Age.
The graph below is from the 1990 IPCC report, and it shows temperatures were much warmer 900 years ago, and were much cooler 400 years ago during the Little Ice Age.
If we overlay the TSI graph and the 1990 IPCC graph, we see correlation between temperature and TSI.
The 1990 IPCC graph is hand drawn and the X-axis is irregular. A small shift and scaling change lines up TSI and temperature almost perfectly.
Similarly, we see a correlation between the 1974 NCAR global temperature graph and sunspots.
21 Jul 1974, 13 – The Des Moines Register at Newspapers.com
Wood for Trees: Interactive Graphs
Again, a small shift of the hand drawn 1974 graph causes sunspots and temperature to line up very closely.
TSI and Sunspots are only part of the solar climate story. Comets have two tails because there are at least two distinct types of energy being emitted from the Sun – photons and ionized particles known as the Solar Wind.
The Earth’s magnetic field protects us from the Solar Wind – directing the charged particles towards the poles where they release energy as the Northern and Southern lights. Without the magnetic field surrounding Earth, our planet would be unlivable.
A Mighty Solar Wind May Kindle Auroras Next 3 Nights – Astro Bob
In 1859, a large solar storm brought charged particles across the entire planet, with so much energy that people all over the world could read at night, and telegraph lines carried current without any power supply.
31 Aug 1859, 1 – The Cadiz Sentinel at Newspapers.com
The storm came from a coronal mass ejection which was released from this sunspot group.
Carrington Richard sunspots 1859 – Solar storm of 1859 – Wikipedia
The solar wind brings a lot of very variable energy into Earth’s atmosphere, which is completely unaccounted for by climate scientists. And because the Earth’s and Sun’s magnetic fields are constantly changing, this causes weather patterns on earth to change too – leading to all sorts of superstitions like the current “climate change” cult.
The correlation between solar activity and earth’s temperature was obvious until 20 years ago when Michael Mann and James Hansen corrupted Earth’s temperature record through massive data tampering. Mann made the Medieval Warm Period and Little Ice Age disappear with his hockey stick graph.
Meanwhile Hansen made the 1940’s warmth and subsequent cooling disappear.
There was no question at the time that the 1930’s and 1940’s were very warm, and that the temperatures correlated with solar activity.
17 Dec 1939, Page 15 – Harrisburg Sunday Courier
13 Oct 1940, Page 76 – Hartford Courant at Newspapers.com
TimesMachine: July 2, 1931 – NYTimes.com
In 1951, MIT professor Hurd C. Willett correctly predicted 20 years of global cooling, based on sunspot cycles.
07 May 1951, Page 9 – The Pantagraph at Newspapers.com
The first director of NCAR understood that sun controlled earth’s climate.
In 1973, Roberts predicted a drought based on sunspot cycles.
27 Sep 1973, Page 38 – El Paso Herald-Post at Newspapers.com
21 Jul 1974, 13 – The Des Moines Register at Newspapers.com
By destroying the temperature record, Mann and Hansen wrecked an entire field of science – and caused scientists to pursue a superstitious relationship between temperature and CO2 instead of doing actual research.
Posted in Uncategorized
Leave a comment