Thank God Newt lost. Last night would not have gone as well with Newt as our representative. Even his enormous head, filled with facts, would not have been able to hide the many years of republican baggage.
Hell just let the Sun and the normal cycle of earth do the job. We don’t need uneducated morons lying. I’m headed for sixty and have gone though a cool cycle and a warm cycle. Now I can leave this world in a cool state.
One would hope the people of world will sue every one of these cranks.



Thank God Newt lost. Last night would not have gone as well with Newt as our representative. Even his enormous head, filled with facts, would not have been able to hide the many years of republican baggage.
Hell just let the Sun and the normal cycle of earth do the job. We don’t need uneducated morons lying. I’m headed for sixty and have gone though a cool cycle and a warm cycle. Now I can leave this world in a cool state.
One would hope the people of world will sue every one of these cranks.
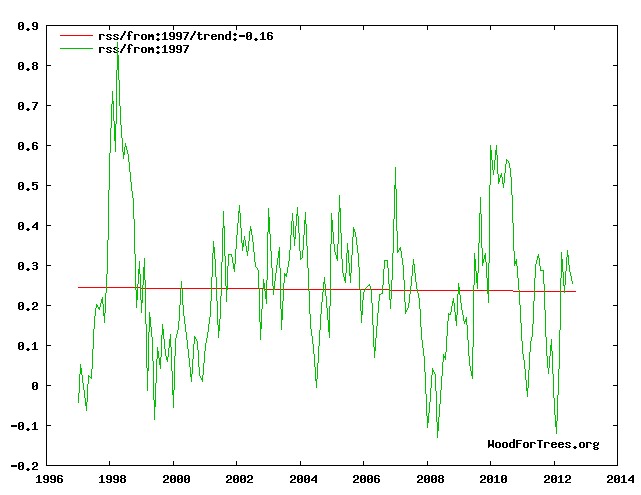
No fair showing raw data! You haven’t given Hansen any chance to adjust that chart. Shame on you!
RSS data is also partly based on a climate model, just not one of James Hansen’s climate models. 😉