
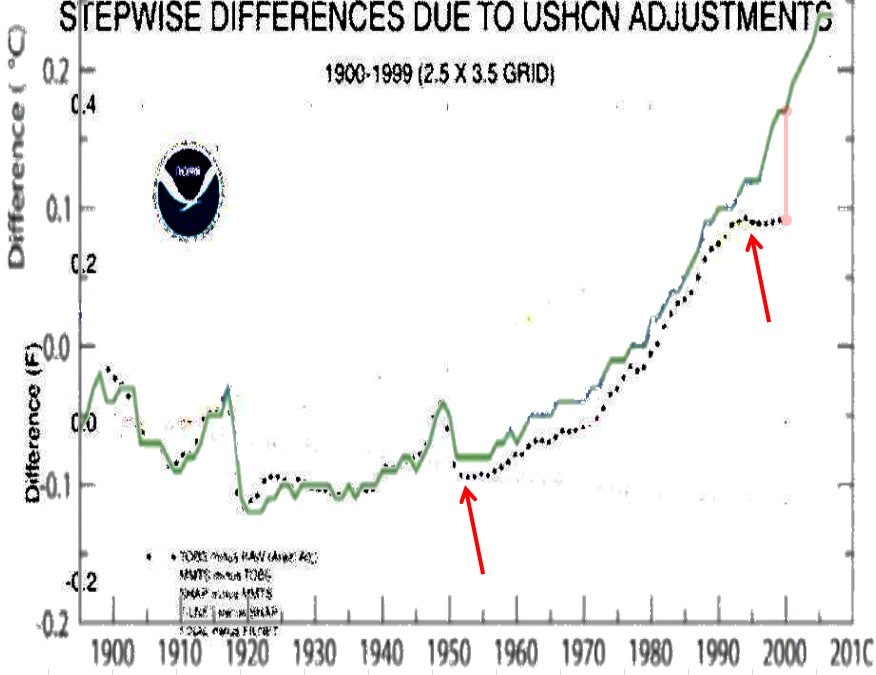
Disclaimer : I have no reason to believe that any of USHCN’s adjustments are legitimate. This image just shows how they have increased the amount of TOBS cheating they are doing between V1 and V2.
Up until 1950, V1 (black) and V2 (green) matched closely. In 1950, V2 took a step up – and again in 1990 V2 took a big step up. According to USHCN docs, TOBS did not change between V1 and V2, so something is clearly rotten in Denmark.
By 1999, the V2 TOBS adjustment was nearly double the V1 version, and going up exponentially. The USHCN adjustments were supposed to flat line after 1990, but they have done the exact opposite.
The animation below shows how USHCN has turned a cooling trend into a warming trend, all through the magic of several steps of data tampering.

In 1999, Hansen knew that the US was cooling. He didn’t start his massive cheating until later.
in the U.S. there has been little temperature change in the past 50 years, the time of rapidly increasing greenhouse gases — in fact, there was a slight cooling throughout much of the country

Our Government would never lie to us. Would they?
Some lie with prostitutes, then lie again.
http://www.guardian.co.uk/world/2013/feb/05/robert-menendez-denies-prostitute-allegations
I think you mean they lie with, and as prostitutes. 😉
Reblogged this on Climate Ponderings.
In 1999, NOAA said the 1998 US temp was 54.62F. Today they say it was 54.3F.
http://notalotofpeopleknowthat.wordpress.com/2013/02/13/ncdc-rewrite-history/