
In 1978. NOAA showed nearly a full degree of southern hemisphere cooling from 1957-1970. CRU has since made all of that cooling disappear.
journals.ametsoc.org/doi/pdf/10.1175/1520-0493(1978)106<0755%3AGTVSMA>2.0.CO%3B2

Met Office Hadley Centre observations datasets
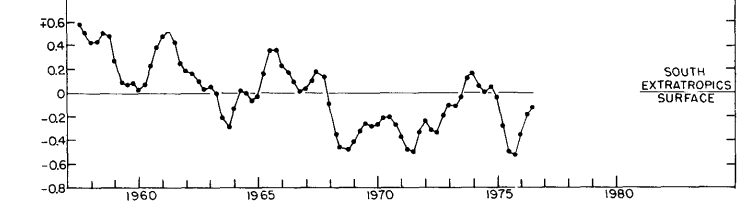
The graph below shows the 1978 NOAA southern hemisphere surface temperature anomaly in blue, and the CRUTEMV3 southern hemisphere surface temperature anomaly in orange.
At 09:41 AM 2/2/2005, Phil Jones wrote:
Mike (Mann),
I presume congratulations are in order – so congrats etc !
Just sent loads of station data to Scott. Make sure he documents everything better this time ! And don’t leave stuff lying around on ftp sites – you never know who is
trawling them. The two MMs have been after the CRU station data for years. If they ever hear there is a Freedom of Information Act now in the UK, I think I’ll delete the file rather than send to anyone. Does your similar act in the US force you to respond to enquiries within 20 days? – our does ! The UK works on precedents, so the first request will test it.We also have a data protection act, which I will hide behind. Tom Wigley has sent me a worried email when he heard about it
h/t to Nik From NYC

CLIMATEGATE 101: “For your eyes only…Don’t leave stuff lying around on ftp sites – you never know who is trawling them. The two MMs have been after the CRU station data for years. If they ever hear there is a Freedom of Information Act now in the UK, I think I’ll delete the file rather than send to anyone….Tom Wigley has sent me a worried email when he heard about it – thought people could ask him for his model code. He has retired officially from UEA so he can hide behind that.” – Phil “Hide The Decline” Jones to Michael “Hockey Stick” Mann
I knew Jim Angell when he was doing this analysis. He was one of the more reliable climate scientists.
Keep archiving this Steve, it will have to be admitted during the upcoming trial of the century. As they start getting sentenced, the amount of years they get will keep increasing as the sheer immensity of the scam becomes apparent. Something like a hockey stick
The immensity of the scam is still beyond the wildest imagination of most of us.
More will be revealed.
The better figure to show would be the Southern Hemisphere section of Figure 4. The figure you chose for this article excludes the SH tropics. Comparing that to CRU’s Southern Hemisphere is like comparing apples and oranges … or perhaps oranges and tangerines.
The Figure 4 plot of Angell and Korshover shows much the same decline as Figure 1 shows for exatropics only.
You couldn’t be bothered to note that the figure you extracted from Angell & Korshover (1978) was southern hemisphere extratropical (30°-90°S) data based on a grand total of 12 radiosonde stations? Or that you were comparing it to Hadcrut4 data for the entire southern hemisphere based on from 550 to 750 (the number varied over the 1958-1977 period) stations?
And you call that ‘tampering’. That seems more than slightly pathetic.
Angell & Korshover extratropical SH stations
Adelaide (Australia), Chatham Island (New Zealand), Puerto Montt (Chile), Gough Island (mid-South Atlantic), Marion Island (South Indian Ocean), Amsterdam Island (South Indian Ocean)
Casey, McMurdo Sound, Amundsen-Scott, Halley Bay, Sanae, Mawson (all Antarctica)
Angell & Korshover (1977) http://journals.ametsoc.org/doi/abs/10.1175/1520-0493%281977%29105%3C0375%3AEOTGCI%3E2.0.CO%3B2
No it wasn’t. He used surface temperatures for his surface temperature plot, and radiosonde for his 100 mb plot. Nice attempt to muddy the water with BS though.
Oh, “muddy the waters”? I wrote “radiosonde stations” (the term used in A&K), “SH extratropical stations”, listed them and linked to the original reference.
You, on the other had, still evade your own ‘error’ (entire SH vs. 30°S-90°S), as well as the vastly greater number of stations in the Hadcrut4 dataset.
I heard you pull this kind of stunt often, but wanted to see it for myself.
You are completely FOS. It doesn’t make a rat’s ass worth of difference to the fraud that is being committed, which you seek to cover up.
This post links to the original reference.
Indeed Magma go ahead and read some more of those transcripts and tell us that it is tantamount to malfeasance or not;the graph says it all- no matter how you obfuscate.
Reblogged this on CraigM350.