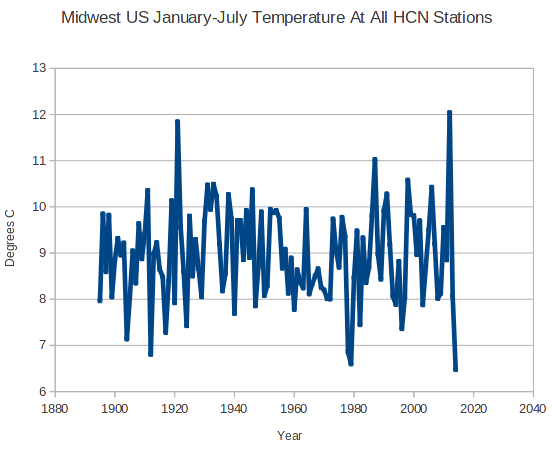
Temperatures in Minnesota, Iowa, Illinois, Indiana, Ohio, Wisconsin and Michigan through July, are the coldest on record this year.
Disrupting the Borg is expensive and time consuming!
Google Search
-
Recent Posts
- Analyzing The Western Water Crisis
- Gaslighting 1924
- “Why Do You Resist?”
- Climate Attribution Model
- Fact Checking NASA
- Fact Checking Grok
- Fact Checking The New York Times
- New Visitech Features
- Ice-Free Arctic By 2014
- Debt-Free US Treasury Forecast
- Analyzing Big City Crime (Part 2)
- Analyzing Big City Crime
- UK Migration Caused By Global Warming
- Climate Attribution In Greece
- “Brown: ’50 days to save world'”
- The Catastrophic Influence of Bovine Methane Emissions on Extraterrestrial Climate Patterns
- Posting On X
- Seventeen Years Of Fun
- The Importance Of Good Tools
- Temperature Shifts At Blue Hill, MA
- CO2²
- Time Of Observation Bias
- Climate Scamming For Profit
- Climate Scamming For Profit
- Back To The Future
Recent Comments
- Bob G on Analyzing The Western Water Crisis
- Bob G on Analyzing The Western Water Crisis
- Bob G on Analyzing The Western Water Crisis
- arn on Analyzing The Western Water Crisis
- Scott Allen on Analyzing The Western Water Crisis
- conrad ziefle on Analyzing The Western Water Crisis
- conrad ziefle on Analyzing The Western Water Crisis
- Bob G on Analyzing The Western Water Crisis
- Bob G on Analyzing The Western Water Crisis
- Bob G on Gaslighting 1924


Which may account for the general derision that greeted their announcement of June 2014 as the “hottest month ever”….
These lunatics are doubling down on their hysterical claims. Too bad this form of entertainment is mostly government funded. It might be really funny otherwise.
You can’t blame them for putting out another “hottest month..” as they are just doing what they are paid to do.
Perhaps I shouldn’t blame the government drones for following the directives from on high…….
However, I will not refrain from ridiculing them for any of their pronouncements that have no resemblance to any truth whatsoever.
What’s wrong with blaming? Didn’t know they were forced at gunpoint to sign with their own blood the contract making them earn obscene amounts of money and travel expenses in exchange for supporting the political agenda?
Ridiculing them is the only enjoyment that this expensive crowd let us have.
There is a subtle, yet critical difference between blaming the government drones for following the dictates from on high and ridiculing them for doing things they know are wrong / fraudulent.
Blaming them for knowingly publishing corrupted / altered / manipulated data results in said drones rationalizing that “ve ver chust following orders”… (Germanic accent intentional) This is the standard mantra of all government employees attempting to rationalize the immoral acts they perform in the name of government. Their supervisors will always rationalize that: “Departmental policies and procedures were followed”.
Ridiculing them for knowing better and then publishing that corrupted / altered / manipulated data anyway, puts the focus where it belongs. On them. For knowingly going along with the fraud. For not having the courage to speak out. For blindly following orders they know are wrong.
Thus I choose to ridicule them.
@Shazaam – Fair enough. I don’t want to restrict my options in that respect. Some people understand it better when you lay blame on someone and he uses excuses. Some people get the point when you makes fun of the target. The mix Tim/Steven is using is fine. Blame them for the fraud when it fits and you have proof and use snappy/sarcastic/ironic remarks when appropriate, e.g. when they contradict themselves again. And again. And a third time.
Every idiot knows that 2014 is weather affecting only 1% of the world, while 2012 is worldwide climate, sanctioned by 97% of impeccable NOAA scientists in 806,247 pal reviewed studies . Only evil deniers funded by the Koch brothers can’t make that distinction.
No, no, no! The Midwest is hot, it’s very hot. I’m the President and I say so. Well, I should have been President, but they stole the election. There’s so much corruption in politics!
But there’s no corruption in Global Warming. Oh it’s so hot. So hot! You wanna buy a carbon credit to cool ya down? I got some cheap credits right here.
The only reason the Midwest might be cool is because the heat is hiding in the ocean. It is! It really is. I’m a Nobel Prize winner, so I know these things. I saw pictures of the ocean caves where the heat is hiding. The caves are dark, filled with water and very spooky. Very mysterious. Stay away from those caves!
The fires in Oregon, Washington State or the drought in California are not really happening either.
Small favor to ask — if you get a chance, can you plot the adjusted temps with this? Or have you done this before already?
I think comparing the combined Great Lakes regional temps graph to Great Lakes ice extent and latest date will go a long way toward demonstrating the laugh-out-loud ridiculousness of the adjustments to reasonable people on the margins of the debate. Much thanks in advance, and keep up the great work!